Strategy vault / Trend following
Exponential Moving Average and Moving Average Crossover with Close Strategy
The Exponential Moving Average (EMA) and Moving Average (MA) Crossover with Close Strategy generates trading signals based on the price movement of an asset relative to its 9-period EMA and 20-period MA. It uses EMA…
Overview
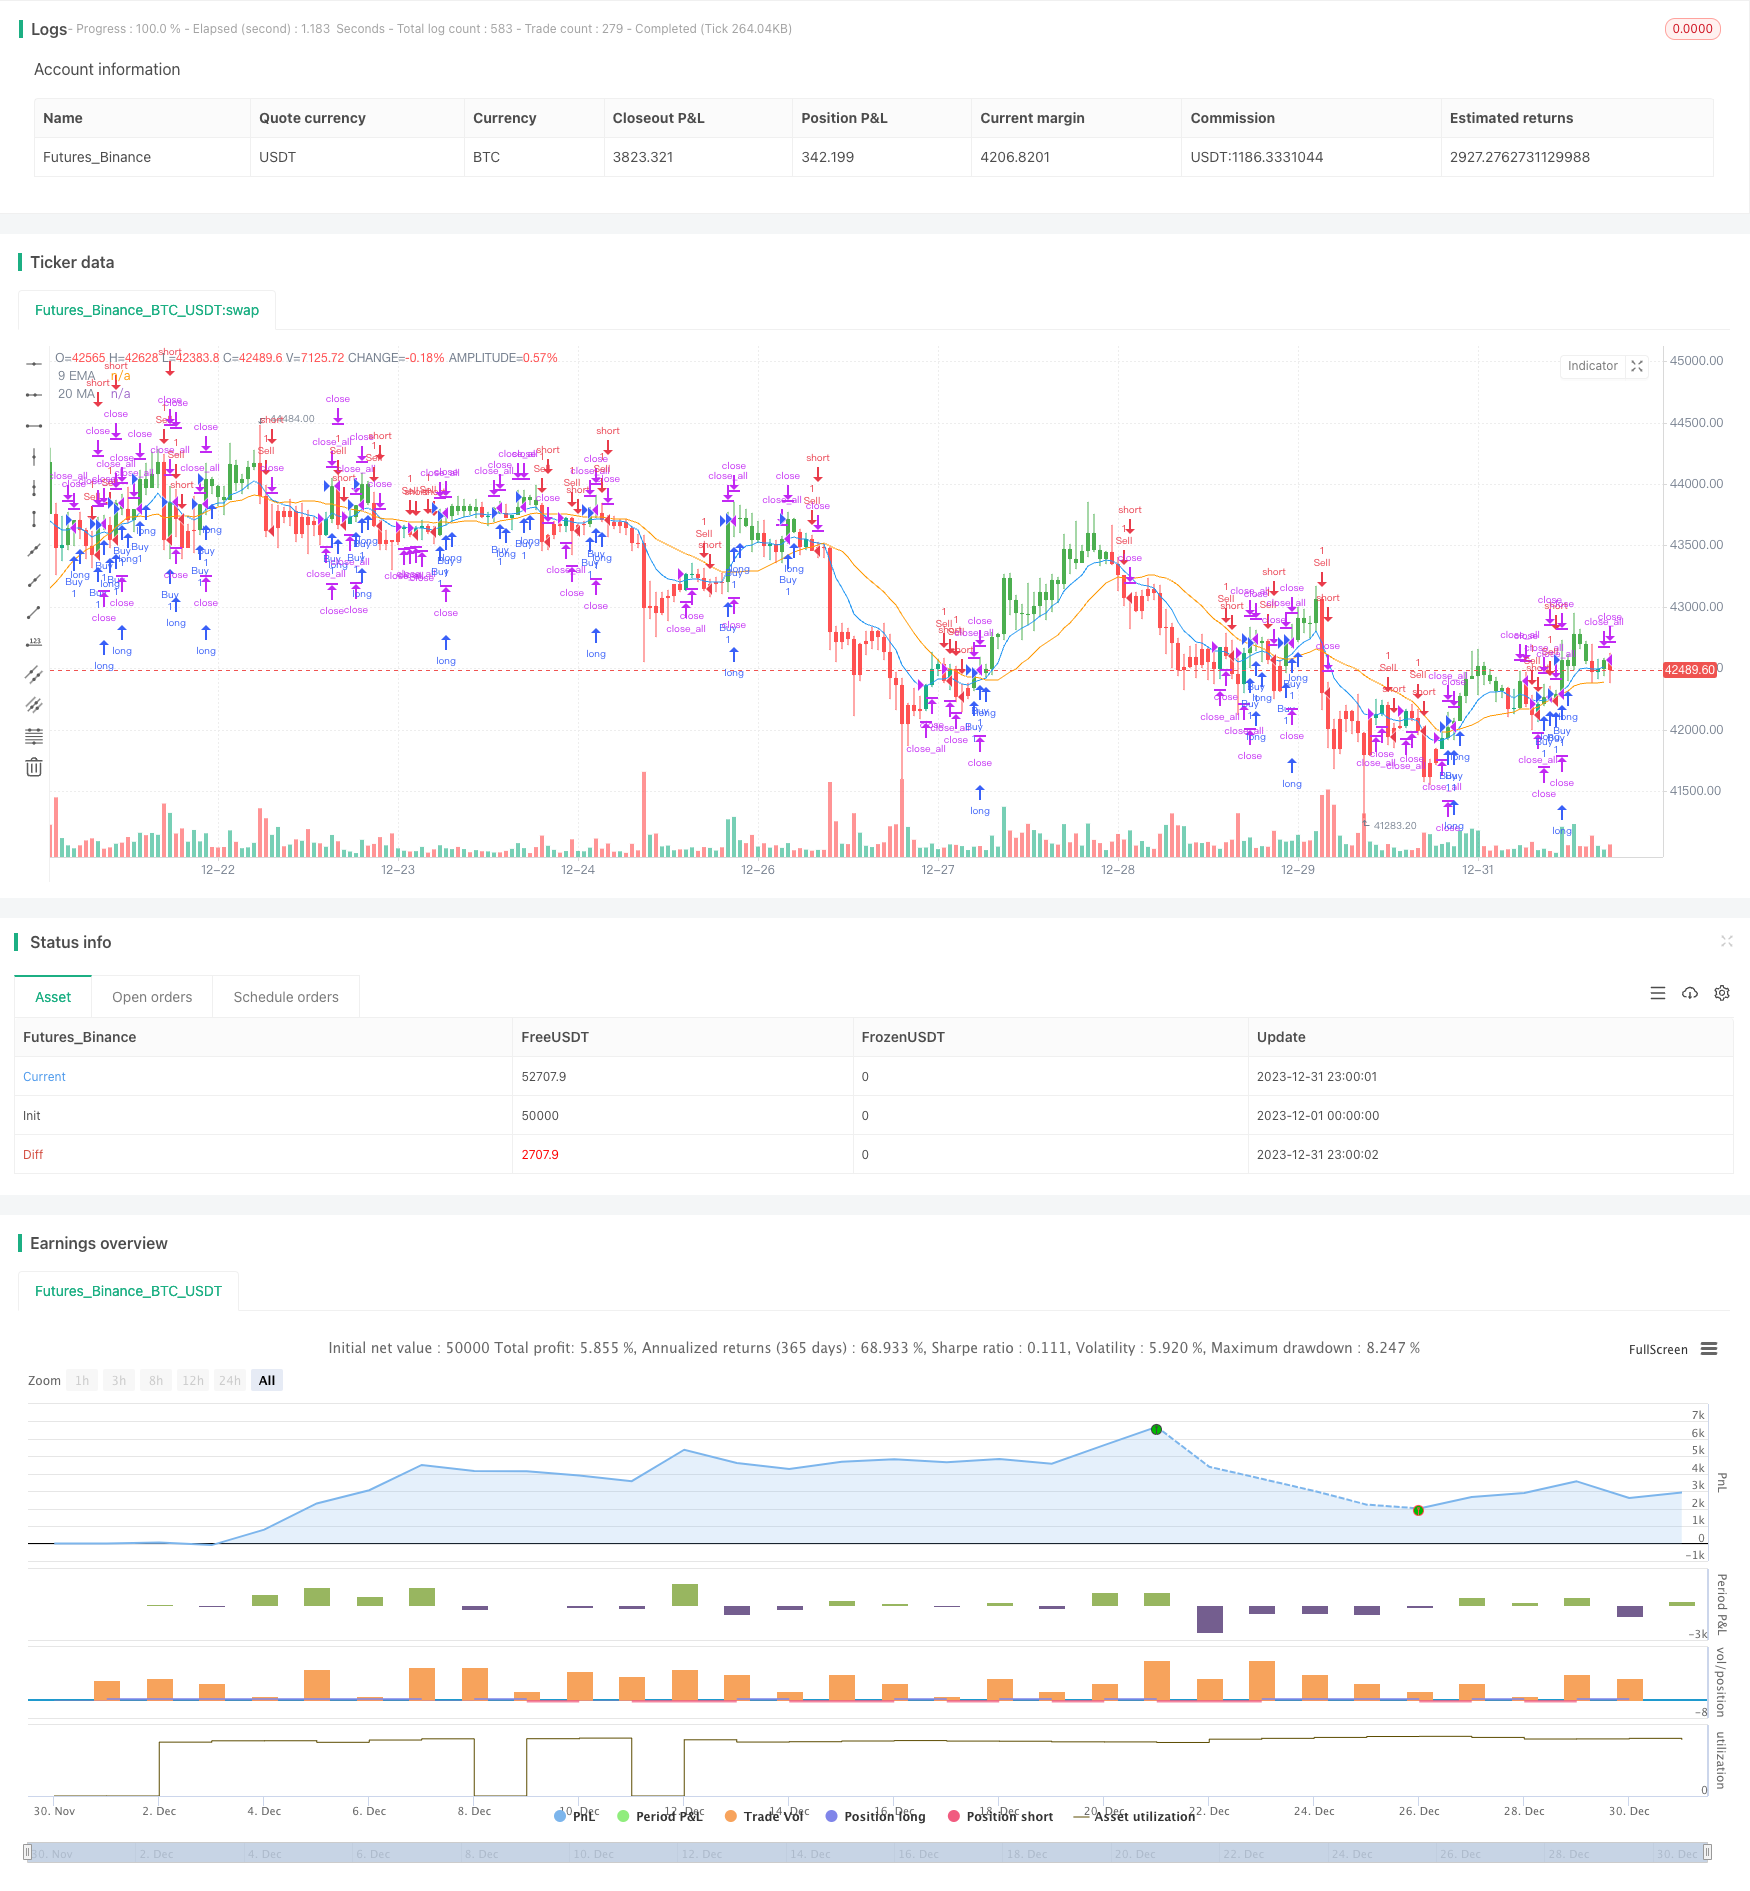
The Exponential Moving Average (EMA) and Moving Average (MA) Crossover with Close Strategy generates trading signals based on the price movement of an asset relative to its 9-period EMA and 20-period MA. It uses EMA and MA crossover signals to determine trend direction for entries and closes positions when the price recrosses the moving averages.
Strategy Logic
EMA and MA Calculation
- ema9 calculates the 9-period Exponential Moving Average of closing prices. EMA gives more weight to recent prices, making it more responsive.
- ma20 calculates the 20-period Simple Moving Average of closing prices. MA is an average of closing prices over 20 periods.
Buy and Sell Conditions
- buyCondition is true when close > both ema9 and ma20. This is interpreted as a bullish signal.
- sellCondition is true when close < both ema9 and ma20. This is interpreted as a bearish signal.
Trade Execution
- When buyCondition is true, execute a long entry order.
- When sellCondition is true, execute a short entry order.
- When price recrosses ema9 or ma20, close any open position.
Candle Coloring
- Green candles indicate buy condition
- Red candles indicate sell condition
- Other candles are default white
EMA and MA Plotting
The 9 EMA and 20 MA are plotted on the chart for visual reference.
Advantage Analysis
The strategy combines two widely used indicators, taking advantage of EMA and MA's trend following and smoothing capabilities to generate more reliable signals.
Crossovers provide clear trend change signals, avoiding bad trades.
Candle color coding visually indicates conditions without complex calculations.
Automated entry and exit execution strictly follows predetermined rules, aiding risk management.
Risk Analysis
As trend following indicators, moving averages can produce many false signals during range-bound periods. Avoid using this strategy during choppy, non-trending markets.
Fast price moves can create lag in MA and EMA values, causing missed opportunities.
EMA and MA parameters significantly impact strategy performance and should be adjusted for different products and timeframes.
Automated strategies cannot adapt to complex situations like a human trader. Preset stop losses and take profits.
Optimization Directions
Test different EMA and MA length combinations to find optimal parameters that maximize true signals and minimize false signals.
Incorporate volatility metrics like ATR to filter higher risk setups and control potential losses.
Combine with other indicators or signals like volume and Bollinger Bands to confirm signal reliability.
Add stop loss and take profit logic to actively manage trade risk. Stops can be price-based or ATR-based.
Summary
The EMA and MA Crossover with Close Strategy uses EMA and MA crossovers to determine trends and signal entries. While simple and automatable, performance is heavily dependent on parameter tuning and market conditions. Regular optimization is needed to adapt to evolving markets.
Source Pine Script
/*backtest
start: 2023-12-01 00:00:00
end: 2023-12-31 23:59:59
period: 1h
basePeriod: 15m
exchanges: [{"eid":"Futures_Binance","currency":"BTC_USDT"}]
*/

//@version=4
strategy("EMA and MA Crossover with Close Strategy", shorttitle="EMA_MA_Close", overlay=true)

// Define the length of the Exponential Moving Average and Moving Average
lengthEMA = 9
lengthMA = 20

// Calculate the 9 EMA and 20 MA
ema9 = ema(close, lengthEMA)
ma20 = sma(close, lengthMA)

// Define the buy and sell conditions
buyCondition = close > ema9 and close > ma20
sellCondition = close < ema9 and close < ma20

// Define the close position condition
closeCondition = crossover(close, ema9) or crossover(close, ma20)

// Execute buy or sell orders
if (buyCondition)
    strategy.entry("Buy", strategy.long)
else if (sellCondition)
    strategy.entry("Sell", strategy.short)

// Close any position if the close condition is met
if (closeCondition)
    strategy.close_all()

// Coloring the candles based on conditions
barcolor(buyCondition ? color.green : na)
barcolor(sellCondition ? color.red : na)

// Plotting the EMA and MA for reference
plot(ema9, color=color.blue, title="9 EMA")
plot(ma20, color=color.orange, title="20 MA")
Published by ChaoZhang on the FMZ strategy square · last modified 2024-01-19. Collected in the Quant Trading Vault. Unvalidated research: re-test with your own data and costs before trusting it.
Build this with AgenKit
A spec is not a trading system. Paste this into your coding agent and AgenKit runs a specialist team — architecture, test-first build, risk gates, review — with paper trading on by default.
/agenkit build a production-grade trading bot with a backtest engine, risk controls and paper trading by default from strategies/Exponential-Moving-Average-and-Moving-Average-Crossover-with-Close-Strategy.md- npx agenkit install engineering-kit in your project
- Paste the command into your agent and approve each phase
- Get tests, backtest, risk controls and a paper-trading switch
Understand it first
Before you run this, read the lesson behind the idea and how to backtest it honestly. Specs like this one are the survivors of an unknown number of trials; deflate their results accordingly.
Related specs
- ATR and Moving Average Crossover Hybrid StrategyPine Script · Trend following · 1h
- Bollinger Bands and RSI Trend Following StrategyPine Script · Trend following · 1h
- Dual Moving Average Crossover Dynamic Position Optimization Strategy with EMA Cross Signal SystemPine Script · Trend following · 1h
- EMA Cross Trend Following Strategy with SMA Stop Loss and Re Entry MechanismPine Script · Trend following · 1h
- EMA and RSI Trend Trading StrategyPine Script · Trend following · 1d
- Adaptive Trend Following StrategyPine Script · Trend following · 4h