Strategy vault / Mean reversion
Fast RSI Gap Trading Strategy for Cryptocurrencies
Overview: This is a fast RSI gap trading strategy designed for cryptocurrency markets. It utilizes both fast RSI indicators and gap patterns on candlestick charts to locate trading opportunities. Principles: The…
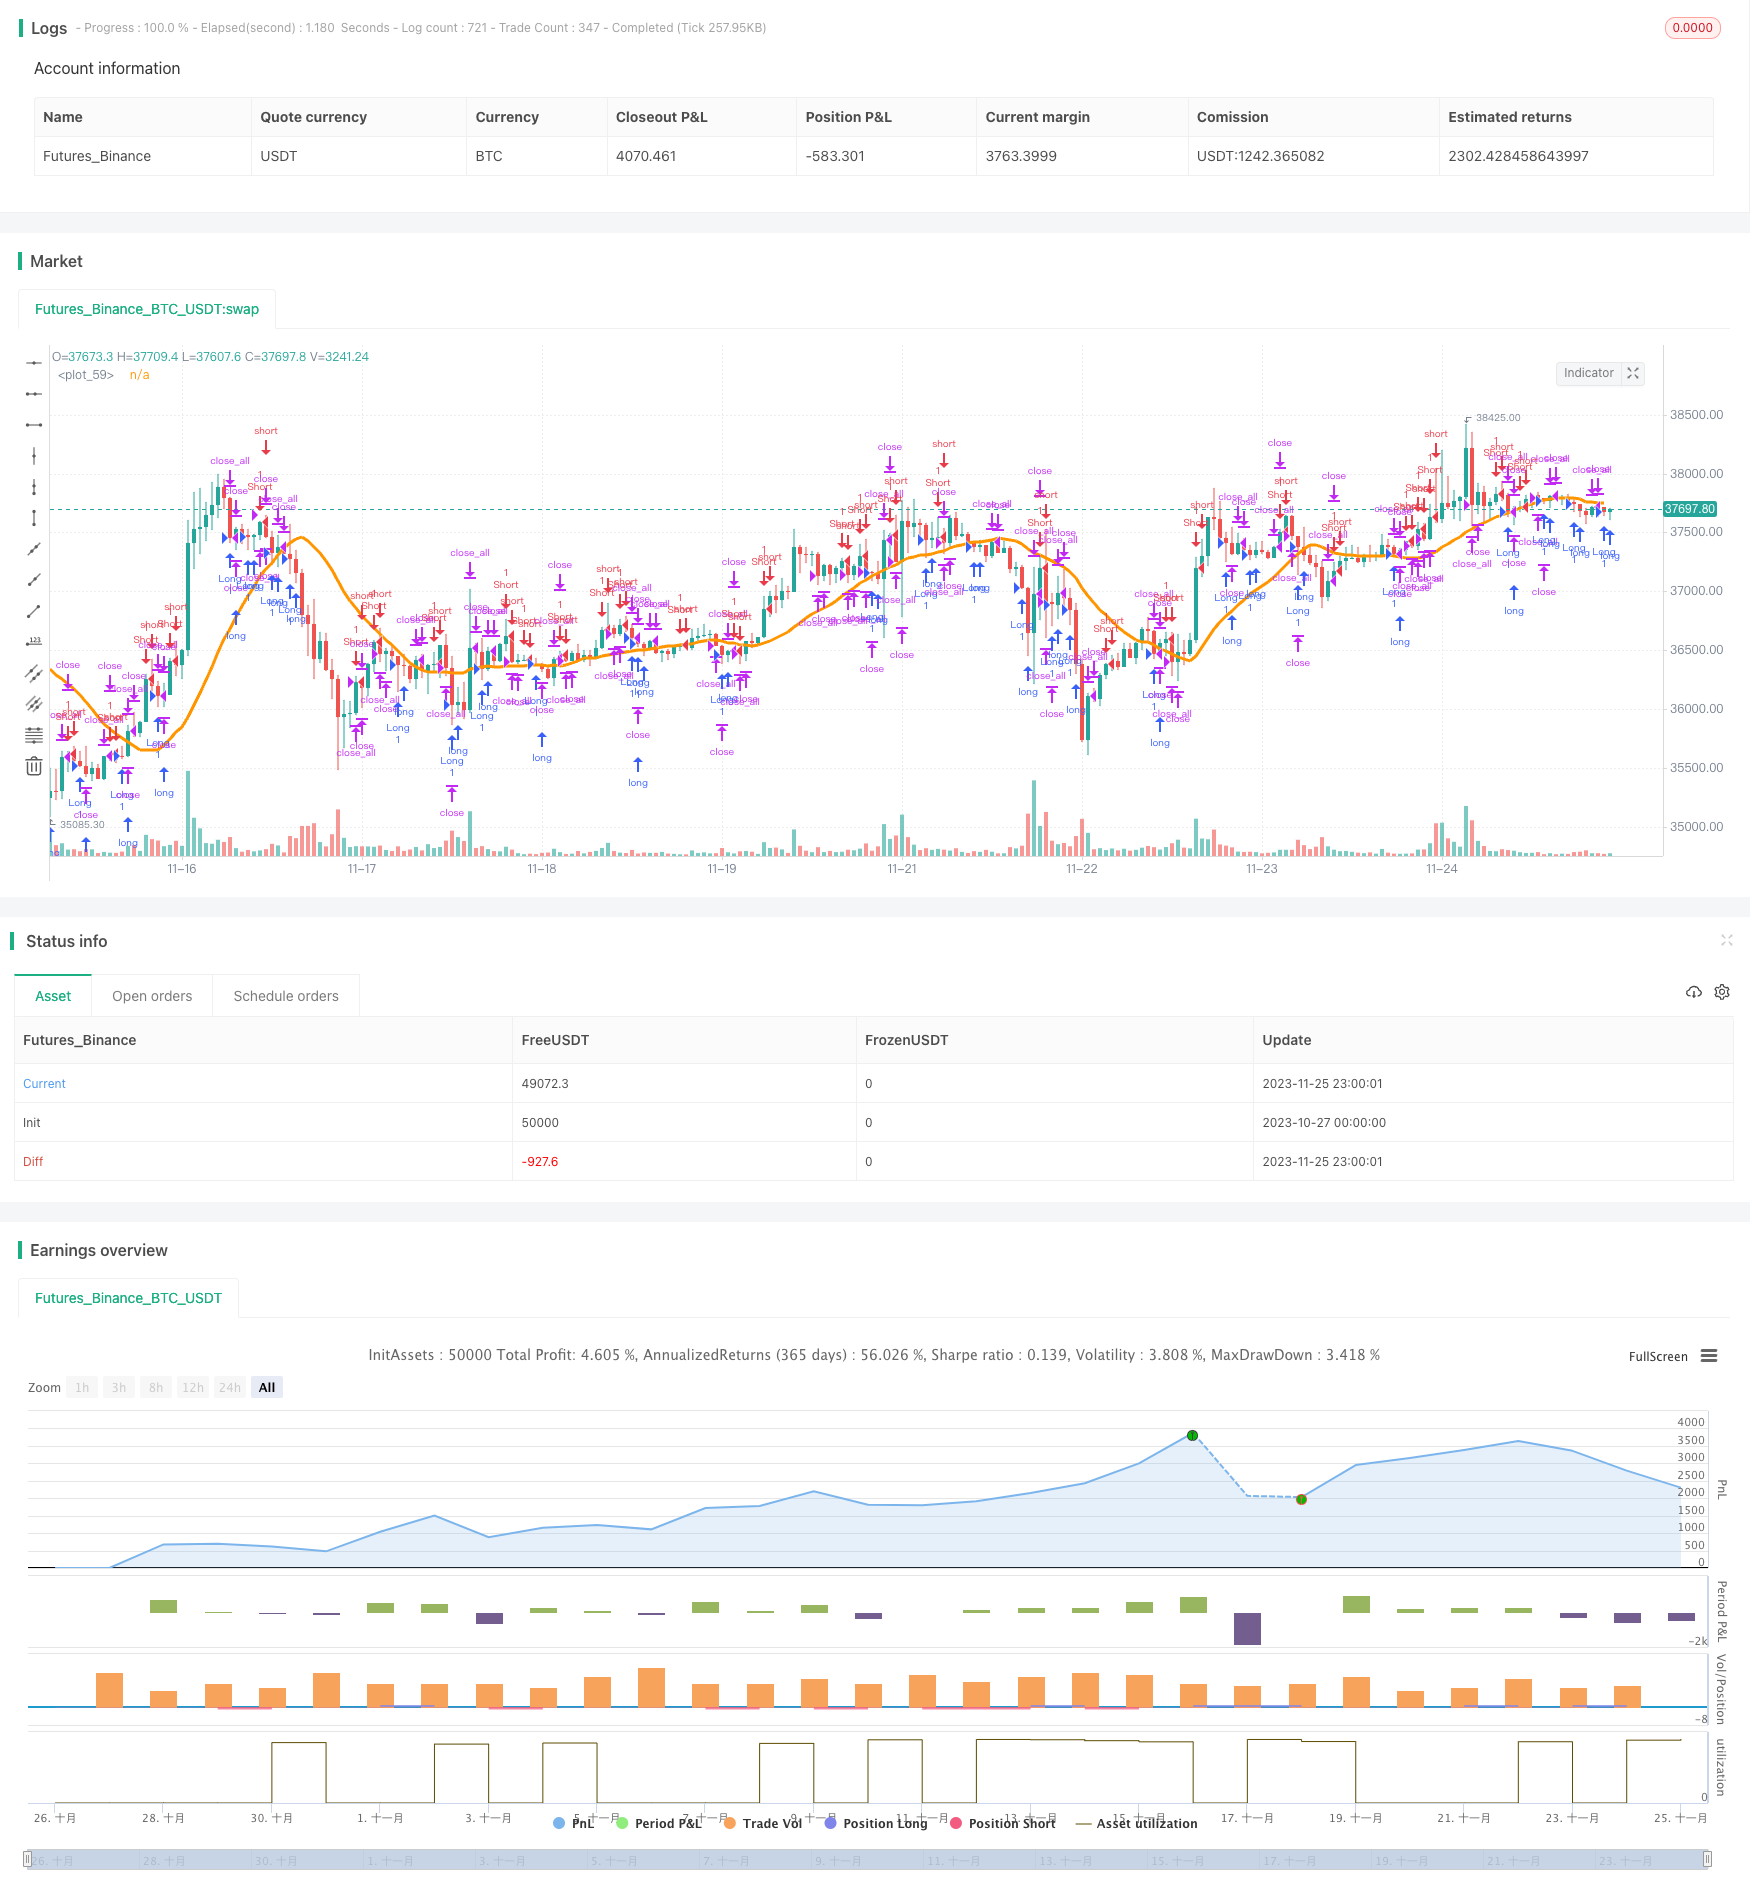
Overview: This is a fast RSI gap trading strategy designed for cryptocurrency markets. It utilizes both fast RSI indicators and gap patterns on candlestick charts to locate trading opportunities.
Principles: The strategy uses two main techniques: fast RSI indicators and gap patterns.
Firstly, it calculates a fast RSI indicator based on only 7 candlesticks. This makes the RSI more sensitive in order to quickly detect overbought/oversold conditions. The RSI upper limit is set at 70 and lower limit at 30. Above 70 is considered overbought while below 30 oversold.
Secondly, it detects gap patterns on candlestick charts. Gaps refer to empty spaces between the current opening price and the previous closing price. Gaps signal high volatility and potential trend reversals.
When a down gap appears while the fast RSI shows oversold condition, go long. When an up gap emerges while the fast RSI indicates overbought status, go short.
In addition, the strategy utilizes other filters including SMA and Min/Max indicators to avoid false signals. Only when passing the filters will actual trading signals be triggered.
Advantages: The biggest advantage of this strategy is catching ultra fast overbought/oversold turns and gap reversal opportunities. It is especially suitable for highly volatile crypto markets to seize quick trend shifts. Compared to regular RSI, the fast RSI reacts much quicker fitting the high frequency nature of crypto trading. The additional filters also help to remove false signals and improve reliability.
Risks:
The main risks facing the strategy include:
The fast RSI may be overly sensitive, causing excessive false signals.
The gaps may just be normal price swings instead of real reversals. The strategy could suffer stop loss risks.
During low volatility periods, positions may be kept idle for extended times.
Improper parameter settings like Min/Max period could lead to diluted signals and low efficiency.
Accordingly, the following methods could help mitigate the above risks:
Adjust fast RSI parameters and increase RSI period to make it less sensitive.
Apply dynamic stop loss to lock in profits. Avoid chasing gap spikes.
Optimize strategy participation rate. Limit involvement during low volatility environments.
Continually backtest and optimize parameters to ensure robust settings.
Enhancement: The main optimization directions include:
Explore other indicators like MACD, KDJ combined with gaps to enhance precision.
Build adaptive stop loss mechanisms based on market volatility.
Incorporate volume indicators like OBV to confirm reversal after gaps.
Optimize filter parameters like Min/Max period to discover best settings to lower false signals.
Research adaptiveness of parameters across different crypto assets.
These efforts could significantly improve the strategy's stability, adaptiveness and reliability.
Conclusion: In summary, the fast RSI gap trading strategy is an efficient approach designed explicitly for volatile crypto markets. By continuous testing and enhancement, it has the potential to reliably catch quick market reversals and achieve consistent profitability.
Parameters
| Name | Default | What it controls |
|---|---|---|
| v_input_1 | true | Long |
| v_input_2 | true | Short |
| v_input_3 | true | Use Fast RSI Strategy |
| v_input_4 | true | Use Min/Max Strategy |
| v_input_5 | false | Use SMA Filter |
| v_input_6 | 20 | SMA Filter Period |
| v_input_7 | 7 | Fast RSI Period |
| v_input_8 | 30 | RSI limit |
| v_input_9_close | 0 | RSI Price: close | high | low | open | hl2 | hlc3 | hlcc4 | ohlc4 |
| v_input_10 | true | RSI Bars |
| v_input_11 | true | Min/Max Bars |
| v_input_12 | false | Show SMA Filter |
| v_input_13 | false | Show Arrows |
| v_input_14 | 2018 | From Year |
| v_input_15 | 2100 | To Year |
| v_input_16 | true | From Month |
| v_input_17 | 12 | To Month |
| v_input_18 | true | From day |
| v_input_19 | 31 | To day |
Source Pine Script
/*backtest
start: 2023-10-27 00:00:00
end: 2023-11-26 00:00:00
period: 1h
basePeriod: 15m
exchanges: [{"eid":"Futures_Binance","currency":"BTC_USDT"}]
*/

//Noro
//2018

//@version=3
strategy(title = "Noro's Fast RSI Strategy v1.5", shorttitle = "Fast RSI str 1.5", overlay = true)

//Settings
needlong = input(true, defval = true, title = "Long")
needshort = input(true, defval = true, title = "Short")
usersi = input(true, defval = true, title = "Use Fast RSI Strategy")
usemm = input(true, defval = true, title = "Use Min/Max Strategy")
usesma = input(false, defval = false, title = "Use SMA Filter")
smaperiod = input(20, defval = 20, minval = 2, maxval = 1000, title = "SMA Filter Period")
fast = input(7, defval = 7, minval = 2, maxval = 50, title = "Fast RSI Period")
limit = input(30, defval = 30, minval = 1, maxval = 100, title = "RSI limit")
rsisrc = input(close, defval = close, title = "RSI Price")
rsibars = input(1, defval = 1, minval = 1, maxval = 20, title = "RSI Bars")
mmbars = input(1, defval = 1, minval = 1, maxval = 5, title = "Min/Max Bars")
showsma = input(false, defval = false, title = "Show SMA Filter")
showarr = input(false, defval = false, title = "Show Arrows")
fromyear = input(2018, defval = 2018, minval = 1900, maxval = 2100, title = "From Year")
toyear = input(2100, defval = 2100, minval = 1900, maxval = 2100, title = "To Year")
frommonth = input(01, defval = 01, minval = 01, maxval = 12, title = "From Month")
tomonth = input(12, defval = 12, minval = 01, maxval = 12, title = "To Month")
fromday = input(01, defval = 01, minval = 01, maxval = 31, title = "From day")
today = input(31, defval = 31, minval = 01, maxval = 31, title = "To day")

//Fast RSI
fastup = rma(max(change(rsisrc), 0), fast)
fastdown = rma(-min(change(rsisrc), 0), fast)
fastrsi = fastdown == 0 ? 100 : fastup == 0 ? 0 : 100 - (100 / (1 + fastup / fastdown))

//Limits
bar = close > open ? 1 : close < open ? -1 : 0
uplimit = 100 - limit
dnlimit = limit

//RSI Bars
upsignal = fastrsi > uplimit ? 1 : 0
dnsignal = fastrsi < dnlimit ? 1 : 0
uprsi = sma(upsignal, rsibars) == 1
dnrsi = sma(dnsignal, rsibars) == 1

//Body
body = abs(close - open)
abody = sma(body, 10)

//MinMax Bars
min = min(close, open)
max = max(close, open)
minsignal = min < min[1] and bar == -1 and bar[1] == -1 ? 1 : 0
maxsignal = max > max[1] and bar == 1 and bar[1] == 1 ? 1 : 0
mins = sma(minsignal, mmbars) == 1
maxs = sma(maxsignal, mmbars) == 1

//SMA Filter
sma = sma(close, smaperiod)
colorsma = showsma ? blue : na
plot(sma, color = colorsma, linewidth = 3)

//Signals
up1 = bar == -1 and (strategy.position_size == 0 or close < strategy.position_avg_price) and dnrsi and body > abody / 5 and usersi
dn1 = bar == 1 and (strategy.position_size == 0 or close > strategy.position_avg_price) and uprsi and body > abody / 5 and usersi
up2 = mins and (close > sma or usesma == false) and fastrsi < 70 and usemm
dn2 = maxs and (close < sma or usesma == false) and fastrsi > 30 and usemm
exit = ((strategy.position_size > 0 and fastrsi > dnlimit and bar == 1) or (strategy.position_size < 0 and fastrsi < uplimit and bar == -1)) and body > abody / 2

//Arrows
col = exit ? black : up1 or dn1 ? blue : up2 or dn2 ? red : na
needup = up1 or up2
needdn = dn1 or dn2
needexitup = exit and strategy.position_size < 0
needexitdn = exit and strategy.position_size > 0
plotarrow(showarr and needup ? 1 : na, colorup = blue, colordown = blue, transp = 0)
plotarrow(showarr and needdn ? -1 : na, colorup = blue, colordown = blue, transp = 0)
plotarrow(showarr and needexitup ? 1 : na, colorup = black, colordown = black, transp = 0)
plotarrow(showarr and needexitdn ? -1 : na, colorup = black, colordown = black, transp = 0)

//Trading
if up1 or up2
    strategy.entry("Long", strategy.long, needlong == false ? 0 : na, when=(time > timestamp(fromyear, frommonth, fromday, 00, 00) and time < timestamp(toyear, tomonth, today, 23, 59)))

if dn1 or dn2
    strategy.entry("Short", strategy.short, needshort == false ? 0 : na, when=(time > timestamp(fromyear, frommonth, fromday, 00, 00) and time < timestamp(toyear, tomonth, today, 23, 59)))

if time > timestamp(toyear, tomonth, today, 23, 59) or exit
strategy.close_all()Published by ChaoZhang on the FMZ strategy square · last modified 2023-11-27. Collected in the Quant Trading Vault. Unvalidated research: re-test with your own data and costs before trusting it.
Build this with AgenKit
A spec is not a trading system. Paste this into your coding agent and AgenKit runs a specialist team — architecture, test-first build, risk gates, review — with paper trading on by default.
/agenkit build a production-grade trading bot with a backtest engine, risk controls and paper trading by default from strategies/Fast-RSI-Gap-Trading-Strategy-for-Cryptocurrencies.md- npx agenkit install engineering-kit in your project
- Paste the command into your agent and approve each phase
- Get tests, backtest, risk controls and a paper-trading switch
Understand it first
Before you run this, read the lesson behind the idea and how to backtest it honestly. Specs like this one are the survivors of an unknown number of trials; deflate their results accordingly.
Related specs
- Advanced 15 Minute Chart Trading Signal StrategyPine Script · Mean reversion · 3h
- BONK Multi Factor Trading StrategyPine Script · Mean reversion · 1d
- Customizable Non Repainting HTF MACD MFI Scalable Bot StrategyPine Script · Mean reversion · 1d
- Dynamic Adaptive Multi Timeframe Trend Following and Range Reversal Hybrid StrategyPine Script · Mean reversion · 2d
- MACD Cross Period Trading StrategyPine Script · Mean reversion · 1d
- MACD Long Reversal StrategyPine Script · Mean reversion · 1d