Strategy vault / Mean reversion
Fibonacci Golden Ratio and Relative Strength RSI Strategy
The Fibonacci golden ratio and relative strength index (RSI) strategy is an intraday trading strategy. It combines the Fibonacci golden ratio principle and the RSI indicator to issue buy or sell signals when price…
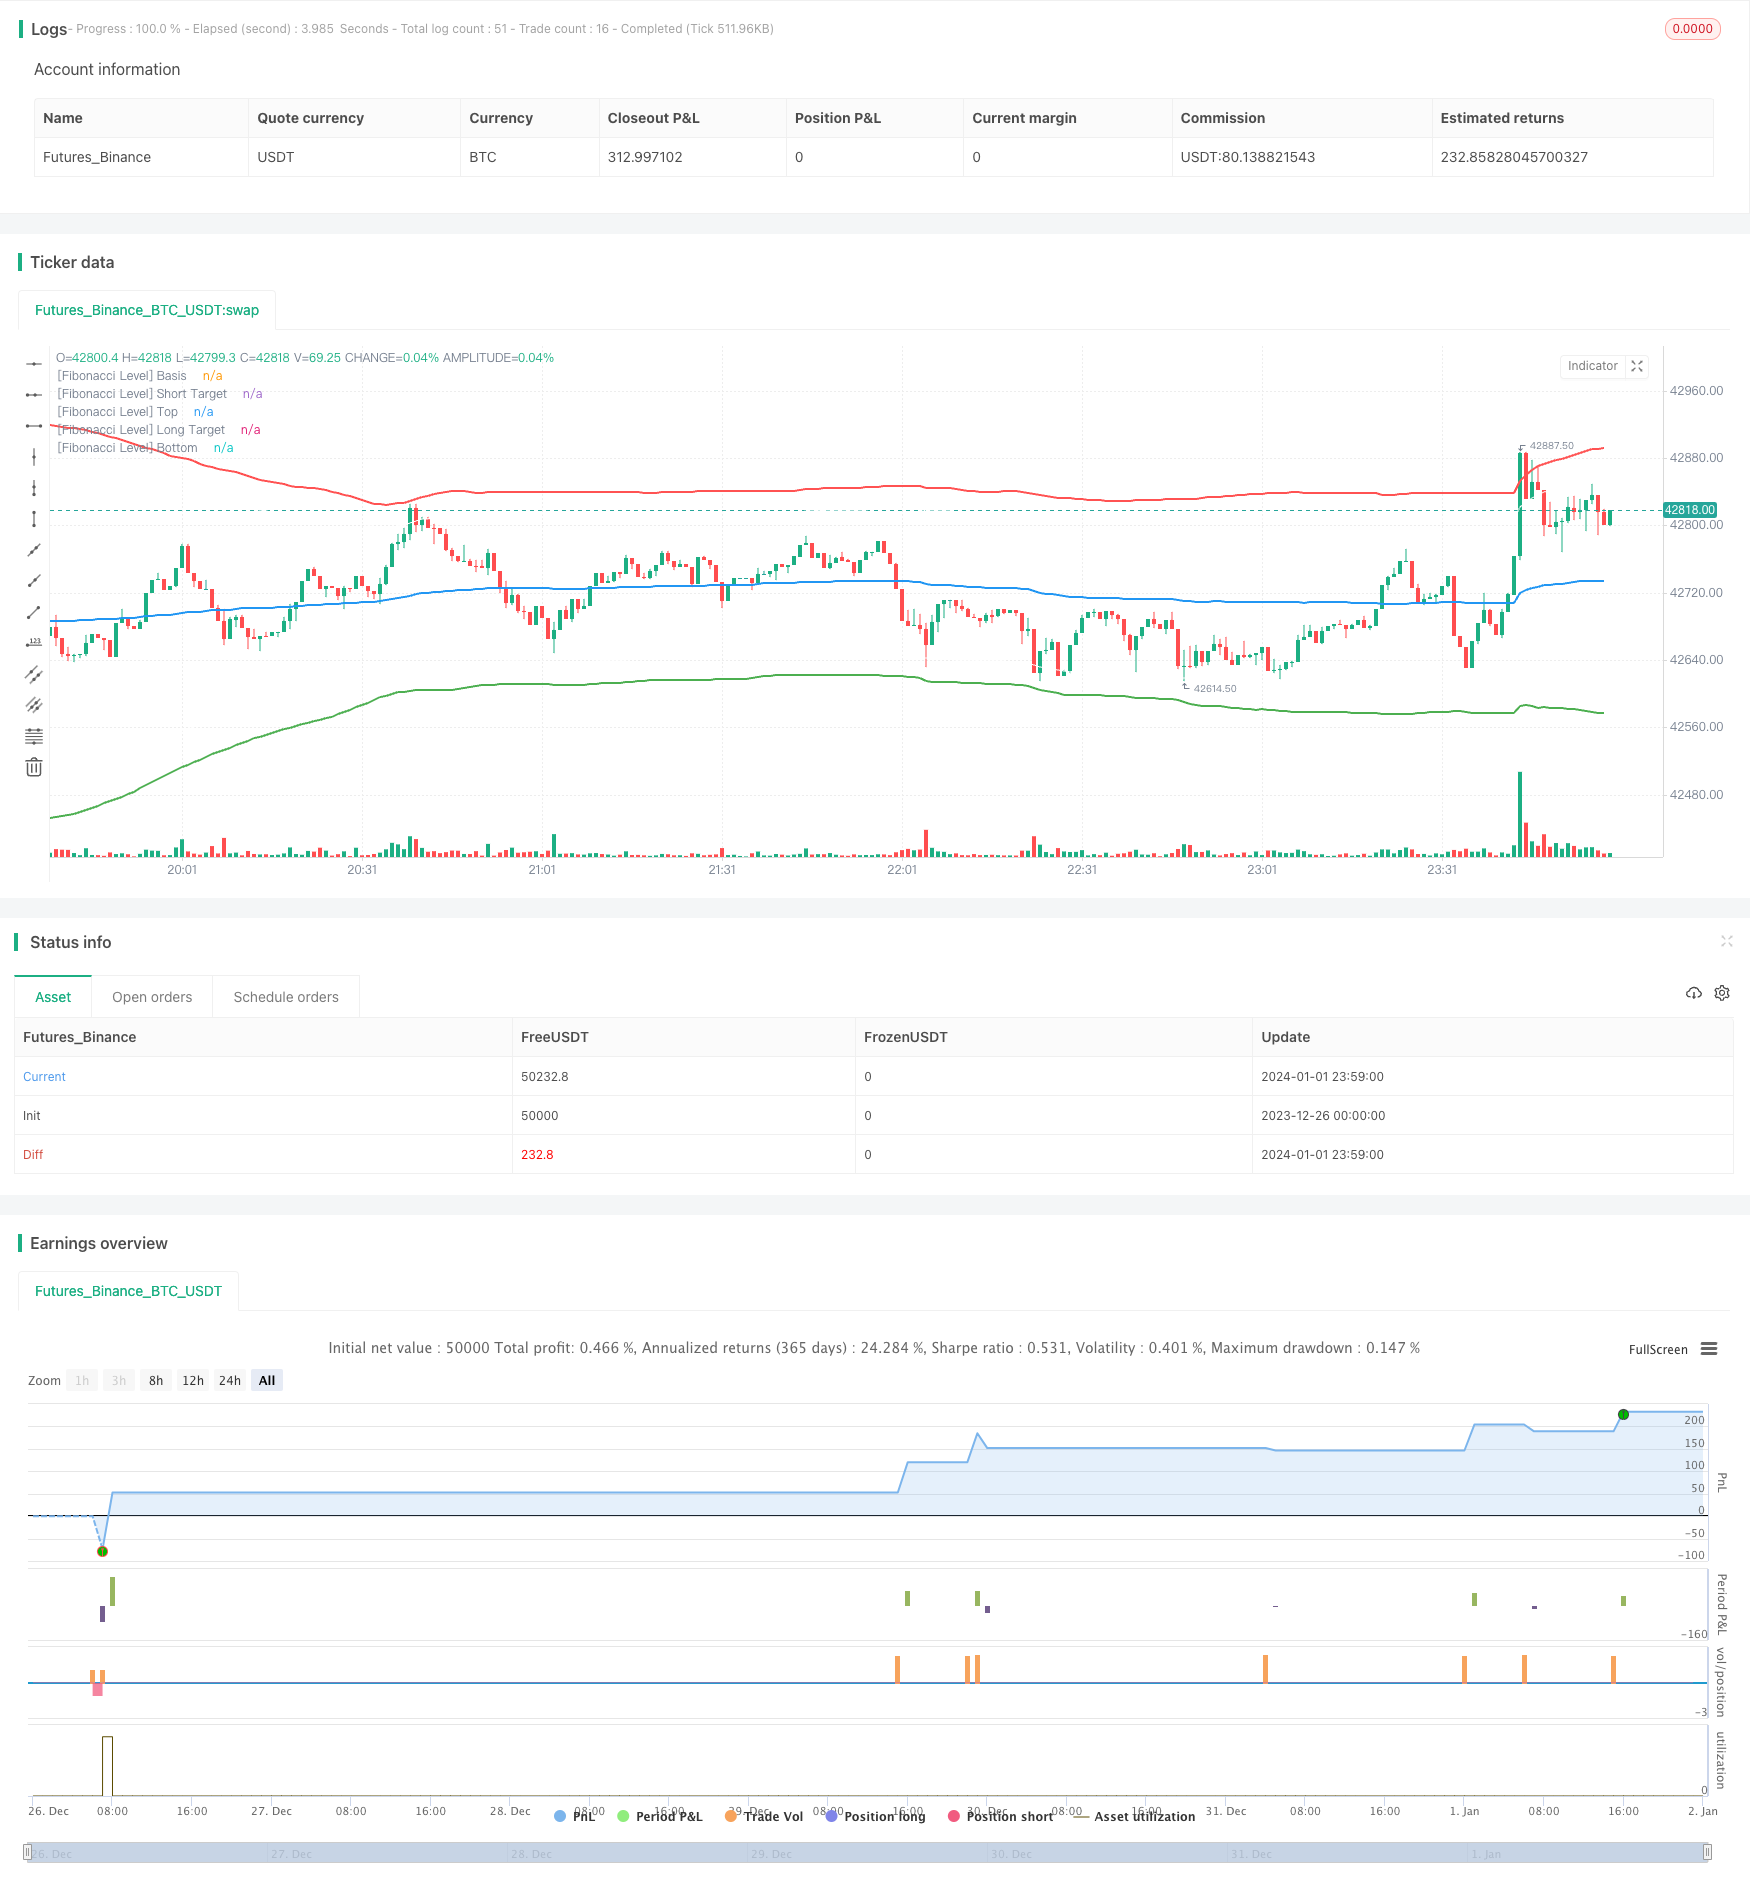
Overview
The Fibonacci golden ratio and relative strength index (RSI) strategy is an intraday trading strategy. It combines the Fibonacci golden ratio principle and the RSI indicator to issue buy or sell signals when price approaches golden ratio key points and RSI shows overbought or oversold status.
Strategy Logic
Calculate the price midline based on certain period of bars.
Calculate golden ratio key points including 0.618 level and 1 level based on midline and standard deviation.
When price approaches golden ratio key points, check if RSI enters overbought or oversold zone.
Issue buy or sell signals if both golden ratio rule and RSI condition are met.
Set stop loss and take profit to control risks.
Advantage Analysis
Combining multiple indicators improves signal quality and reduces false signals.
Utilize support/resistance feature of golden ratio rule to ensure quality entry.
RSI measures market psychology to avoid extreme reversals.
Suitable for high frequency intraday trading to accumulate profits from multiple small trades.
Risk Analysis
Golden ratio cannot guarantee 100% price reversal.
RSI may give misleading signals, needs to combine price action.
Too tight stop loss could be stopped out by price fluctuations.
High frequency trading requires more trading costs and stricter risk control.
Solutions:
Strictly follow stop loss rule to limit single trade loss.
Loosen RSI parameters properly to avoid misleading signals.
Optimize stop loss point to reduce stopping out probability while ensuring effective stop loss.
Optimization Directions
Test results from different cycle period parameters.
Try combining other indicators like MACD, Bollinger Bands etc to improve signal quality.
Research different stop loss strategies to find optimal configurations.
Evaluate optimal holding period to balance profit and cost.
Conclusion
The Fibonacci golden ratio and RSI strategy filters noise trades through dual confirmation. Compared to single indicator strategies, it generates higher quality trading signals. With parameter optimization and strict rule following, this strategy can become an effective intraday trading tool.
Parameters
| Name | Default | What it controls |
|---|---|---|
| v_input_1 | 2 | Stop Loss (%) |
| v_input_2 | 14 | [RSI] Length |
| v_input_3 | 30 | [RSI] Over Sold % |
| v_input_4 | 70 | [RSI] Over Bought % |
| v_input_5 | 200 | [Fibonacci] Length |
| v_input_6_hlc3 | 0 | [Fibonacci] Source: hlc3 | high | low | open | hl2 | close | hlcc4 | ohlc4 |
| v_input_7 | 3 | [Fibonacci] Multiplier |
| v_input_8 | 764 | [Fibonacci] Level |
Source Pine Script
/*backtest
start: 2023-12-26 00:00:00
end: 2024-01-02 00:00:00
period: 1m
basePeriod: 1m
exchanges: [{"eid":"Futures_Binance","currency":"BTC_USDT"}]
*/

// This source code is subject to the terms of the Mozilla Public License 2.0 at https://mozilla.org/MPL/2.0/
// © MohamedYAbdelaziz

// Intraday Trading
// Best used for Short Timeframes [1-30 Minutes]
// If you have any modifications please tell me to update it

//@version=4
strategy(title="Fibonacci + RSI - Strategy", overlay=true, default_qty_type=strategy.percent_of_equity, default_qty_value=100, initial_capital=10000, currency=currency.USD)

// Inputs
timeFilter = year >= 2000
    // Stop Loss %
loss_percent = input(title="Stop Loss (%)", minval=0.0, step=0.1, defval=2) * 0.001
    // RSI Inputs
len = input(title="[RSI] Length", minval=0, step=1, defval=14)
overSold = input(title="[RSI] Over Sold %", defval=30)
overBought = input(title="[RSI] Over Bought %", defval=70)
    // Fibonacci Levels
length = input(title="[Fibonacci] Length", defval=200, minval=1)
src = input(hlc3, title="[Fibonacci] Source")
mult = input(title="[Fibonacci] Multiplier", defval=3.0, minval=0.001, maxval=50)
level = input(title="[Fibonacci] Level", defval=764)


// Calculate Fibonacci
basis = vwma(src, length)
dev = mult * stdev(src, length)
fu764= basis + (0.001*level*dev)
fu1= basis + (1*dev)
fd764= basis - (0.001*level*dev)
fd1= basis - (1*dev)

// Calculate RSI
vrsi = rsi(close, len)

// Calculate the Targets
targetUp = fd764
targetDown = fu764
    // Actual Targets
bought = strategy.position_size[0] > strategy.position_size[1]
exit_long = valuewhen(bought, targetUp, 0)
sold = strategy.position_size[0] < strategy.position_size[1]
exit_short = valuewhen(sold, targetDown, 0)

// Calculate Stop Losses
stop_long = strategy.position_avg_price * (1 - loss_percent)
stop_short = strategy.position_avg_price * (1 + loss_percent)

// Conditions to Open Trades
openLong = low < fd1 and crossover(vrsi[1], overSold)
openShort = high > fu1 and crossunder(vrsi[1], overBought)

// Conditions to Close Trades
closeLong = high > exit_long
closeShort = low < exit_short


// Plots
plot(basis, color=color.blue, linewidth=2, title="[Fibonacci Level] Basis")
plot(fu764, color=color.white, linewidth=1, title="[Fibonacci Level] Short Target")
plot(fu1, color=color.red, linewidth=2, title="1", title="[Fibonacci Level] Top")
plot(fd764, color=color.white, linewidth=1, title="[Fibonacci Level] Long Target")
plot(fd1, color=color.green, linewidth=2, title="1", title="[Fibonacci Level] Bottom")


// Strategy Orders
if timeFilter
    // Entry Orders
    strategy.entry(id="Long", long=true, when=openLong and high < targetUp, limit=close)
    strategy.entry(id="Short", long=false, when=openShort and low > targetDown, limit=close)

    // Exit Orders
    strategy.exit(id="Long", when=closeLong and strategy.position_size > 0, limit=exit_long, stop=stop_long)
strategy.exit(id="Short", when=closeShort and strategy.position_size < 0, limit=exit_short, stop=stop_short)Published by ChaoZhang on the FMZ strategy square · last modified 2024-01-03. Collected in the Quant Trading Vault. Unvalidated research: re-test with your own data and costs before trusting it.
Build this with AgenKit
A spec is not a trading system. Paste this into your coding agent and AgenKit runs a specialist team — architecture, test-first build, risk gates, review — with paper trading on by default.
/agenkit build a production-grade trading bot with a backtest engine, risk controls and paper trading by default from strategies/Fibonacci-Golden-Ratio-and-Relative-Strength-RSI-Strategy.md- npx agenkit install engineering-kit in your project
- Paste the command into your agent and approve each phase
- Get tests, backtest, risk controls and a paper-trading switch
Understand it first
Before you run this, read the lesson behind the idea and how to backtest it honestly. Specs like this one are the survivors of an unknown number of trials; deflate their results accordingly.
Related specs
- Multi Timeframe Gold Reversal Tracking StrategyPine Script · Mean reversion · 2h
- Quantitative Trading Strategy Based on Bollinger Bands and RSIPine Script · Mean reversion · 1h
- RSI Fibonacci Retracement StrategyPine Script · Mean reversion · 1d
- MACD RSI and EMA StrategyPine Script · Mean reversion · 1d
- Multi Indicator Synergistic Trading Strategy with Bollinger Bands Fibonacci MACD and RSIPine Script · Mean reversion · 2h
- RSI Reversal Fibonacci Bollinger Bands Quantitative StrategyPine Script · Mean reversion · 1h