Strategy vault / Machine learning
Flawless Victory Quantitative Trading Strategy Based on Double BB Indicators and RSI
This strategy is a quantitative trading strategy based on the Bollinger Bands indicator and the Relative Strength Index (RSI) indicator. This strategy uses machine learning methods to backtest and optimize parameters…
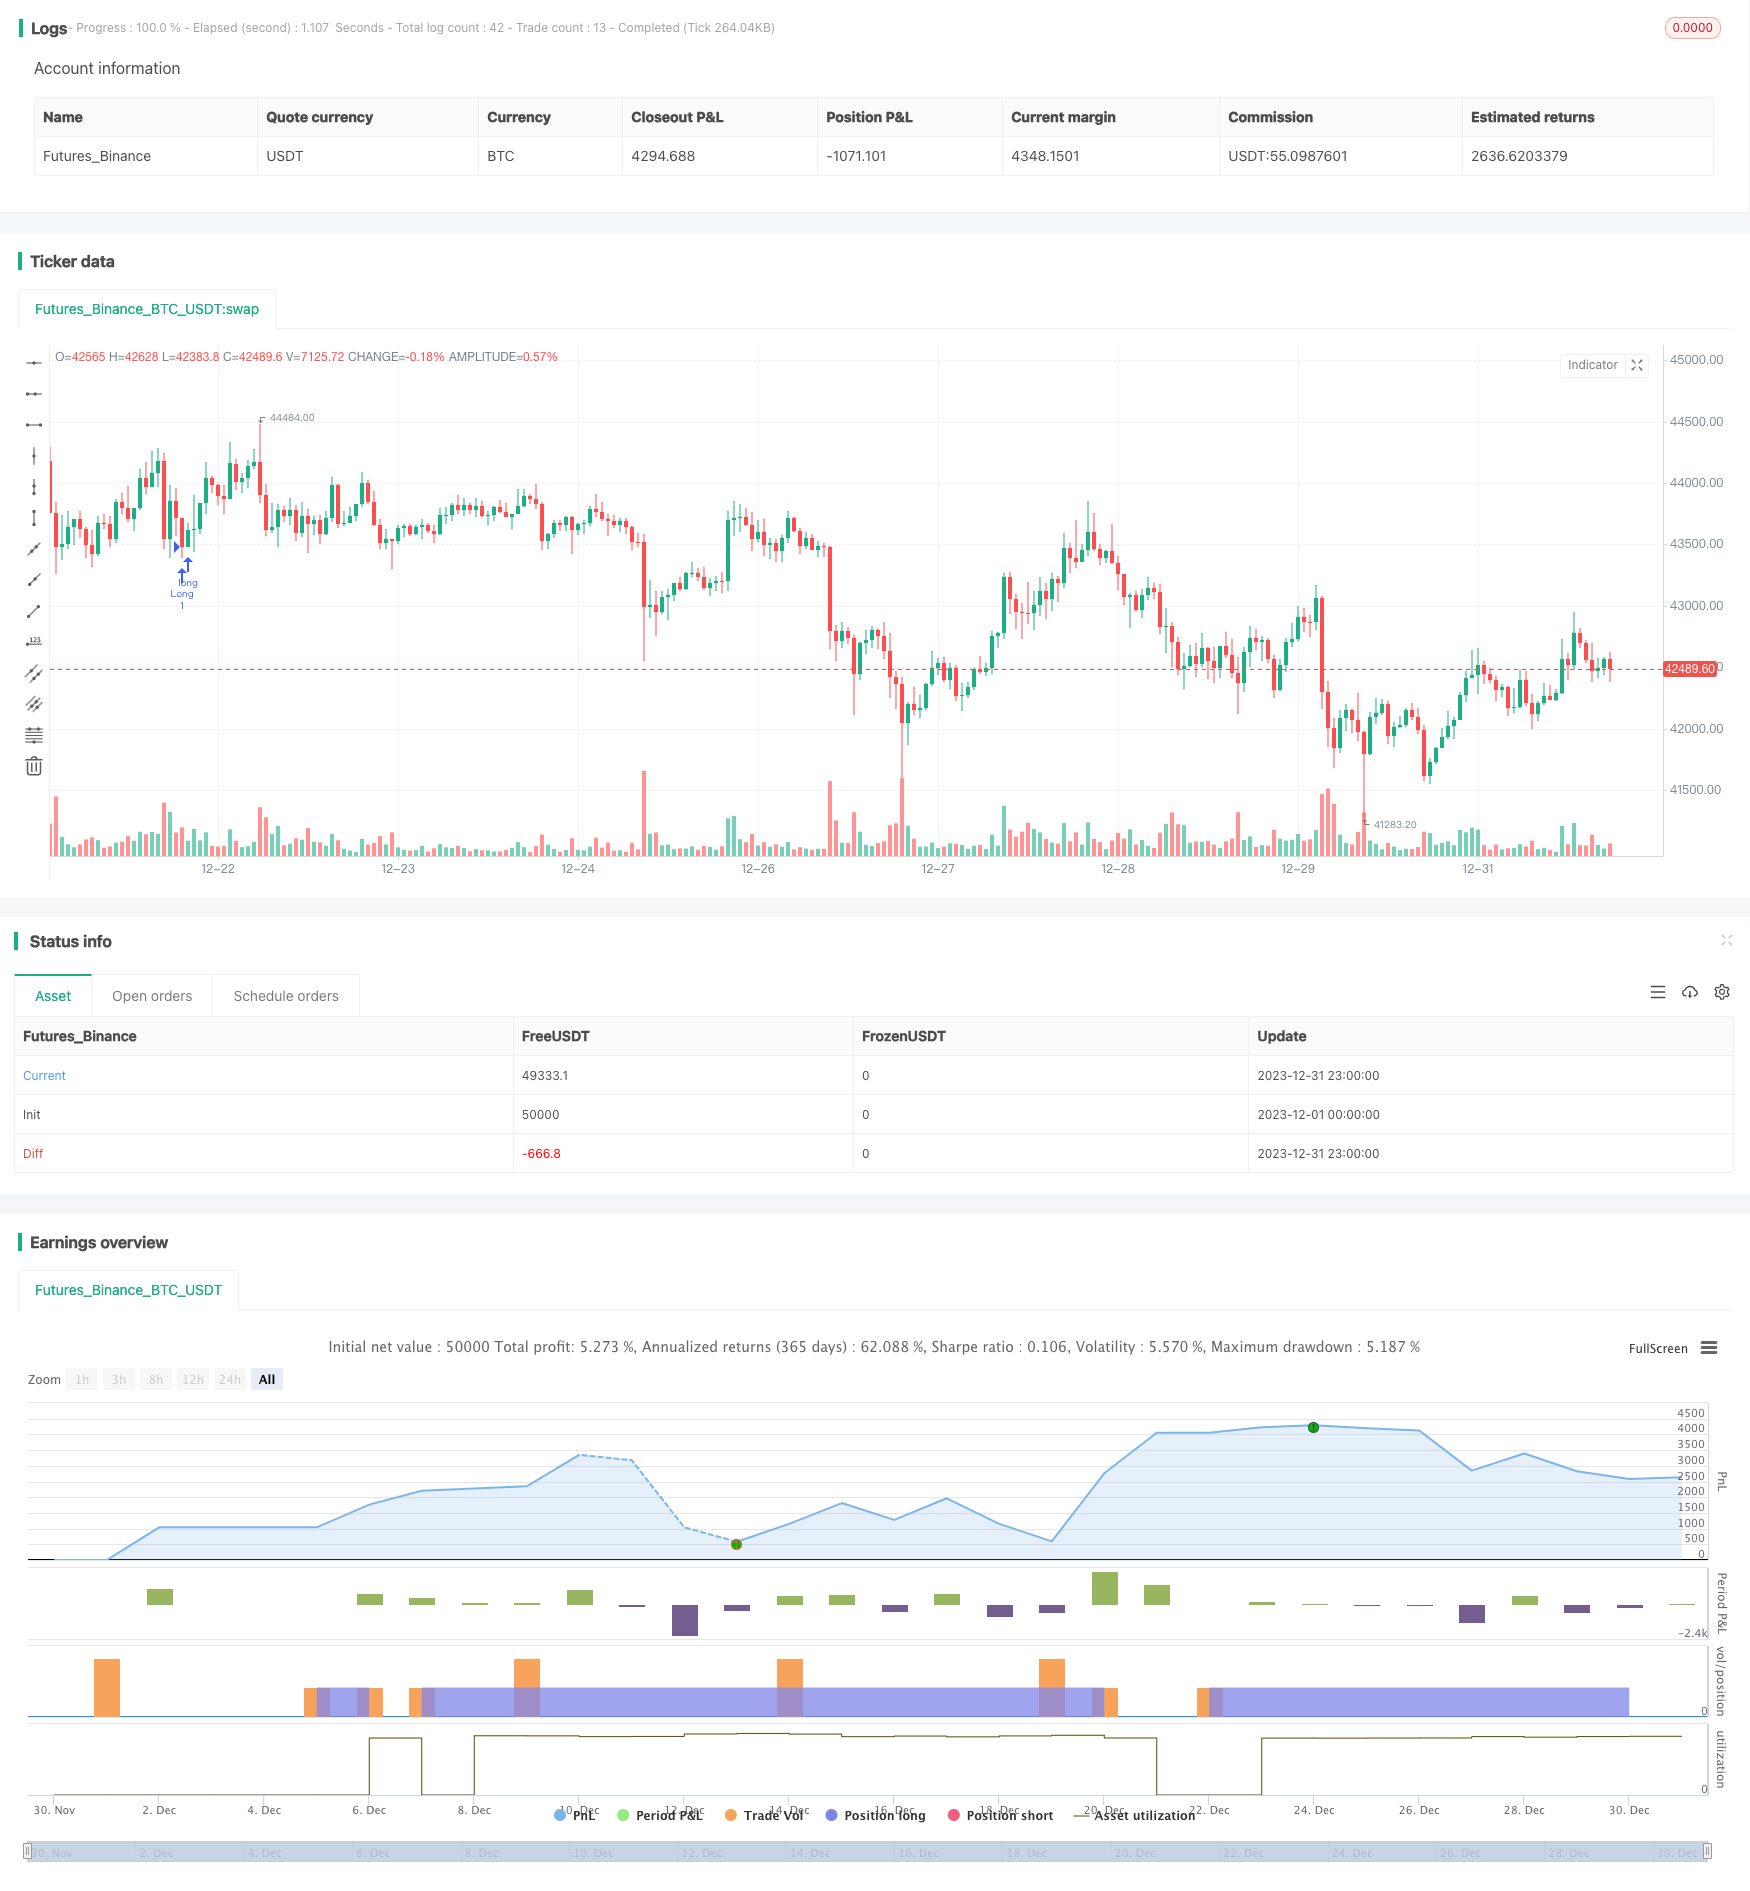
Overview
This strategy is a quantitative trading strategy based on the Bollinger Bands indicator and the Relative Strength Index (RSI) indicator. This strategy uses machine learning methods to backtest and optimize parameters over nearly 1 year of historical data using Python language, finding the optimal parameter combination.
Strategy Principles
The trading signals of this strategy come from the combined judgement of double Bollinger Bands and RSI indicators. Among them, the Bollinger Bands indicator is the volatility channel calculated based on the price standard deviation. It generates trading signals when the price approaches or touches the channel. The RSI indicator judges the overbought and oversold situation of the price.
Specifically, a buy signal is generated when the closing price is below the lower rail of 1.0 standard deviations and RSI is greater than 42 at the same time. A sell signal is generated when the closing price is above the upper rail of 1.0 standard deviations and RSI is greater than 70 at the same time. In addition, this strategy also sets two sets of BB and RSI parameters, which are used for entry and stop loss closing positions respectively. These parameters are optimal values obtained through extensive backtesting and machine learning.
Advantage Analysis
The biggest advantage of this strategy is the accuracy of parameters. Through machine learning methods, each parameter is obtained through comprehensive backtesting to achieve the best Sharpe ratio. This ensures both the return rate of the strategy and controls risks. In addition, the combination of double indicators also improves the accuracy and win rate of signals.
Risk Analysis
The main risk of this strategy comes from the setting of stop loss points. If the stop loss point is set too large, it will not effectively control losses. In addition, if the stop loss point does not properly calculate other trading costs such as commissions and slippage, it will also increase risks. To reduce risks, it is recommended to adjust the stop loss magnitude parameter to reduce trading frequency, while calculating a reasonable stop loss position.
Optimization Directions
There is still room for further optimization of this strategy. For example, you can try to change the length parameters of Bollinger Bands, or adjust the overbought and oversold thresholds of RSI. You can also try to introduce other indicators to build a multi-indicator combination. This may increase the profit space and stability of the strategy.
Summary
This strategy combines double BB indicators and RSI indicators, and obtains optimal parameters through machine learning methods to achieve high returns and controllable risk levels. It has the advantages of combined indicator judgement and parameter optimization. With continuous improvement, this strategy has the potential to become an excellent quantitative trading strategy.
Parameters
| Name | Default | What it controls |
|---|---|---|
| v_input_1 | true | Version 1 - Doesn't Use SL/TP |
| v_input_2 | false | Version 2 - Uses SL/TP |
| v_input_3 | 6.604 | Stop Loss % |
| v_input_4 | 2.328 | Take Profit % |
Source Pine Script
/*backtest
start: 2023-12-01 00:00:00
end: 2023-12-31 23:59:59
period: 1h
basePeriod: 15m
exchanges: [{"eid":"Futures_Binance","currency":"BTC_USDT"}]
*/

// @version=4
// This source code is subject to the terms of the Mozilla Public License 2.0 at https://mozilla.org/MPL/2.0/
// © Bunghole 2020
strategy(overlay=true, shorttitle="Flawless Victory Strategy" )

// Stoploss and Profits Inputs
v1 = input(true, title="Version 1 - Doesn't Use SL/TP")
v2 = input(false, title="Version 2 - Uses SL/TP")
stoploss_input = input(6.604, title='Stop Loss %', type=input.float, minval=0.01)/100
takeprofit_input = input(2.328, title='Take Profit %', type=input.float, minval=0.01)/100
stoploss_level = strategy.position_avg_price * (1 - stoploss_input)
takeprofit_level = strategy.position_avg_price * (1 + takeprofit_input)

//SL & TP Chart Plots
plot(v2 and stoploss_input and stoploss_level ? stoploss_level: na, color=color.red, style=plot.style_linebr, linewidth=2, title="Stoploss")
plot(v2 and takeprofit_input ? takeprofit_level: na, color=color.green, style=plot.style_linebr, linewidth=2, title="Profit")

// Bollinger Bands 1
length = 20
src1 = close
mult = 1.0
basis = sma(src1, length)
dev = mult * stdev(src1, length)
upper = basis + dev
lower = basis - dev

// Bollinger Bands 2
length2 = 17
src2 = close
mult2 = 1.0
basis2 = sma(src1, length2)
dev2 = mult2 * stdev(src2, length2)
upper2 = basis2 + dev2
lower2 = basis2 - dev2

// RSI
len = 14
src = close
up = rma(max(change(src), 0), len)
down = rma(-min(change(src), 0), len)
rsi = down == 0 ? 100 : up == 0 ? 0 : 100 - 100 / (1 + up / down)

// Strategy Parameters
RSILL= 42
RSIUL= 70
RSILL2= 42
RSIUL2= 76

rsiBuySignal = rsi > RSILL
rsiSellSignal = rsi > RSIUL
rsiBuySignal2 = rsi > RSILL2
rsiSellSignal2 = rsi > RSIUL2

BBBuySignal = src < lower
BBSellSignal = src > upper
BBBuySignal2 = src2 < lower2
BBSellSignal2 = src2 > upper2

// Strategy Long Signals
Buy = rsiBuySignal and BBBuySignal
Sell = rsiSellSignal and BBSellSignal
Buy2 = rsiBuySignal2 and BBBuySignal2
Sell2 = rsiSellSignal2 and BBSellSignal2

if v1 == true
    strategy.entry("Long", strategy.long, when = Buy, alert_message = "v1 - Buy Signal!")
    strategy.close("Long", when = Sell, alert_message = "v1 - Sell Signal!")

if v2 == true
    strategy.entry("Long", strategy.long, when = Buy2, alert_message = "v2 - Buy Signal!")
    strategy.close("Long", when = Sell2, alert_message = "v2 - Sell Signal!")
    strategy.exit("Stoploss/TP", "Long", stop = stoploss_level, limit = takeprofit_level)
Published by ChaoZhang on the FMZ strategy square · last modified 2024-01-29. Collected in the Quant Trading Vault. Unvalidated research: re-test with your own data and costs before trusting it.
Build this with AgenKit
A spec is not a trading system. Paste this into your coding agent and AgenKit runs a specialist team — architecture, test-first build, risk gates, review — with paper trading on by default.
/agenkit build a production-grade trading bot with a backtest engine, risk controls and paper trading by default from strategies/Flawless-Victory-Quantitative-Trading-Strategy-Based-on-Double-BB-Indicators-and-RSI.md- npx agenkit install engineering-kit in your project
- Paste the command into your agent and approve each phase
- Get tests, backtest, risk controls and a paper-trading switch
Understand it first
Before you run this, read the lesson behind the idea and how to backtest it honestly. Specs like this one are the survivors of an unknown number of trials; deflate their results accordingly.
Related specs
- Configurable BBRSIAroon Strategy BacktestPine Script · Machine learning · 5m
- EMA and RSI Quantitative Trading StrategyPine Script · Machine learning · 1h
- High Frequency Hybrid Technical Analysis Quantitative StrategyPine Script · Machine learning · 15m
- Triple Moving Average Combined with MACD Quantitative StrategyPine Script · Machine learning · 1d
- London MACD RSI Bitcoin Trading StrategyPine Script · Machine learning · 1m
- Multi indicator Assisted StrategyPine Script · Machine learning · 1d