Strategy vault / Mean reversion
Four Indicator Momentum Reversal Strategy
This strategy utilizes three mainstream technical indicators: the moving average EMA, the relative strength index RSI and the commodity channel index CCI to identify price momentum through EMA crossovers and further…
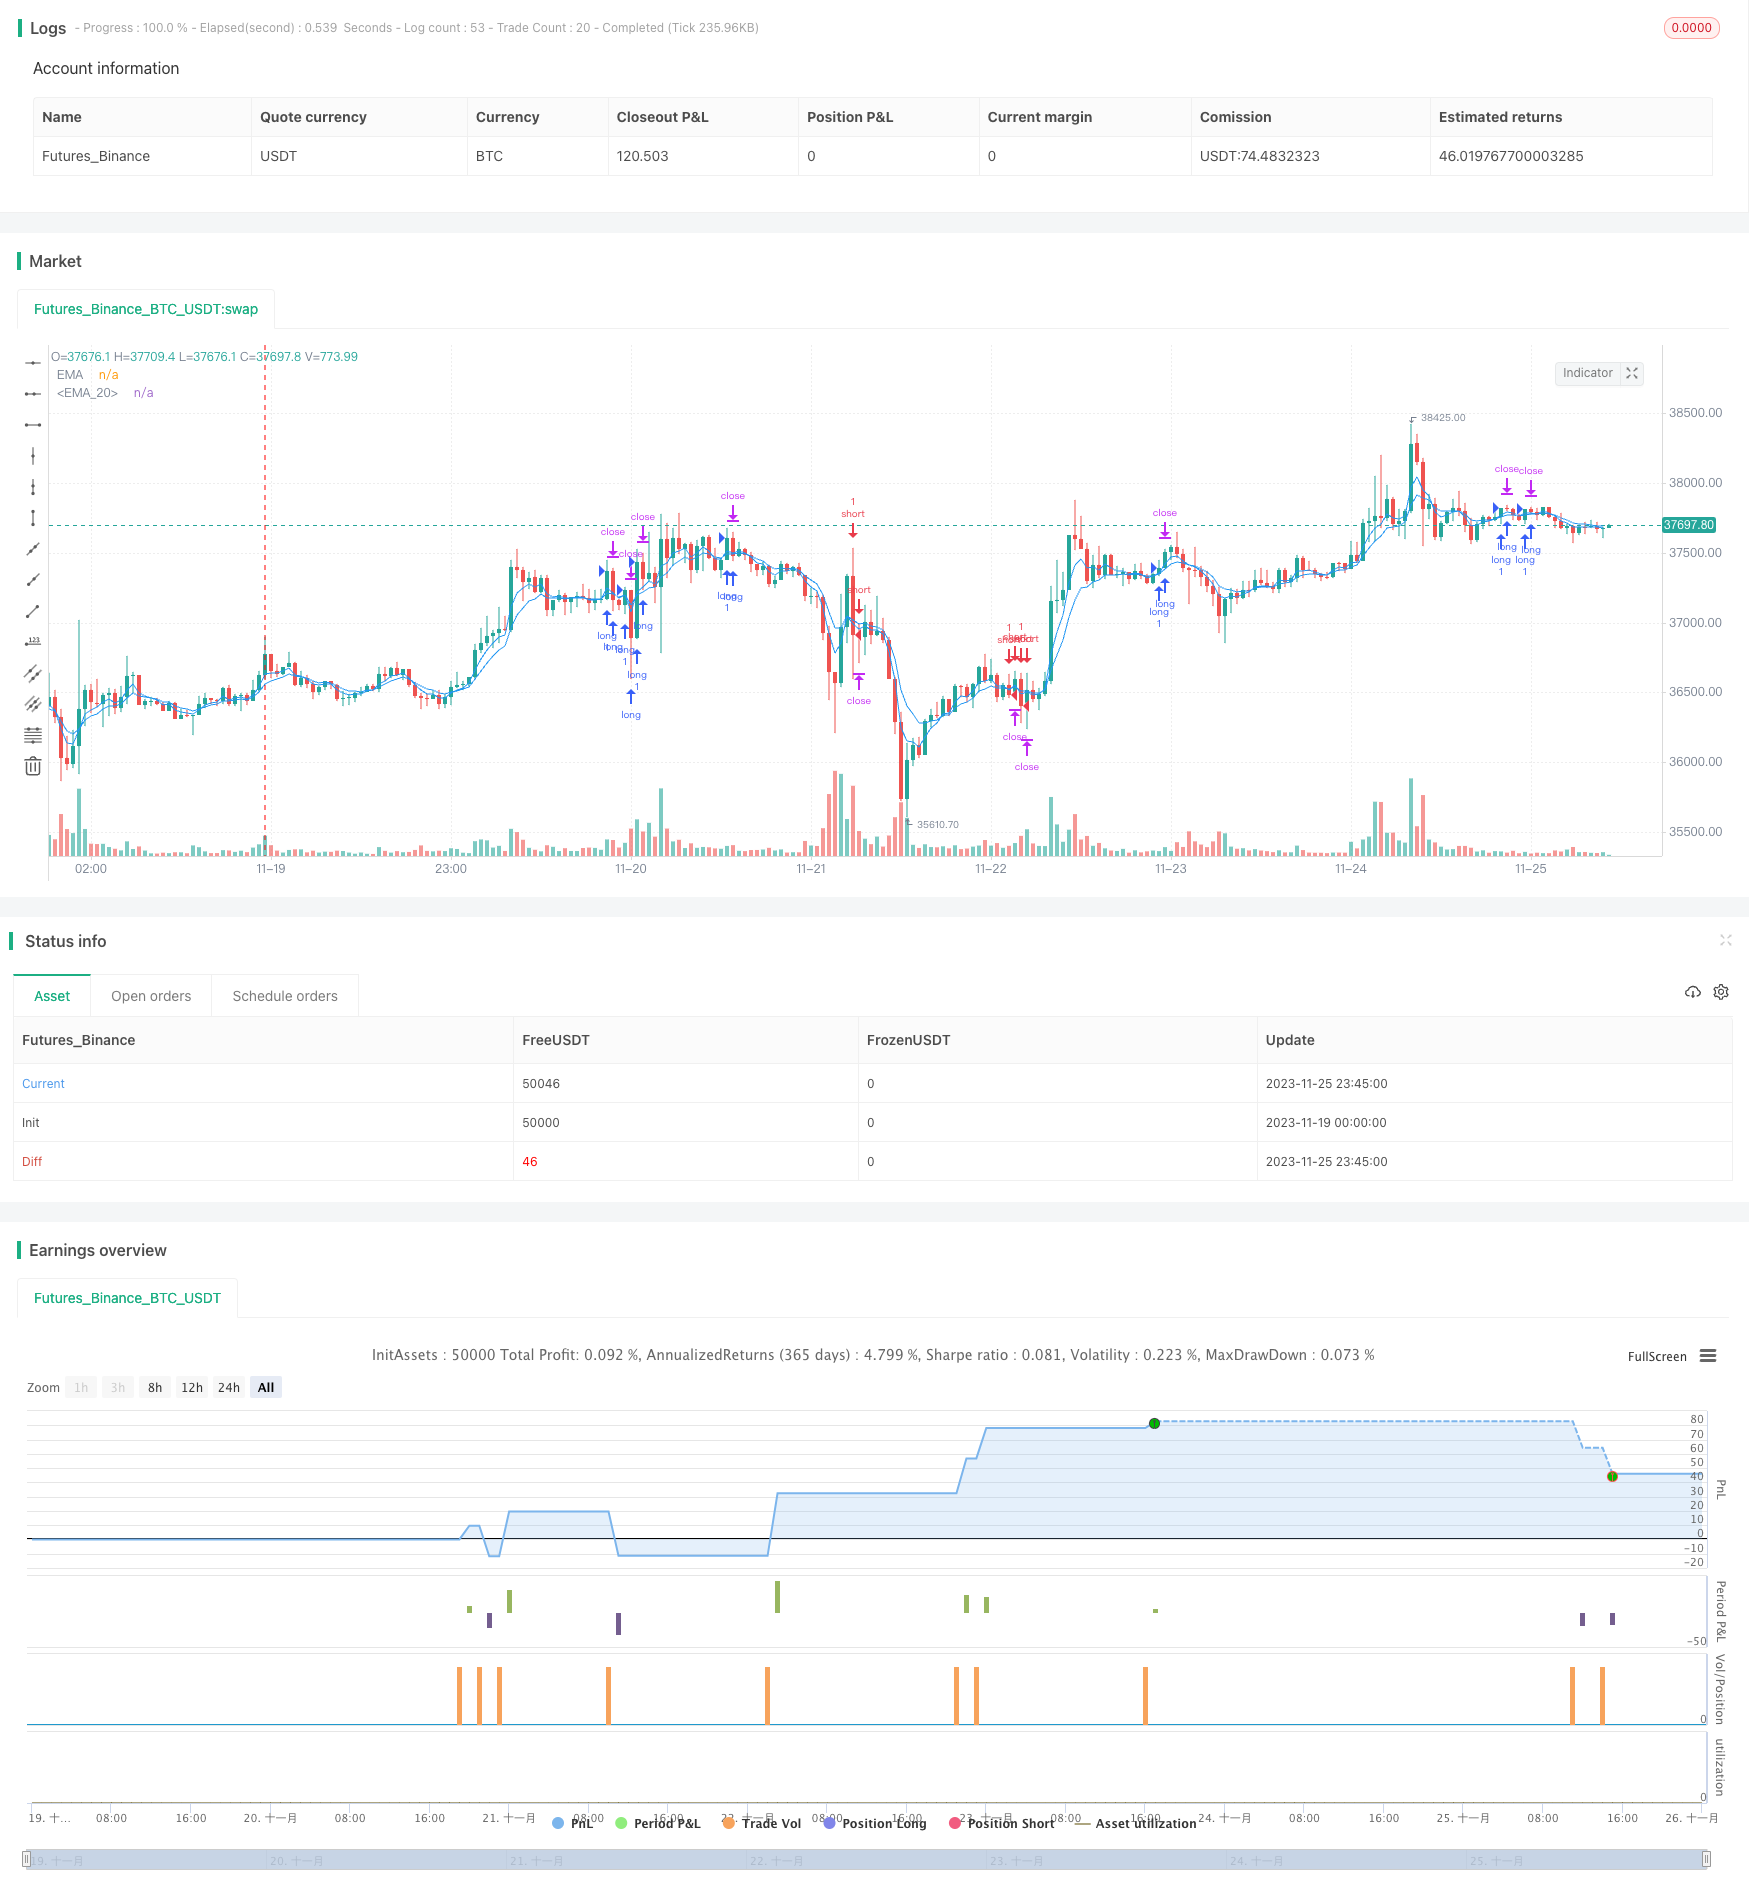
Overview
This strategy utilizes three mainstream technical indicators: the moving average EMA, the relative strength index RSI and the commodity channel index CCI to identify price momentum through EMA crossovers and further entries confirmed by oversold/overbought readings from RSI and CCI. This intermediate-term trading strategy aims to capture momentum reversals.
Strategy Logic
Use crossovers between 4-period and 8-period EMA to determine price momentum – the faster 4-period EMA to swiftly react and the slower 8-period EMA to confirm;
When EMAs turn upward, i.e. the 4-period EMA crossing above the 8-period EMA, check that RSI (over 65) and CCI (above 0) are not overbought to give a long signal;
When EMAs turn downward, i.e. the 4-period EMA crossing below the 8-period EMA, check that RSI (below 35) and CCI (below 0) are oversold to give a short signal;
Set stop loss and take profit prices based on input distances once trade signals are triggered.
In summary, this strategy considers medium-term trend and short-term overbought/oversold levels to form relatively stable signals, while stop losses and take profits effectively limit loss per trade.
Advantage Analysis
Multiple indicators mitigate false signals from individual oscillators;
EMAs determine the main trend while RSI and CCI avoid overheated areas to improve win rate;
Automatic stop loss and take profit setup constrains loss in extreme moves;
Purely technical nature makes this strategy easily implementable across any timeframe.
Risk Analysis
Major fundamental news can override technical levels;
Stop loss may be taken out by huge volatility calls for wider stops;
Frequent trading drives higher transaction costs thus best left for high frequency algorithms.
Enhancement Opportunities
Incorporate machine learning models to auto-adjust parameters based on fundamentals;
Build adaptive stops reacting to volatility rather than fixed distances.
Conclusion
This multifaceted strategy can deliver consistent medium-term profits under optimized parameters, making it an accessible technical system. Still, allowance needs to be given to black swan events via expanded stops etc, presenting areas for ongoing refinements.
Parameters
| Name | Default | What it controls |
|---|---|---|
| v_input_1 | 4 | Length_MA4 |
| v_input_2_close | 0 | Source: close | high | low | open | hl2 | hlc3 | hlcc4 | ohlc4 |
| v_input_3 | false | Offset |
| v_input_4 | 8 | Length_MA8 |
| v_input_5_close | 0 | Source: close | high | low | open | hl2 | hlc3 | hlcc4 | ohlc4 |
| v_input_6 | false | Offset |
| v_input_7 | 14 | Length |
| v_input_8 | 6 | CCI Turbo Length |
| v_input_9 | 14 | CCI 14 Length |
| v_input_10 | 12 | a |
| v_input_11 | 15 | b |
| v_input_12 | 120 | tp |
| v_input_13 | 96 | sl |
Source Pine Script
/*backtest
start: 2023-11-19 00:00:00
end: 2023-11-26 00:00:00
period: 45m
basePeriod: 5m
exchanges: [{"eid":"Futures_Binance","currency":"BTC_USDT"}]
*/

// This source code is subject to the terms of the Mozilla Public License 2.0 at https://mozilla.org/MPL/2.0/
// © SoftKill21

//@version=4


strategy(title="Moving Average Exponential", shorttitle="EMA", overlay=true)


len4 = input(4, minval=1, title="Length_MA4")
src4 = input(close, title="Source")
offset4 = input(title="Offset", type=input.integer, defval=0, minval=-500, maxval=500)
out4 = ema(src4, len4)
plot(out4, title="EMA", color=color.blue, offset=offset4)

len8 = input(8, minval=1, title="Length_MA8")
src8 = input(close, title="Source")
offset8 = input(title="Offset", type=input.integer, defval=0, minval=-500, maxval=500)
out8 = ema(src8, len8)
plot(out8, title="EMA", color=color.blue, offset=offset8)


//rsioma
src = close, len = input(14, minval=1, title="Length")
up = rma(max(change(ema(src, len)), 0), len)
down = rma(-min(change(ema(src, len)), 0), len)
rsi = down == 0 ? 100 : up == 0 ? 0 : 100 - (100 / (1 + up / down))
//plot(rsi, color=color.blue)
//band1 = hline(80)
//band0 = hline(20)
//fill(band1, band0, color=color.purple, transp=90)
//hline(50, color=color.gray, linestyle=plot.style_line)
sig = ema(rsi, 21)
//plot(sig, color=color.purple)

//woodie
cciTurboLength = input(title="CCI Turbo Length", type=input.integer, defval=6, minval=3, maxval=14)
cci14Length = input(title="CCI 14 Length", type=input.integer, defval=14, minval=7, maxval=20)

source = close

cciTurbo = cci(source, cciTurboLength)
cci14 = cci(source, cci14Length)

last5IsDown = cci14[5] < 0 and cci14[4] < 0 and cci14[3] < 0 and cci14[2] < 0 and cci14[1] < 0
last5IsUp = cci14[5] > 0 and cci14[4] > 0 and cci14[3] > 0 and cci14[2] > 0 and cci14[1] > 0
histogramColor = last5IsUp ? color.green : last5IsDown ? color.red : cci14 < 0 ? color.green : color.red


// Exit Condition
// Exit Condition
a = input(12)*10
b = input(15)*10
c = a*syminfo.mintick
d = b*syminfo.mintick


longCondition = crossover(out4, out8) and (rsi >= 65 and cci14>=0)
shortCondition = crossunder(out4, out8) and (rsi <=35 and cci14<=0)


long_stop_level     = float(na)
long_profit_level1  = float(na)
long_profit_level2  = float(na)
long_even_level     = float(na)

short_stop_level    = float(na)
short_profit_level1 = float(na)
short_profit_level2 = float(na)
short_even_level    = float(na)

long_stop_level     := longCondition  ? close - c : long_stop_level     [1]
long_profit_level1  := longCondition  ? close + d : long_profit_level1  [1]
//long_profit_level2  := longCondition  ? close + d : long_profit_level2  [1]
//long_even_level     := longCondition  ? close + 0 : long_even_level     [1]

short_stop_level    := shortCondition ? close + c : short_stop_level    [1]
short_profit_level1 := shortCondition ? close - d : short_profit_level1 [1]
//short_profit_level2 := shortCondition ? close - d : short_profit_level2 [1]
//short_even_level    := shortCondition ? close + 0 : short_even_level    [1]


//ha
// === Input ===
//ma1_len = input(1, title="MA 01")
//ma2_len = input(40, title="MA 02")

// === MA 01 Filter ===
//o=ema(open,ma1_len)
//cc=ema(close,ma1_len)
//h=ema(high,ma1_len)
//l=ema(low,ma1_len)

// === HA calculator ===
//ha_t = heikinashi(syminfo.tickerid)
//ha_o = security(ha_t, timeframe.period, o)
//ha_c = security(ha_t, timeframe.period, cc)
//ha_h = security(ha_t, timeframe.period, h)
//ha_l = security(ha_t, timeframe.period, l)

// === MA 02 Filter ===
//o2=ema(ha_o, ma2_len)
//c2=ema(ha_c, ma2_len)
//h2=ema(ha_h, ma2_len)
//l2=ema(ha_l, ma2_len)

// === Color def ===
//ha_col=o2>c2 ? color.red : color.lime

// ===  PLOTITING===
//plotcandle(o2, h2, l2, c2, title="HA Smoothed", color=ha_col)

tp=input(120)
sl=input(96)

strategy.entry("long", strategy.long, when = longCondition)
//strategy.close("long", when = o2>c2 , comment="ha_long")
strategy.entry("short", strategy.short , when =shortCondition )
//strategy.close("short", when = o2<=c2 , comment = "ha_short" )

//strategy.close("long",when=long_profit_level1 or long_stop_level  , comment="tp/sl")
//strategy.close("short",when=short_profit_level1 or short_stop_level , comment="tp/sl")

strategy.exit("x_long","long",profit = tp, loss = sl) //when = o2>c2)
strategy.exit("x_short","short",profit = tp, loss = sl) //when = o2<c2)
Published by ChaoZhang on the FMZ strategy square · last modified 2023-11-27. Collected in the Quant Trading Vault. Unvalidated research: re-test with your own data and costs before trusting it.
Build this with AgenKit
A spec is not a trading system. Paste this into your coding agent and AgenKit runs a specialist team — architecture, test-first build, risk gates, review — with paper trading on by default.
/agenkit build a production-grade trading bot with a backtest engine, risk controls and paper trading by default from strategies/Four-Indicator-Momentum-Reversal-Strategy.md- npx agenkit install engineering-kit in your project
- Paste the command into your agent and approve each phase
- Get tests, backtest, risk controls and a paper-trading switch
Understand it first
Before you run this, read the lesson behind the idea and how to backtest it honestly. Specs like this one are the survivors of an unknown number of trials; deflate their results accordingly.
Related specs
- ATR and EMA based Dynamic Take Profit and Stop Loss Adaptive StrategyPine Script · Mean reversion · 1h
- Market Cypher Wave B Automated Trading StrategyPine Script · Mean reversion · 1h
- Multi Indicator Trend Reversal Trading StrategyPine Script · Mean reversion · 1h
- MACD RSI and EMA StrategyPine Script · Mean reversion · 1d
- RSI amp CCI Combination Quantitative Trading StrategyPine Script · Mean reversion · 1h
- Rainbow OscillatorPine Script · Mean reversion · 1h