FTL Range Filter X2 EMA UO
Thjs script combines two range filters, an EMA and the Ultimate oscillator . This is an indicator type of script with alerts that is ideal for one minute scalping and was developed initially for NAS100 but has been…
Thjs script combines two range filters, an EMA and the Ultimate oscillator . This is an indicator type of script with alerts that is ideal for one minute scalping and was developed initially for NAS100 but has been used successfully with other symbols. The two range filters are used to detect when the short and mid term trends are in the same direction. The EMA indicates the longer term trend and the UO is used to determine if an asset is overbought or oversold. This indicator pairs well with divergence indicators to add confluence to a change in direction.
Additional features of this indicator:
- Configure whether to show buy and sell labels only when asset is not overbought or oversold
- Select whether to show buys only when price is above the EMA , or sells only below the EMA
- Indicate a bar where a trend crosses the EMA and select if the crossover or cross under should be shown only in a counter trend.
- Pullbacks within a trend can be identified. This may indicate trend continuation.
- Alerts can be created for pullbacks, EMA crossing and for buy or sell signals
backtest
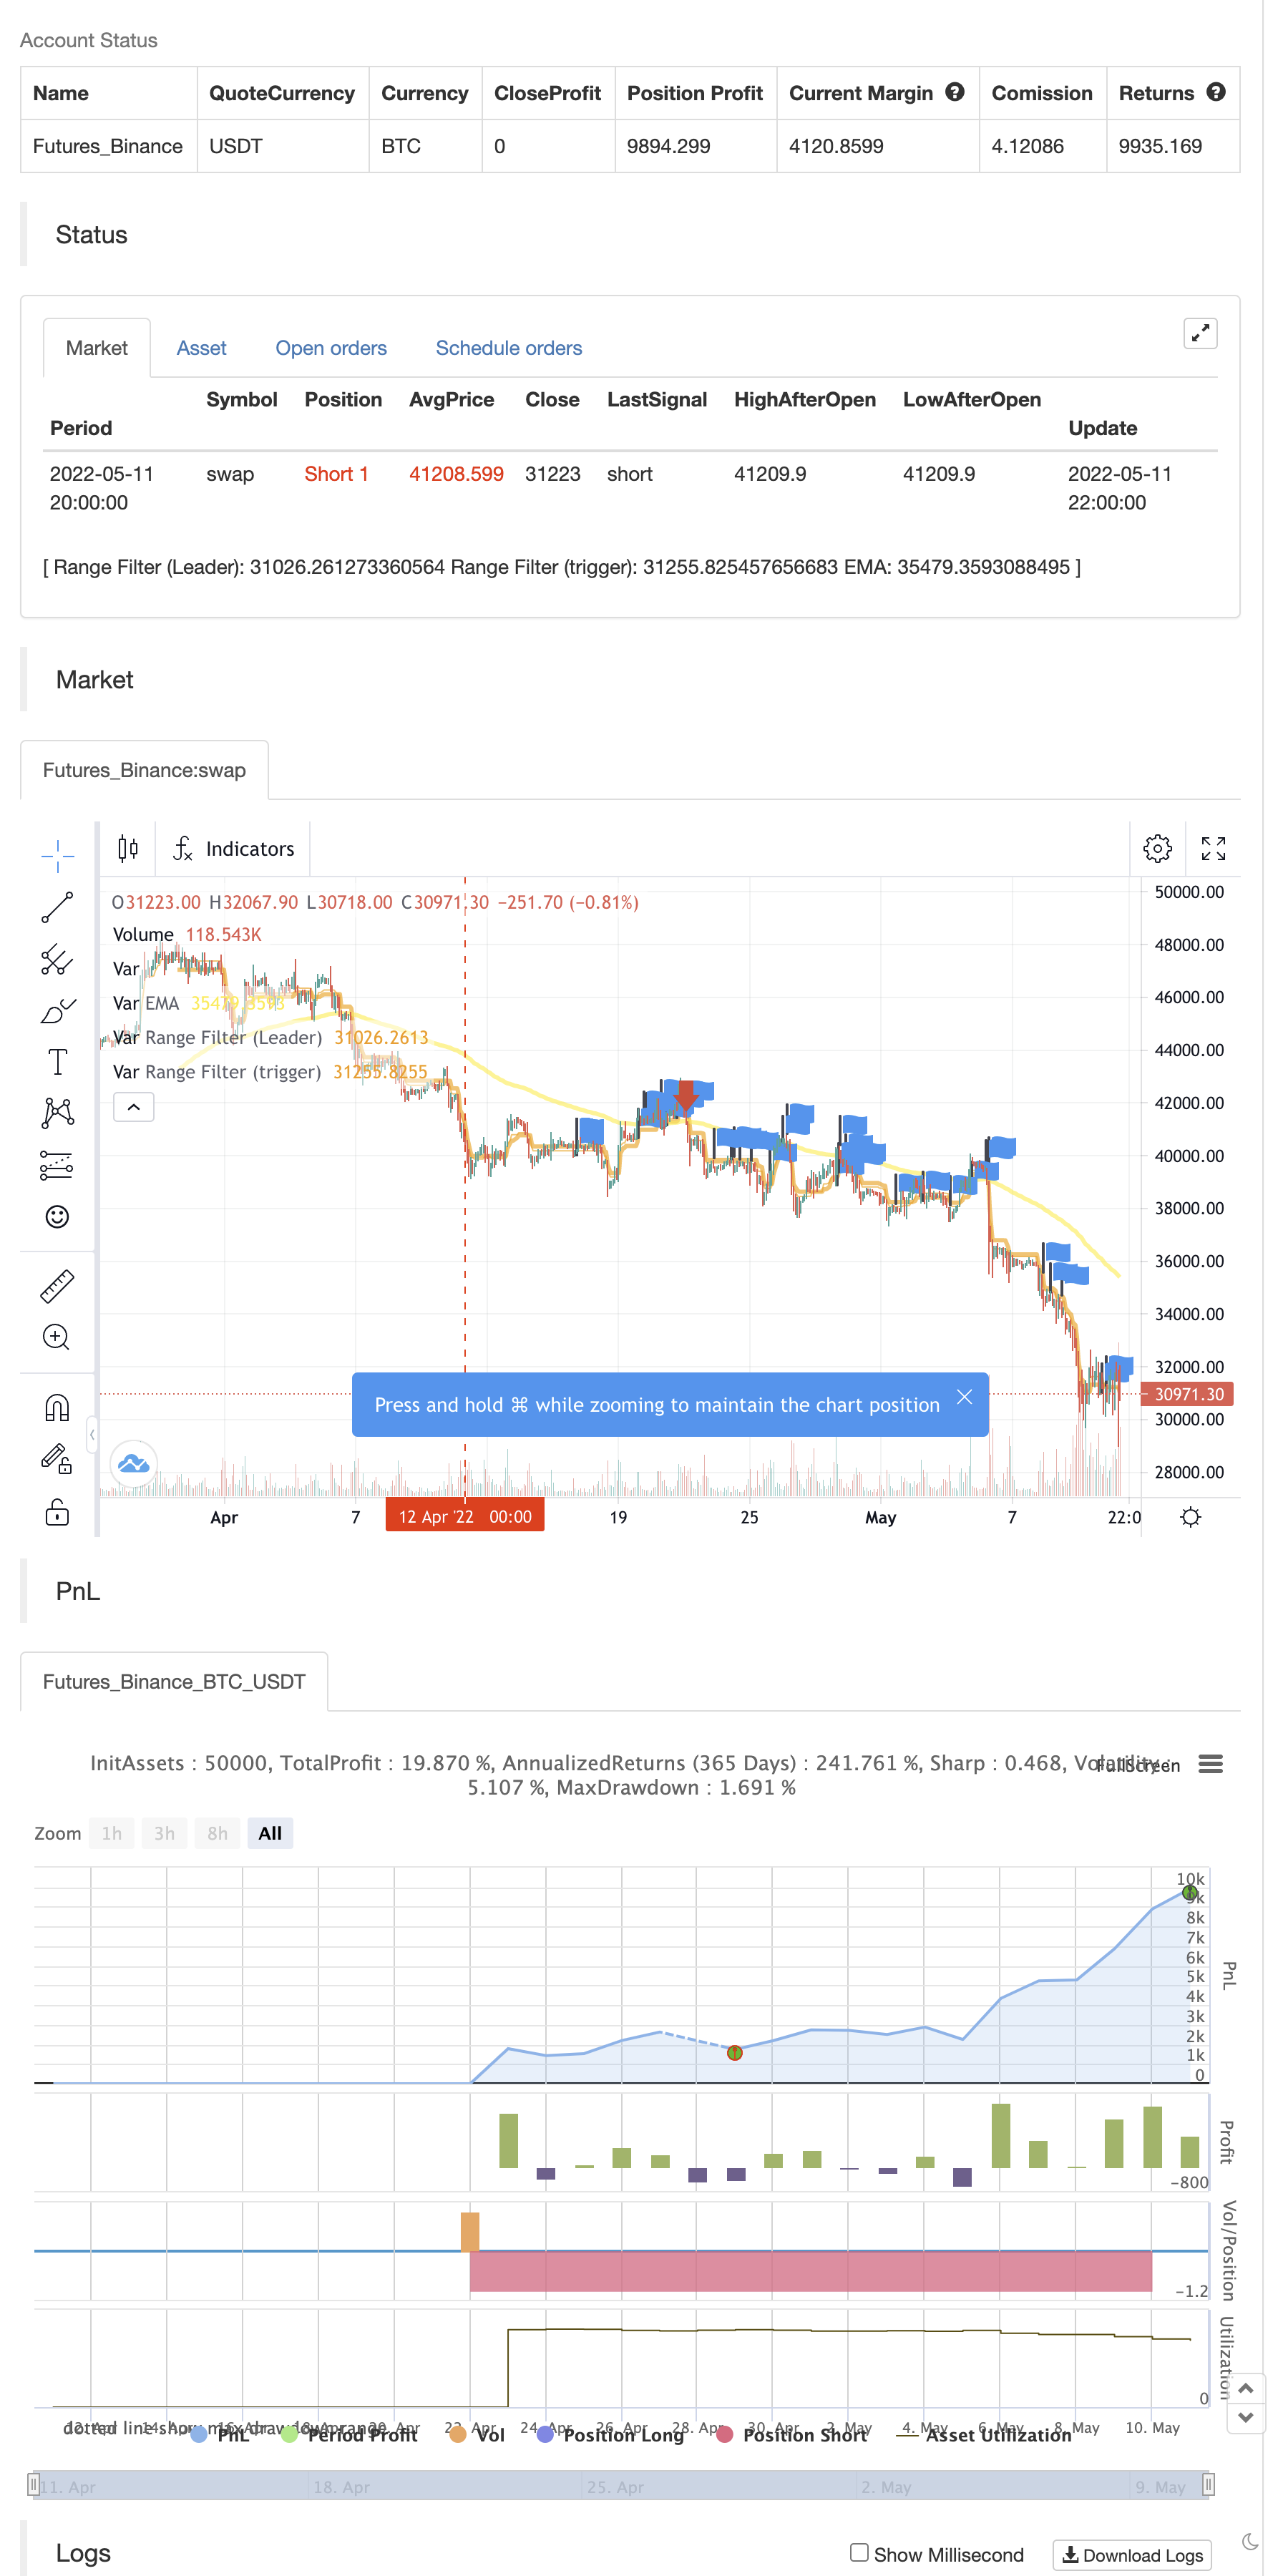
Parameters
| Name | Default | What it controls |
|---|---|---|
| v_input_3_close | 0 | Source: close | high | low | open | hl2 | hlc3 | hlcc4 | ohlc4 |
| v_input_1_hl2 | 0 | (?Leading Range Filter)Source: hl2 | high | low | open | close | hlc3 | hlcc4 | ohlc4 |
| v_input_int_1 | 30 | Sampling Period |
| v_input_float_1 | 2.6 | Range Multiplier |
| v_input_2_ohlc4 | 0 | (?Trigger Range Filter)Source: ohlc4 | high | low | open | hl2 | hlc3 | hlcc4 | close |
| v_input_int_2 | 48 | Sampling Period |
| v_input_float_2 | 3.4 | Range Multiplier |
| v_input_int_3 | 144 | (?EMA)Length |
| v_input_bool_1 | false | Show crossover only in uptrend |
| v_input_bool_2 | false | Show crossunder only in downtrend |
| v_input_int_4 | 7 | (?Ultimate Oscillator UO)Fast Length |
| v_input_int_5 | 14 | Middle Length |
| v_input_int_6 | 28 | Slow Length |
| v_input_float_3 | 60 | (?Buy Options)UO Overbought value |
| v_input_bool_3 | true | Show BUY only when not overbought (UO) |
| v_input_bool_4 | true | Show BUY only above the EMA |
| v_input_float_4 | 40 | (?Sell Options)UO Oversold value |
| v_input_bool_5 | true | Show SELL only when not oversold (UO) |
| v_input_bool_6 | true | Show SELL only below the EMA |
Source Pine Script
/*backtest
start: 2022-04-12 00:00:00
end: 2022-05-11 23:59:00
period: 2h
basePeriod: 15m
exchanges: [{"eid":"Futures_Binance","currency":"BTC_USDT"}]
*/

//@version=5


// Original Script > @DonovanWall

// Previous Version > @guikroth
// Ultimate Oscillator > @PineCoders

// Updated by > @jwelmac


//////////////////////////////////////////////////////////////////////////
// Range Filter x 2, EMA and UO
//////////////////////////////////////////////////////////////////////////


indicator(title='FTL - Range Filter X2 + EMA + UO', overlay=true)

// Groups

string groupLeadingRange = "Leading Range Filter"
string groupTriggerRange = "Trigger Range Filter"
string groupEMA = "EMA"
string groupUO = "Ultimate Oscillator (UO)"
string GROUP_BUY_OPTIONS = "Buy Options"
string GROUP_SELL_OPTIONS = "Sell Options"


//-------  *********  --------  *********  ---------
// Range Filter (Leader) {

// Source
src = input(defval=hl2, title='Source', group=groupLeadingRange)

// Sampling Period
per = input.int(defval=30, minval=1, title='Sampling Period', group=groupLeadingRange)

// Range Multiplier
mult = input.float(defval=2.6, minval=0.1, title='Range Multiplier', group=groupLeadingRange)

// Smooth Average Range {
smoothrng(x, t, m) =>
    wper = t * 2 - 1
    avrng = ta.ema(math.abs(x - x[1]), t)
    _smoothrng = ta.ema(avrng, wper) * m
    _smoothrng
// }
smrng = smoothrng(src, per, mult)

// Range Filter{
rngfilter(x, r) =>
    rngfilt = x
    rngfilt := x > nz(rngfilt[1]) ? x - r < nz(rngfilt[1]) ? nz(rngfilt[1]) : x - r : x + r > nz(rngfilt[1]) ? nz(rngfilt[1]) : x + r
    rngfilt
//}
filt = rngfilter(src, smrng)

// Filter Direction

upward = 0.0
upward := filt > filt[1] ? nz(upward[1]) + 1 : filt < filt[1] ? 0 : nz(upward[1])

downward = 0.0
downward := filt < filt[1] ? nz(downward[1]) + 1 : filt > filt[1] ? 0 : nz(downward[1])


// Colors

filtcolor = upward > 0 ? color.lime : downward > 0 ? color.red : color.orange

filtplot = plot(filt, color=filtcolor, linewidth=1, title='Range Filter (Leader)')

// }
//-------  *********  --------  *********  ---------

//-------  *********  --------  *********  ---------
// Range Filter (Trigger){
// Source
src2 = input(defval=ohlc4, title='Source', group=groupTriggerRange)

// Sampling Period
// Settings for 1min chart, US 100.

per2 = input.int(defval=48, minval=1, title='Sampling Period', group=groupTriggerRange)

// Range Multiplier

mult2 = input.float(defval=3.4, minval=0.1, title='Range Multiplier', group=groupTriggerRange)

// Smooth Average Range

smrng2 = smoothrng(src2, per2, mult2)

// Range Filter

rngfilt2(x, r) =>
    rngfilt = x
    rngfilt := x > nz(rngfilt[1]) ? x - r < nz(rngfilt[1]) ? nz(rngfilt[1]) : x - r : x + r > nz(rngfilt[1]) ? nz(rngfilt[1]) : x + r
    rngfilt
filt2 = rngfilt2(src2, smrng2)

// Filter Direction

upward2 = 0.0
upward2 := filt2 > filt2[1] ? nz(upward2[1]) + 1 : filt2 < filt2[1] ? 0 : nz(upward2[1])
downward2 = 0.0
downward2 := filt2 < filt2[1] ? nz(downward2[1]) + 1 : filt2 > filt2[1] ? 0 : nz(downward2[1])

// Colors

filtcolor2 = upward2 > 0 ? color.lime : downward2 > 0 ? color.red : color.orange

filtplot2 = plot(filt2, color=filtcolor2, linewidth=3, title='Range Filter (trigger)')

barcolor = src2 > filt2 and upward2 > 0
   ? color.green
   : src2 < filt2 and downward > 0
     ? color.red
     : color.rgb(120, 123, 134)
// Bar Color
//barcolor(barcolor)

// }
//-------  *********  --------  *********  ---------


//-------  *********  --------  *********  ---------
// Default EMA 144 {
len4 = input.int(144, minval=1, title='Length', group=groupEMA)
src4 = input(close, title='Source')
ema = ta.ema(src4, len4)
plot(ema, linewidth=3, color=color.new(color.yellow, 0), title='EMA')
closeAboveEma = close > ema
closeBelowEma = close < ema

uptrendCrossoverOnly = input.bool(false, title="Show crossover only in uptrend", group=groupEMA)
downtrendCrossunderOnly = input.bool(false, title="Show crossunder only in downtrend", group=groupEMA)
// END EMA
// }
//-------  *********  --------  *********  ---------


// ------ UO {
average(bp, tr_, length) => math.sum(bp, length) / math.sum(tr_, length)
uo() =>
    length1 = input.int(7, minval=1, title = "Fast Length", group=groupUO),
    length2 = input.int(14, minval=1, title = "Middle Length", group=groupUO),
    length3 = input.int(28, minval=1, title = "Slow Length", group=groupUO)
    high_ = math.max(high, close[1])
    low_ = math.min(low, close[1])
    bp = close - low_
    tr_ = high_ - low_
    avg7 = average(bp, tr_, length1)
    avg14 = average(bp, tr_, length2)
    avg28 = average(bp, tr_, length3)
    100 * (4*avg7 + 2*avg14 + avg28)/7
uoLevel = uo()
// }


// Break Outs
// Conditions {

longCond = bool(na)
shortCond = bool(na)
longCond := src > filt2 and src > src[1] and upward2 > 0 or src > filt2 and src < src[1] and upward2 > 0
shortCond := src < filt2 and src < src[1] and downward2 > 0 or src < filt2 and src > src[1] and downward2 > 0

CondIni = 0
CondIni := longCond ? 1 : shortCond ? -1 : CondIni[1]


// Long (Buy){
overBoughtLevel = input.float(defval=60, minval=50, title='UO Overbought value', group=GROUP_BUY_OPTIONS)
longWhenNotOverbought = input.bool(true, title = 'Show BUY only when not overbought (UO)', tooltip = 'Show BUY Signal only when not overbought according to UO', group=GROUP_BUY_OPTIONS)
longOnlyAboveEma = input.bool(true, title = 'Show BUY only above the EMA', tooltip = 'Show BUY Signal only when price closes above the EMA', group=GROUP_BUY_OPTIONS)

longCondition = longCond and CondIni[1] == -1
overBought = uoLevel > overBoughtLevel

if (longCondition and longWhenNotOverbought)
    longCondition := not overBought

if (longCondition and longOnlyAboveEma)
    longCondition := closeAboveEma
//}

// Short (Sell){
overSoldLevel = input.float(defval=40, maxval=50, title='UO Oversold value', group=GROUP_SELL_OPTIONS)
shortWhenNotOversold = input.bool(true, title = 'Show SELL only when not oversold (UO)', tooltip = 'Show SELL Signal only when not oversold according to UO', group=GROUP_SELL_OPTIONS)
shortOnlyBelowEma = input.bool(true, title = 'Show SELL only below the EMA', tooltip = 'Show SELL Signal only when price closes below the EMA', group=GROUP_SELL_OPTIONS)

shortCondition = shortCond and CondIni[1] == 1
overSold = uoLevel < overSoldLevel

if (shortCondition and shortWhenNotOversold)
    shortCondition := not overSold

if (shortCondition and shortOnlyBelowEma)
    shortCondition := closeBelowEma
//}

// }

// Trend directions {
trendUp = upward and upward2
trendDown = downward and downward2
// }

// MA Crossover{
arrowSize = size.small

emaCrossover = 'EMA Crossover'
didEmaCrossover = (not uptrendCrossoverOnly or trendUp) and ta.crossover(close, ema)
plotshape(
  didEmaCrossover,
  title = emaCrossover,
  style = shape.triangleup,
  size = arrowSize,
  location = location.belowbar,
  color = color.new(color.green, 0)
  )

emaCrossunder = 'EMA Crossunder'
didEmaCrossunder = (not downtrendCrossunderOnly or trendDown) and ta.crossunder(close, ema)
plotshape(
  didEmaCrossunder,
  title = emaCrossunder,
  style = shape.triangledown,
  size = arrowSize,
  location = location.abovebar,
  color = color.new(color.red, 0)
  )
// }

// Pullbacks (a possible indicator of trend continuation) {
// Conditions:
// - Both filters going in same direction
sameDirection = trendUp or trendDown

// Did the previous candle close in the opposite direction
prevOpp = (trendUp and close[1] < open[1]) or (trendDown and open[1] < close[1])

// Is the current candle in the trend direction
inTrendDirection = (trendDown and close < open) or (trendUp and close > open)

// - previous candle: crossover one or both in downtrend, crossunder one or both in uptrend
prevLimit = trendDown ? high[1] : low[1]
var previousCross = false

if (trendDown)
    previousCross := ta.crossover(prevLimit, filt[1]) or ta.crossover(prevLimit, filt2[1])
else
    previousCross := ta.crossunder(prevLimit, filt[1]) or ta.crossunder(prevLimit, filt2[1])

// - current candle: crossunder one or both in downtrend, crossover one or both in uptrend
currentReturn = trendDown
  ? close < filt
  : close > filt

pullback = prevOpp and inTrendDirection and sameDirection and previousCross and currentReturn

uptrendPullback = 'Uptrend Pullback'
isUptrendPullback = pullback and trendUp
plotshape(
  isUptrendPullback,
  title = uptrendPullback,
  style = shape.diamond,
  size = arrowSize,
  location = location.belowbar,
  color = color.new(color.green, 0)
  )

downtrendPullback = 'Downtrend Pullback'
isDowntrendPullback = pullback and trendDown
plotshape(
  isDowntrendPullback,
  title = 'Downtrend Pullback',
  style = shape.diamond,
  size = arrowSize,
  location = location.abovebar,
  color = color.new(color.red, 0)
  )

// }

// Buy/Sell Signal {
plotshape(longCondition, title='Buy Signal', text='BUY', textcolor=color.new(color.white, 0), style=shape.labelup, size=size.normal, location=location.belowbar, color=color.new(color.green, 0))
plotshape(shortCondition, title='Sell Signal', text='SELL', textcolor=color.new(color.white, 0), style=shape.labeldown, size=size.normal, location=location.abovebar, color=color.new(color.red, 0))
//}

//Alerts{

alertcondition(longCondition, title='Buy Alert', message='BUY')
alertcondition(shortCondition, title='Sell Alert', message='SELL')

alertcondition(didEmaCrossover, title = emaCrossover, message = emaCrossover)
alertcondition(didEmaCrossunder, title = emaCrossunder, message = emaCrossover)

alertcondition(isUptrendPullback, title=uptrendPullback, message = uptrendPullback)
alertcondition(isDowntrendPullback, title=downtrendPullback, message = downtrendPullback)
// }


// For use like Strategy, {

//1. Change the word  "indicator" for "strategy" at the top
//2.  Remove the "//" below

//strategy.entry( id = "Long", long = true, when = longCondition )
//strategy.close( id = "Long", when = shortCondition )
// }

if longCondition
    strategy.entry("Enter Long", strategy.long)
else if shortCondition
strategy.entry("Enter Short", strategy.short)Published by ChaoZhang on the FMZ strategy square · last modified 2022-05-13. Collected in the Quant Trading Vault. Unvalidated research: re-test with your own data and costs before trusting it.
Build this with AgenKit
A spec is not a trading system. Paste this into your coding agent and AgenKit runs a specialist team — architecture, test-first build, risk gates, review — with paper trading on by default.
/agenkit build a production-grade trading bot with a backtest engine, risk controls and paper trading by default from strategies/FTL-Range-Filter-X2-EMA-UO.md- npx agenkit install engineering-kit in your project
- Paste the command into your agent and approve each phase
- Get tests, backtest, risk controls and a paper-trading switch
Understand it first
Before you run this, read the lesson behind the idea and how to backtest it honestly. Specs like this one are the survivors of an unknown number of trials; deflate their results accordingly.
Related specs
- 20Bitcoin and Gold 5 Minute Scalping Strategy 20Pine Script · Scalping · 1h
- Scalping EMA ADX RSI with Buy SellPine Script · Scalping · 5m
- Session Breakout Scalping StrategyPine Script · Scalping · 1h
- Super ScalperPine Script · Scalping · 1m
- Advanced Multi Trend Confirmation EMA Supply Demand Zone Dynamic Scalping StrategyPine Script · Scalping · 1d
- Bollinger Awesome Alert R1Pine Script · Scalping · 1h