Fukuiz Octa EMA Ichimoku
This strategy is based EMA of 8 different period and Ichimoku Cloud which works better in 1hr 4hr and daily time frame. A brief introduction to Ichimoku The Ichimoku Cloud is a collection of technical indicators that…
This strategy is based EMA of 8 different period and Ichimoku Cloud which works better in 1hr 4hr and daily time frame.
#A brief introduction to Ichimoku # The Ichimoku Cloud is a collection of technical indicators that show support and resistance levels, as well as momentum and trend direction. It does this by taking multiple averages and plotting them on a chart. It also uses these figures to compute a "cloud" that attempts to forecast where the price may find support or resistance in the future.
#A brief introduction to EMA# An exponential moving average ( EMA ) is a type of moving average (MA) that places a greater weight and significance on the most recent data points. The exponential moving average is also referred to as the exponentially weighted moving average . An exponentially weighted moving average reacts more significantly to recent price changes than a simple moving average ( SMA ), which applies an equal weight to all observations in the period.
#How to use# The strategy will give entry points itself, you can monitor and take profit manually(recommended), or you can use the exit setup.
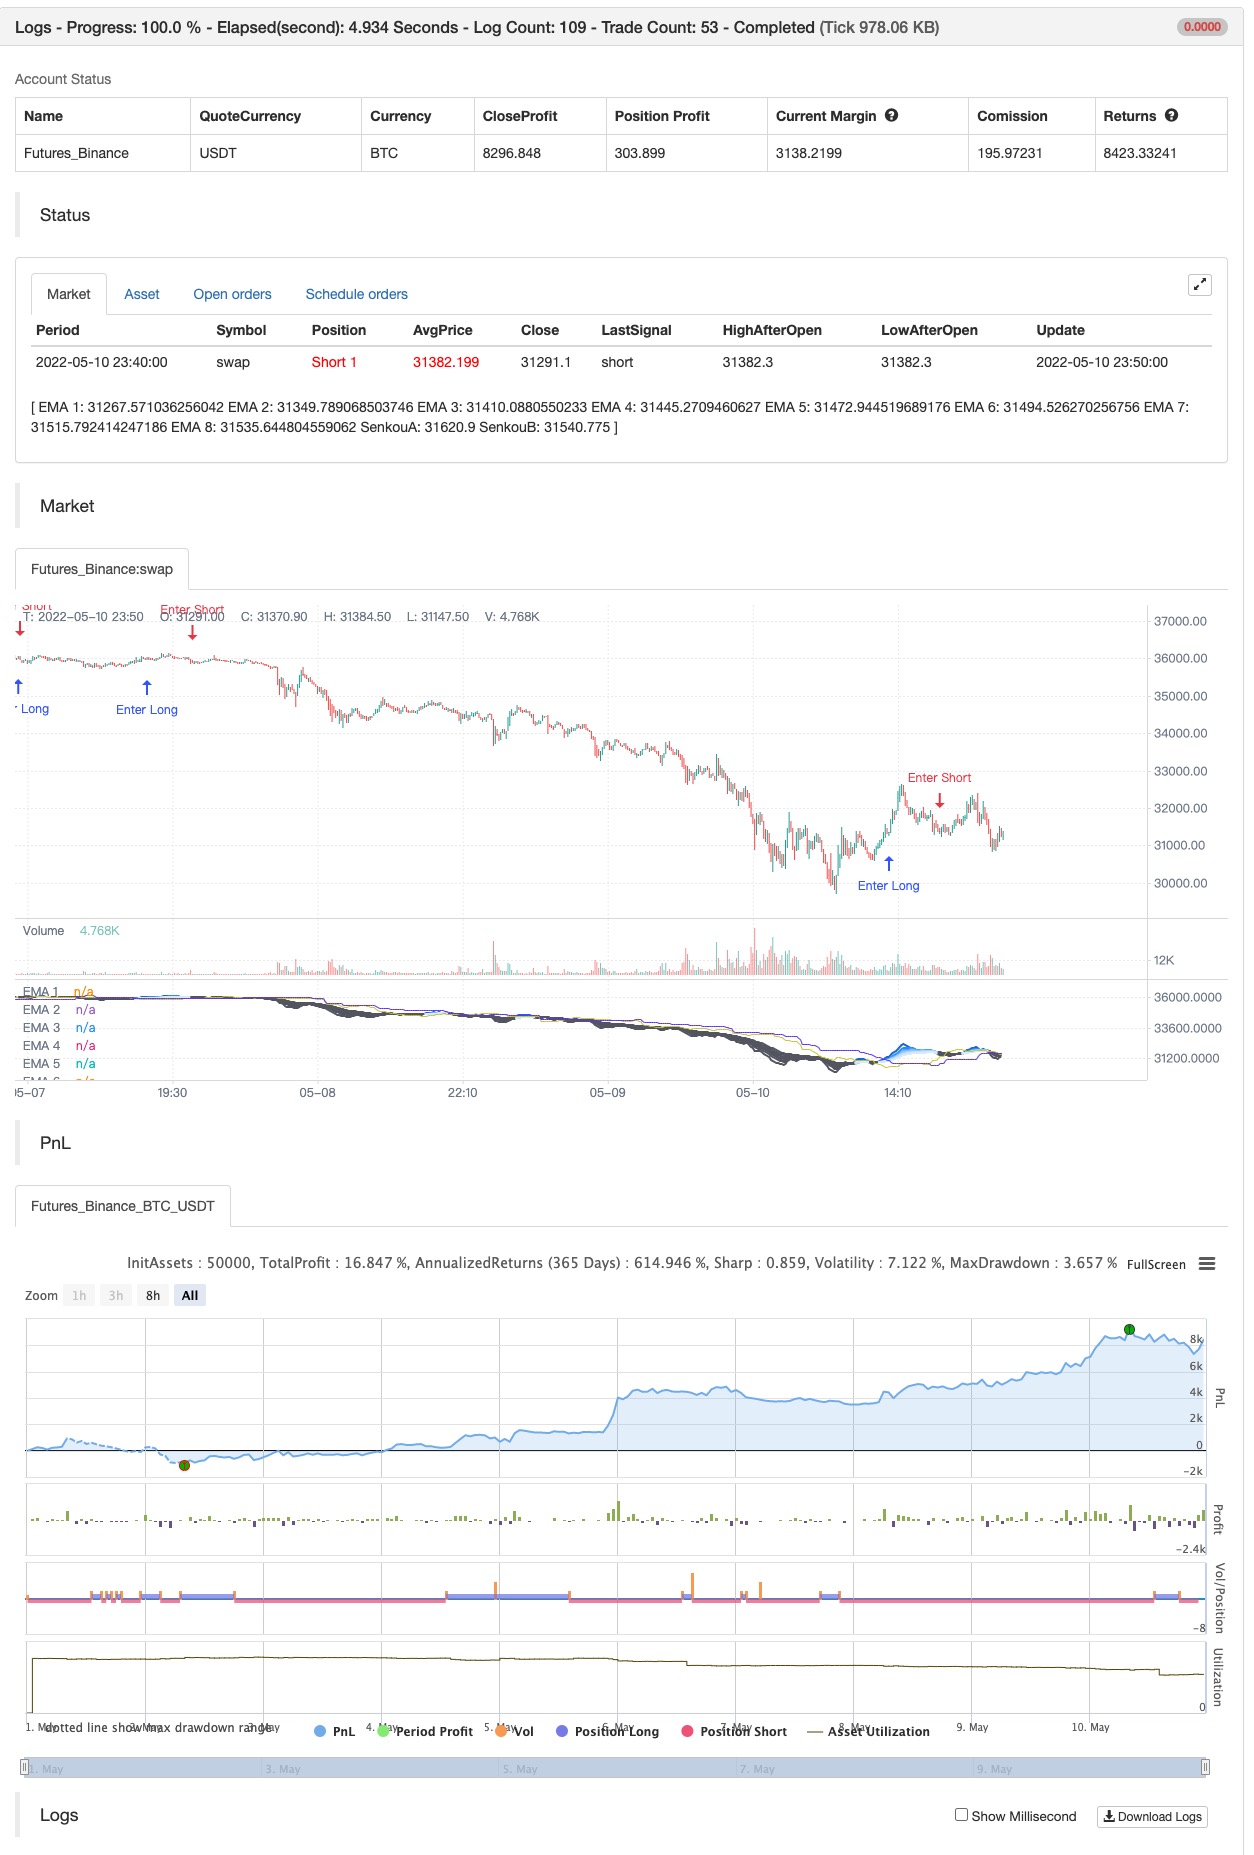
EMA (Color) = Bullish trend EMA (Gray) = Bearish trend
#Condition# Buy = All Ema (color) above the cloud. SELL= All Ema turn to gray color.
backtest
Parameters
| Name | Default | What it controls |
|---|---|---|
| v_input_1 | true | Show Ribbon (EMA) |
| v_input_2 | 5 | EMA 1 Length |
| v_input_3 | 11 | EMA 2 Length |
| v_input_4 | 15 | EMA 3 Length |
| v_input_5 | 18 | EMA 4 Length |
| v_input_6 | 21 | EMA 5 Length |
| v_input_7 | 24 | EMA 6 Length |
| v_input_8 | 28 | EMA 7 Length |
| v_input_9 | 34 | EMA 8 Length |
| v_input_10 | false | Chikou |
| v_input_11 | false | Tenkan |
| v_input_12 | false | Kijun |
| v_input_int_1 | 9 | conversionPeriods |
| v_input_int_2 | 26 | basePeriods |
| v_input_int_3 | 52 | laggingSpan2Periods |
| v_input_int_4 | 26 | displacement |
| v_input_int_5 | 2017 | Start Year |
| v_input_int_6 | true | Start Month |
| v_input_int_7 | true | Start Day |
| v_input_int_8 | 2023 | End Year |
| v_input_int_9 | 12 | End Month |
| v_input_int_10 | 31 | End Day |
Source Pine Script
/*backtest
start: 2022-05-01 00:00:00
end: 2022-05-10 23:59:00
period: 10m
basePeriod: 1m
exchanges: [{"eid":"Futures_Binance","currency":"BTC_USDT"}]
*/

//@version=5
//Fukuiz

//strategy(title='Fukuiz Octa-EMA + Ichimoku', shorttitle='Fuku octa strategy', overlay=true, process_orders_on_close=true,
//     default_qty_type= strategy.cash , default_qty_value=1000, currency=currency.USD, initial_capital=10000 ,commission_type = strategy.commission.percent,commission_value=0.25)


//OCTA EMA ##################################################


// Functions
f_emaRibbon(_src, _e1, _e2, _e3, _e4, _e5, _e6, _e7, _e8) =>
    _ema1 = ta.ema(_src, _e1)
    _ema2 = ta.ema(_src, _e2)
    _ema3 = ta.ema(_src, _e3)
    _ema4 = ta.ema(_src, _e4)
    _ema5 = ta.ema(_src, _e5)
    _ema6 = ta.ema(_src, _e6)
    _ema7 = ta.ema(_src, _e7)
    _ema8 = ta.ema(_src, _e8)
    [_ema1, _ema2, _ema3, _ema4, _ema5, _ema6, _ema7, _ema8]

showRibbon = input(true, 'Show Ribbon (EMA)')
ema1Len = input(5, title='EMA 1 Length')
ema2Len = input(11, title='EMA 2 Length')
ema3Len = input(15, title='EMA 3 Length')
ema4Len = input(18, title='EMA 4 Length')
ema5Len = input(21, title='EMA 5 Length')
ema6Len = input(24, title='EMA 6 Length')
ema7Len = input(28, title='EMA 7 Length')
ema8Len = input(34, title='EMA 8 Length')

[ema1, ema2, ema3, ema4, ema5, ema6, ema7, ema8] = f_emaRibbon(close, ema1Len, ema2Len, ema3Len, ema4Len, ema5Len, ema6Len, ema7Len, ema8Len)

//Plot

ribbonDir = ema8 < ema2
p1 = plot(ema1, color=showRibbon ? ribbonDir ? #1573d4 : color.new(#5d606b, 15) : na, linewidth=2, title='EMA 1')
p2 = plot(ema2, color=showRibbon ? ribbonDir ? #3096ff : color.new(#5d606b, 15) : na, linewidth=2, title='EMA 2')
plot(ema3, color=showRibbon ? ribbonDir ? #57abff : color.new(#5d606b, 15) : na, linewidth=2, title='EMA 3')
plot(ema4, color=showRibbon ? ribbonDir ? #85c2ff : color.new(#5d606b, 15) : na, linewidth=2, title='EMA 4')
plot(ema5, color=showRibbon ? ribbonDir ? #9bcdff : color.new(#5d606b, 30) : na, linewidth=2, title='EMA 5')
plot(ema6, color=showRibbon ? ribbonDir ? #b3d9ff : color.new(#5d606b, 30) : na, linewidth=2, title='EMA 6')
plot(ema7, color=showRibbon ? ribbonDir ? #c9e5ff : color.new(#5d606b, 30) : na, linewidth=2, title='EMA 7')
p8 = plot(ema8, color=showRibbon ? ribbonDir ? #dfecfb : color.new(#5d606b, 30) : na, linewidth=2, title='EMA 8')
fill(p1, p2, color.new(#1573d4, 85))
fill(p2, p8, color.new(#1573d4, 85))

//ichimoku##################################################

//color
colorblue = #3300CC
colorred = #993300
colorwhite = #FFFFFF
colorgreen = #CCCC33
colorpink = #CC6699
colorpurple = #6633FF

//switch
switch1 = input(false, title='Chikou')
switch2 = input(false, title='Tenkan')
switch3 = input(false, title='Kijun')

middleDonchian(Length) =>
    lower = ta.lowest(Length)
    upper = ta.highest(Length)
    math.avg(upper, lower)

//Functions
conversionPeriods = input.int(9, minval=1)
basePeriods = input.int(26, minval=1)
laggingSpan2Periods = input.int(52, minval=1)
displacement = input.int(26, minval=1)
Tenkan = middleDonchian(conversionPeriods)
Kijun = middleDonchian(basePeriods)
xChikou = close
SenkouA = middleDonchian(laggingSpan2Periods)
SenkouB = (Tenkan[basePeriods] + Kijun[basePeriods]) / 2

//Plot
A = plot(SenkouA[displacement], color=color.new(colorpurple, 0), title='SenkouA')
B = plot(SenkouB, color=color.new(colorgreen, 0), title='SenkouB')
plot(switch1 ? xChikou : na, color=color.new(colorpink, 0), title='Chikou', offset=-displacement)
plot(switch2 ? Tenkan : na, color=color.new(colorred, 0), title='Tenkan')
plot(switch3 ? Kijun : na, color=color.new(colorblue, 0), title='Kijun')
fill(A, B, color=color.new(colorgreen, 90), title='Ichimoku Cloud')

//Buy and Sell signals
fukuiz = math.avg(ema2, ema8)
white = ema2 > ema8
gray = ema2 < ema8
buycond = white and white[1] == 0
sellcond = gray and gray[1] == 0
bullish = ta.barssince(buycond) < ta.barssince(sellcond)
bearish = ta.barssince(sellcond) < ta.barssince(buycond)
buy = bearish[1] and buycond and fukuiz > SenkouA[displacement] and fukuiz > SenkouB
sell = bullish[1] and sellcond and fukuiz > SenkouA[displacement] and fukuiz > SenkouB
sell2=ema2 < ema8
buy2 = white and fukuiz > SenkouA[displacement] and fukuiz > SenkouB

//$$$$$$$$$$$$$$$$$$$$$$$$$$$$$$$$$$$$$$$$$$$$$$$$$$$$$$$$$$$$$$$$$$$$$$
//Back test

startYear = input.int(defval=2017, title='Start Year', minval=2000, maxval=3000)
startMonth = input.int(defval=1, title='Start Month', minval=1, maxval=12)
startDay = input.int(defval=1, title='Start Day', minval=1, maxval=31)
endYear = input.int(defval=2023, title='End Year', minval=2000 ,maxval=3000)
endMonth = input.int(defval=12, title='End Month', minval=1, maxval=12)
endDay = input.int(defval=31, title='End Day', minval=1, maxval=31)

start = timestamp(startYear, startMonth, startDay, 00, 00)
end = timestamp(endYear, endMonth, endDay, 23, 59)
period() => time >= start and time <= end ? true : false

if buy2
    strategy.entry("Enter Long", strategy.long)
else if sell2
    strategy.entry("Enter Short", strategy.short)
Published by ChaoZhang on the FMZ strategy square · last modified 2022-05-16. Collected in the Quant Trading Vault. Unvalidated research: re-test with your own data and costs before trusting it.
Build this with AgenKit
A spec is not a trading system. Paste this into your coding agent and AgenKit runs a specialist team — architecture, test-first build, risk gates, review — with paper trading on by default.
/agenkit build a production-grade trading bot with a backtest engine, risk controls and paper trading by default from strategies/Fukuiz-Octa-EMA-Ichimoku.md- npx agenkit install engineering-kit in your project
- Paste the command into your agent and approve each phase
- Get tests, backtest, risk controls and a paper-trading switch
Understand it first
Before you run this, read the lesson behind the idea and how to backtest it honestly. Specs like this one are the survivors of an unknown number of trials; deflate their results accordingly.
Related specs
- Momentum Price Trend Tracking StrategyPine Script · Momentum · 1m
- KST EMA Momentum Trend Following StrategyPine Script · Momentum · 1d
- Multi Timeframe Momentum Confluence Automated Trading StrategyPine Script · Momentum · 1h
- Multi factor Adaptive Momentum Tracking StrategyPine Script · Momentum · 3m
- Buy Sell Strategy Based on Volume Candlestick PatternsPine Script · Momentum · 1d
- Multi Indicator Trend Momentum Trading Strategy An Optimized Quantitative Trading System Based on Bollinger Bands Fibonacci and ATRPine Script · Momentum · 1h