Golden Ratio Breakout Long Strategy
The Golden Ratio Breakout Long Strategy is a swing trading strategy based on the golden ratio levels of the highest and lowest prices over the past 21 days. It features a backtesting mechanism, long-only setup, and…
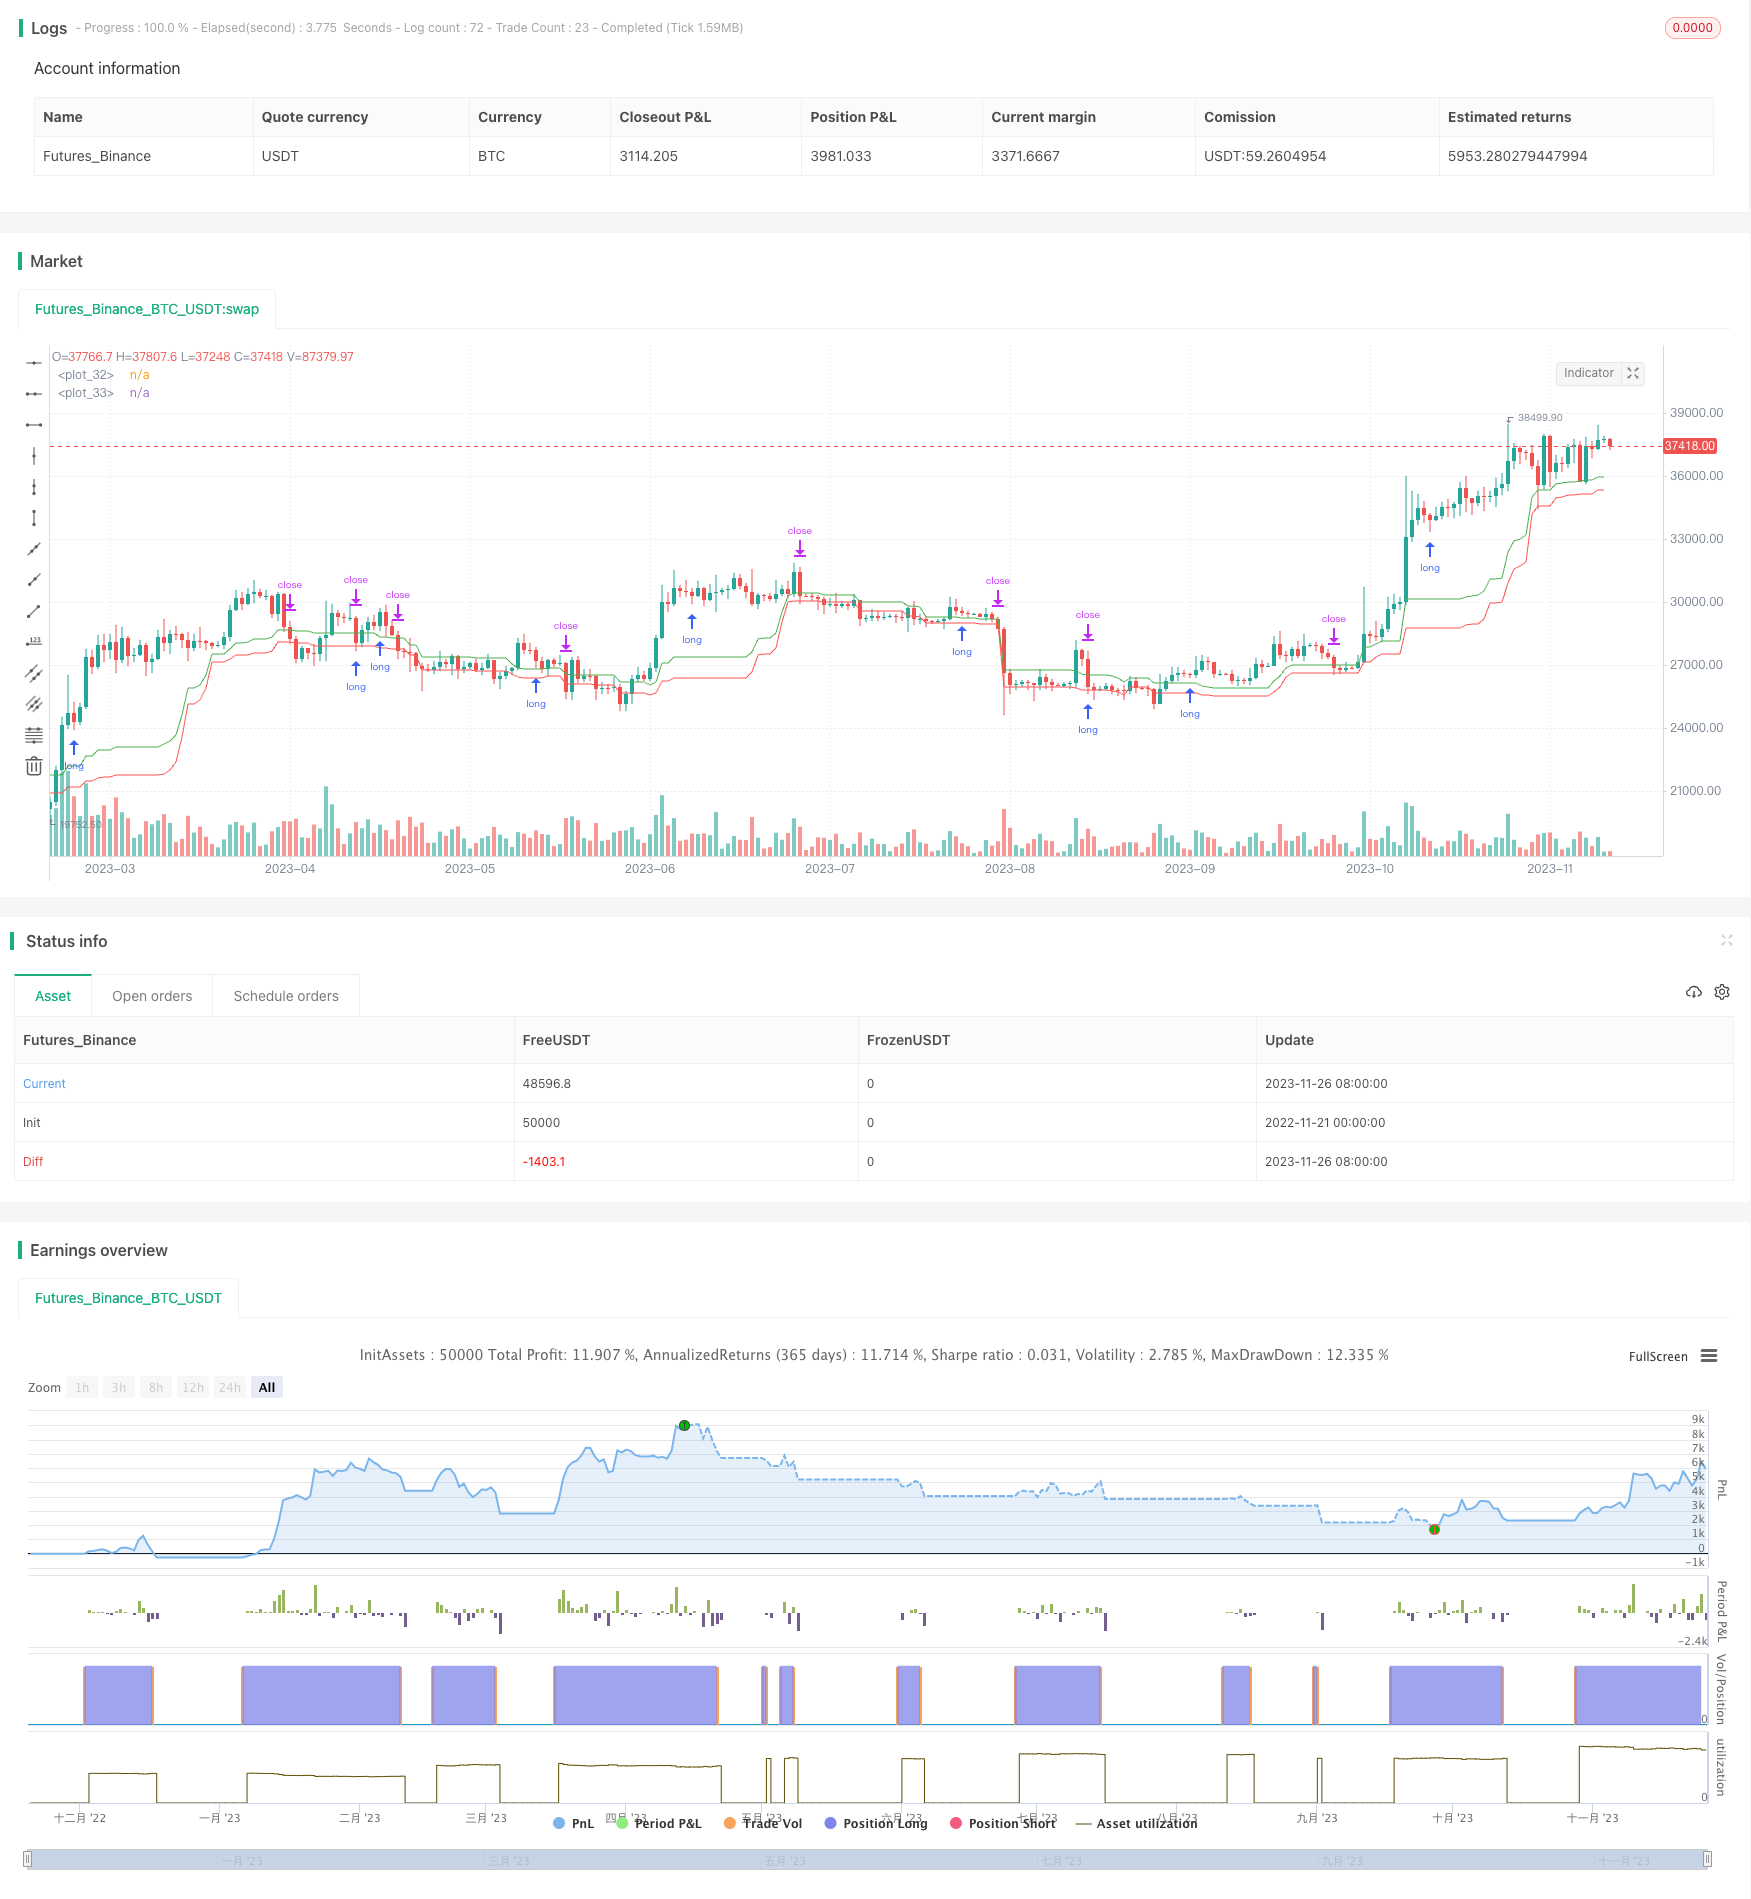
Overview
The Golden Ratio Breakout Long Strategy is a swing trading strategy based on the golden ratio levels of the highest and lowest prices over the past 21 days. It features a backtesting mechanism, long-only setup, and long-term holding period.
Strategy Logic
The strategy first calculates the 21-day highest price (high21) and the 21-day lowest price (low21), then computes the difference between them as diff. The trading signal triggers when the current low price breaks above low21 + 0.382 * diff while the previous bar's close is higher than the previous bar's open. The stop loss is set at low21 + 0.236 * diff. In other words, when the price breaks the 38.2% golden ratio line of the recent 21-day price range with upwards elasticity, a long position is initiated. The stop loss line is the 23.6% golden ratio line.
The golden ratio levels are used here as they generally correspond to common market support and resistance areas. 0.382 and 0.236 are watched as retracement and bounce levels, making the golden ratio one of the most intriguing numbers in nature.
Advantage Analysis
The advantages of this strategy are:
Guided by mature technical analysis methodology - golden ratio theory.
Long-only setup lowers system risk.
Trend tracking mechanism identifies accurate entry timing.
Clear stop loss controls risk.
Customizable backtest parameters suit different market environments.
Risk Analysis
There are also some risks:
Reliance on historical data causes insensitivity to market regime shifts.
The tight stop loss may get stopped out by overnight gaps.
False signals can happen if violent price swings occur under improper backtest periods.
Slippage impacts profitability.
These risks can be reduced by adjusting backtest periods, optimizing stop loss placement, considering slippage cost, etc.
Optimization Directions
The strategy can be upgraded in the following aspects:
Auto-optimize parameters with machine learning algorithms to better fit the current market.
Incorporate leverage products like index futures for position amplification.
Improve handling of extreme events like price gaps.
Optimize stop loss rules, e.g. set dynamic stops based on volatility.
Conclusion
In conclusion, this is a long-only strategy that provides clear entry and stop loss logic based on the golden ratio theory. It can be transformed into a robust quantitative trading strategy through parameter tuning, model optimization, portfolio combination, and other enhancement techniques.
Parameters
| Name | Default | What it controls |
|---|---|---|
| v_input_1 | 21 | High Days |
| v_input_2 | 21 | Low Days |
| v_input_3 | true | Start Date |
| v_input_4 | true | Start Month |
| v_input_5 | 2019 | Start Year |
Source Pine Script
/*backtest
start: 2022-11-21 00:00:00
end: 2023-11-27 00:00:00
period: 1d
basePeriod: 1h
exchanges: [{"eid":"Futures_Binance","currency":"BTC_USDT"}]
*/

// This source code is subject to the terms of the Mozilla Public License 2.0 at https://mozilla.org/MPL/2.0/
// © omkarkondhekar

//@version=4
strategy("GRBLong", overlay=true)

highInput = input(title = "High Days", type = input.integer, defval = 21, minval = 11)
lowInput = input(title = "Low Days", type = input.integer, defval = 21, minval = 5)

// Configure backtest start date with inputs
startDate = input(title="Start Date", type=input.integer,
     defval=1, minval=1, maxval=31)
startMonth = input(title="Start Month", type=input.integer,
     defval=1, minval=1, maxval=12)
startYear = input(title="Start Year", type=input.integer,
     defval=2019, minval=1800, maxval=2100)

// See if this bar's time happened on/after start date
afterStartDate = (time >= timestamp(syminfo.timezone,
     startYear, startMonth, startDate, 0, 0))

high21 = highest(high, highInput)
low21 = lowest(low, lowInput)

diff = high21 - low21

longEntrySignal = low > low21 + (diff * 0.382) and close[1] > open[1]

strategy.entry("Long", strategy.long, limit = low, when = longEntrySignal and afterStartDate)
strategy.exit("Long Exit", "Long", stop = low21 + (diff * 0.236))

plot(low21 + (diff * 0.382), color= color.green)
plot(low21 + (diff * 0.236), color = color.red)
Published by ChaoZhang on the FMZ strategy square · last modified 2023-11-28. Collected in the Quant Trading Vault. Unvalidated research: re-test with your own data and costs before trusting it.
Build this with AgenKit
A spec is not a trading system. Paste this into your coding agent and AgenKit runs a specialist team — architecture, test-first build, risk gates, review — with paper trading on by default.
/agenkit build a production-grade trading bot with a backtest engine, risk controls and paper trading by default from strategies/Golden-Ratio-Breakout-Long-Strategy.md- npx agenkit install engineering-kit in your project
- Paste the command into your agent and approve each phase
- Get tests, backtest, risk controls and a paper-trading switch
Understand it first
Before you run this, read the lesson behind the idea and how to backtest it honestly. Specs like this one are the survivors of an unknown number of trials; deflate their results accordingly.
Related specs
- Bollinger Bands Breakout Trading StrategyPine Script · Breakout · 1h
- Bollinger Bands Dynamic Breakout StrategyPine Script · Breakout · 1h
- Cross period Value Area Breakout StrategyPine Script · Breakout · 1d
- Donchian Channel Breakout Strategy 442842Pine Script · Breakout · 4h
- Dynamic Support Resistance Breakout Moving Average Crossover StrategyPine Script · Breakout · 1d
- Dynamic Support and Resistance Adaptive Pivot Trading StrategyPine Script · Breakout · 1d