Strategy vault / Mean reversion
Gradient MACD Quant Strategy
This strategy calculates Heikin-Ashi candlesticks to smooth price lines and combines MACD indicator to generate trading signals, implementing a quantitative strategy that tracks medium-to-long term trends.
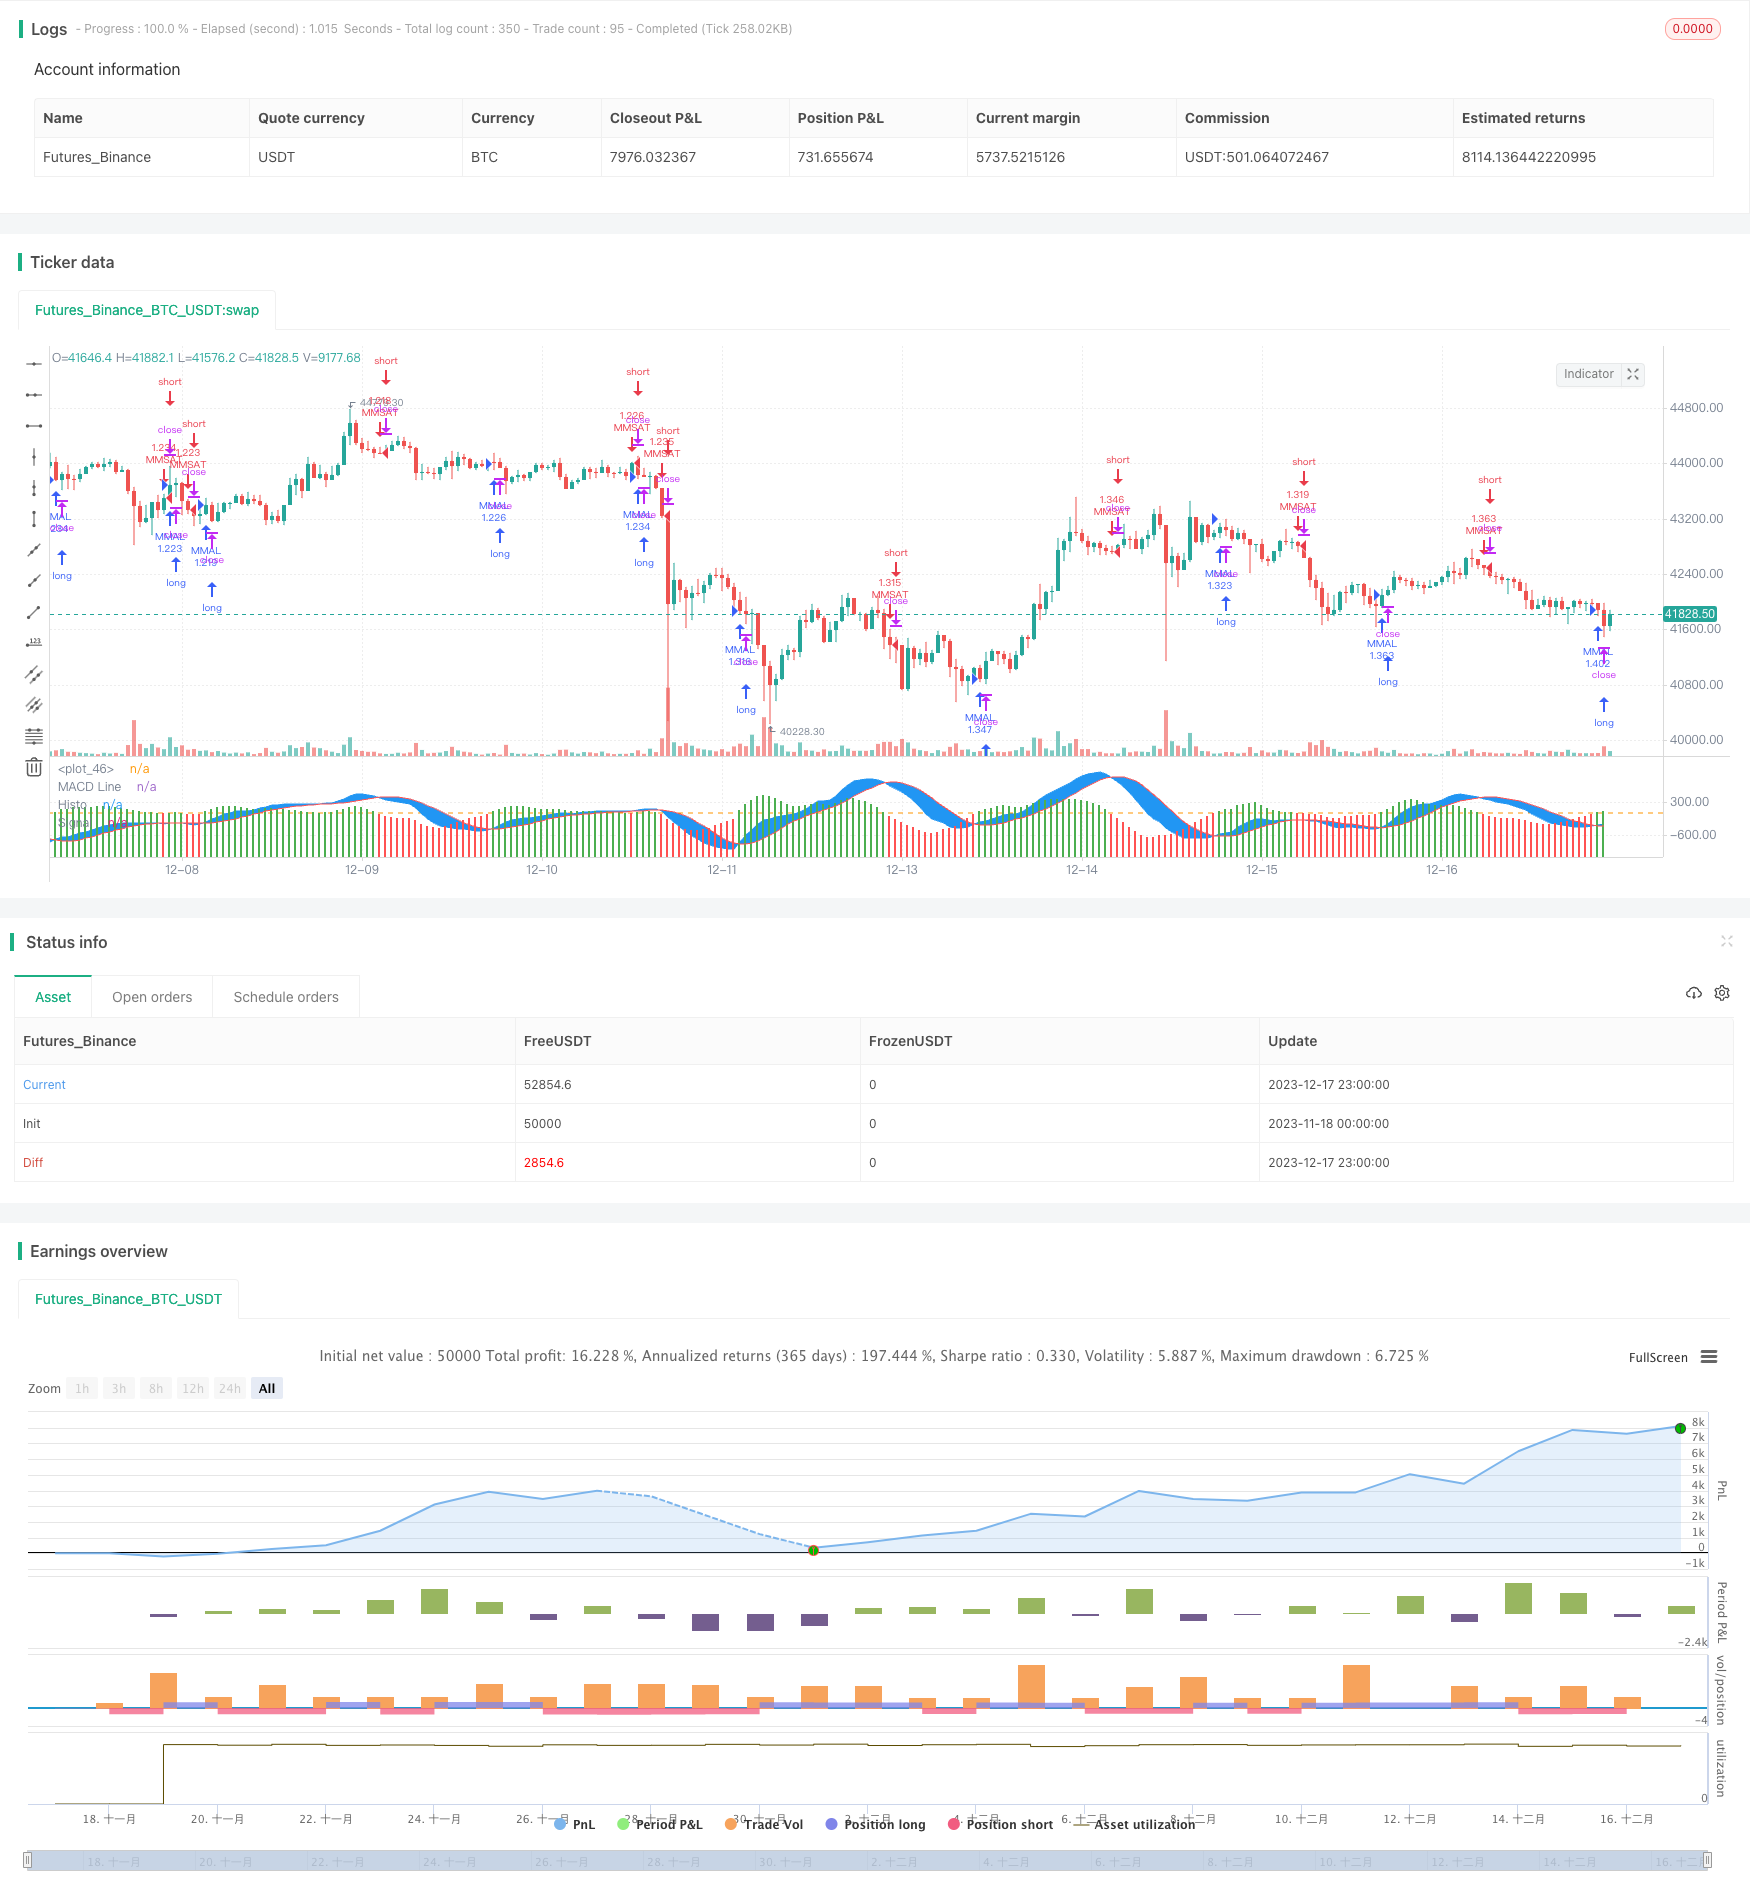
Overview
This strategy calculates Heikin-Ashi candlesticks to smooth price lines and combines MACD indicator to generate trading signals, implementing a quantitative strategy that tracks medium-to-long term trends.
Strategy Logic
Calculate Heikin-Ashi open, close, high and low prices to plot Heikin-Ashi candlesticks and smooth price trends.
Set MACD parameters: fast length 12, slow length 26, signal length 9.
Calculate DEA slow line, DEA fast line and MACD histogram. Plot MACD histogram.
Go long when MACD histogram crosses above 0; Go short when crossing below 0.
Add year, month and day filters to limit trading to specified time range.
Advantage Analysis
Heikin-Ashi candlesticks filter out market noise effectively to identify trends.
MACD provides clear trend trading signals.
Combining Heikin-Ashi and MACD improves signal quality and profitability.
Time filters help optimize trading schedule based on historical performance.
Risk Analysis
Potential large losses during trend reversal.
Improper MACD parameters may generate excessive worthless signals.
Rigid time filters may miss good trading opportunities.
Countermeasures:
Set stop loss/take profit to limit losses.
Optimize MACD parameters to determine best combination.
Add indicators to determine local trends.
Optimization Directions
Test different parameter combinations to find optimum.
Add stop loss mechanisms like trailing stop loss.
Add indicators like EMA, KDJ to determine reversal points.
Add volume indicators to avoid divergence.
Summary
This strategy smoothes price action with Heikin-Ashi candlesticks and determines trend direction and entry signals with MACD Tradingview indicator to implement a trend-following quant strategy. Compared with regular MACD strategies, it filters out some noise for clearer trend identification. Further enhancements on parameter optimization, stop loss, and combo indicators can improve its stability and profitability.
Parameters
| Name | Default | What it controls |
|---|---|---|
| v_input_1 | 12 | MACD Fast Line Length |
| v_input_2 | 26 | MACD Slow Line Length |
| v_input_3 | 9 | Signal Line Length |
| v_input_4 | 2020 | yearfrom |
| v_input_5 | 2042 | yearuntil |
| v_input_6 | true | monthfrom |
| v_input_7 | 12 | monthuntil |
| v_input_8 | true | dayfrom |
| v_input_9 | 31 | dayuntil |
Source Pine Script
/*backtest
start: 2023-11-18 00:00:00
end: 2023-12-18 00:00:00
period: 1h
basePeriod: 15m
exchanges: [{"eid":"Futures_Binance","currency":"BTC_USDT"}]
*/

//@version=4
strategy("MACD ASHI BARS .v1 ", overlay=false,default_qty_type = strategy.percent_of_equity, default_qty_value = 100,commission_type=strategy.commission.percent,commission_value=0.1,slippage=1)

// Calculation HA Values
haopen  = 0.0
haclose = (open + high + low + close) / 4
haopen := na(haopen[1]) ? (open + close) / 2 : (haopen[1] + haclose[1]) / 2
hahigh  = max(high, max(haopen, haclose))
halow   = min(low,  min(haopen, haclose))

// HA colors
hacolor = haclose > haopen ? color.green : color.red
src=haclose


fastmacd = input(12,title='MACD Fast  Line Length')
slowmacd = input(26,title='MACD Slow Line Length')
signalmacd = input(9,title='Signal Line Length')

macdslowline1 = sma(src,slowmacd)
macdslowline2 = sma(macdslowline1,slowmacd)
DEMAslow = ((2 * macdslowline1) - macdslowline2 )

macdfastline1 = sma(src,fastmacd)
macdfastline2 = sma(macdfastline1,fastmacd)
DEMAfast = ((2 * macdfastline1) - macdfastline2)

MACDLine = (DEMAfast - DEMAslow)

SignalLine = sma(MACDLine, signalmacd)

delta = MACDLine-SignalLine


swap1 = delta>0?color.green:color.red


plot(delta,color=swap1,style=plot.style_columns,title='Histo',histbase=0,transp=20)
p1 = plot(MACDLine,color=color.blue,title='MACD Line')
p2 = plot(SignalLine,color=color.red,title='Signal')
fill(p1, p2, color=color.blue)
hline(0)


yearfrom = input(2020)
yearuntil =input(2042)
monthfrom =input(1)
monthuntil =input(12)
dayfrom=input(1)
dayuntil=input(31)


if ( crossover(delta,0)  and   year >= yearfrom and year <= yearuntil and month>=monthfrom and month <=monthuntil and dayofmonth>=dayfrom and dayofmonth < dayuntil)
    strategy.entry("MMAL", strategy.long, stop=close, oca_name="TREND",  comment="AL")

else
    strategy.cancel(id="MMAL")


if (  crossunder(delta,0) and  year >= yearfrom and year <= yearuntil and month>=monthfrom and month <=monthuntil and dayofmonth>=dayfrom and dayofmonth < dayuntil )

    strategy.entry("MMSAT", strategy.short,stop=close, oca_name="TREND",  comment="SAT")
else
    strategy.cancel(id="MMSAT")
Published by ChaoZhang on the FMZ strategy square · last modified 2023-12-19. Collected in the Quant Trading Vault. Unvalidated research: re-test with your own data and costs before trusting it.
Build this with AgenKit
A spec is not a trading system. Paste this into your coding agent and AgenKit runs a specialist team — architecture, test-first build, risk gates, review — with paper trading on by default.
/agenkit build a production-grade trading bot with a backtest engine, risk controls and paper trading by default from strategies/Gradient-MACD-Quant-Strategy.md- npx agenkit install engineering-kit in your project
- Paste the command into your agent and approve each phase
- Get tests, backtest, risk controls and a paper-trading switch
Understand it first
Before you run this, read the lesson behind the idea and how to backtest it honestly. Specs like this one are the survivors of an unknown number of trials; deflate their results accordingly.
Related specs
- Market Cypher Wave B Automated Trading StrategyPine Script · Mean reversion · 1h
- Multi Indicator Trend Reversal Trading StrategyPine Script · Mean reversion · 1h
- ATR and EMA based Dynamic Take Profit and Stop Loss Adaptive StrategyPine Script · Mean reversion · 1h
- Advanced 15 Minute Chart Trading Signal StrategyPine Script · Mean reversion · 3h
- BONK Multi Factor Trading StrategyPine Script · Mean reversion · 1d
- Customizable Non Repainting HTF MACD MFI Scalable Bot StrategyPine Script · Mean reversion · 1d