Grid Trading Strategy Based on Moving Average System
This strategy uses moving average theory to build a grid trading system by judging the market trend through multiple sets of JMA moving averages with different parameters. It aims to capture profits during long-term…
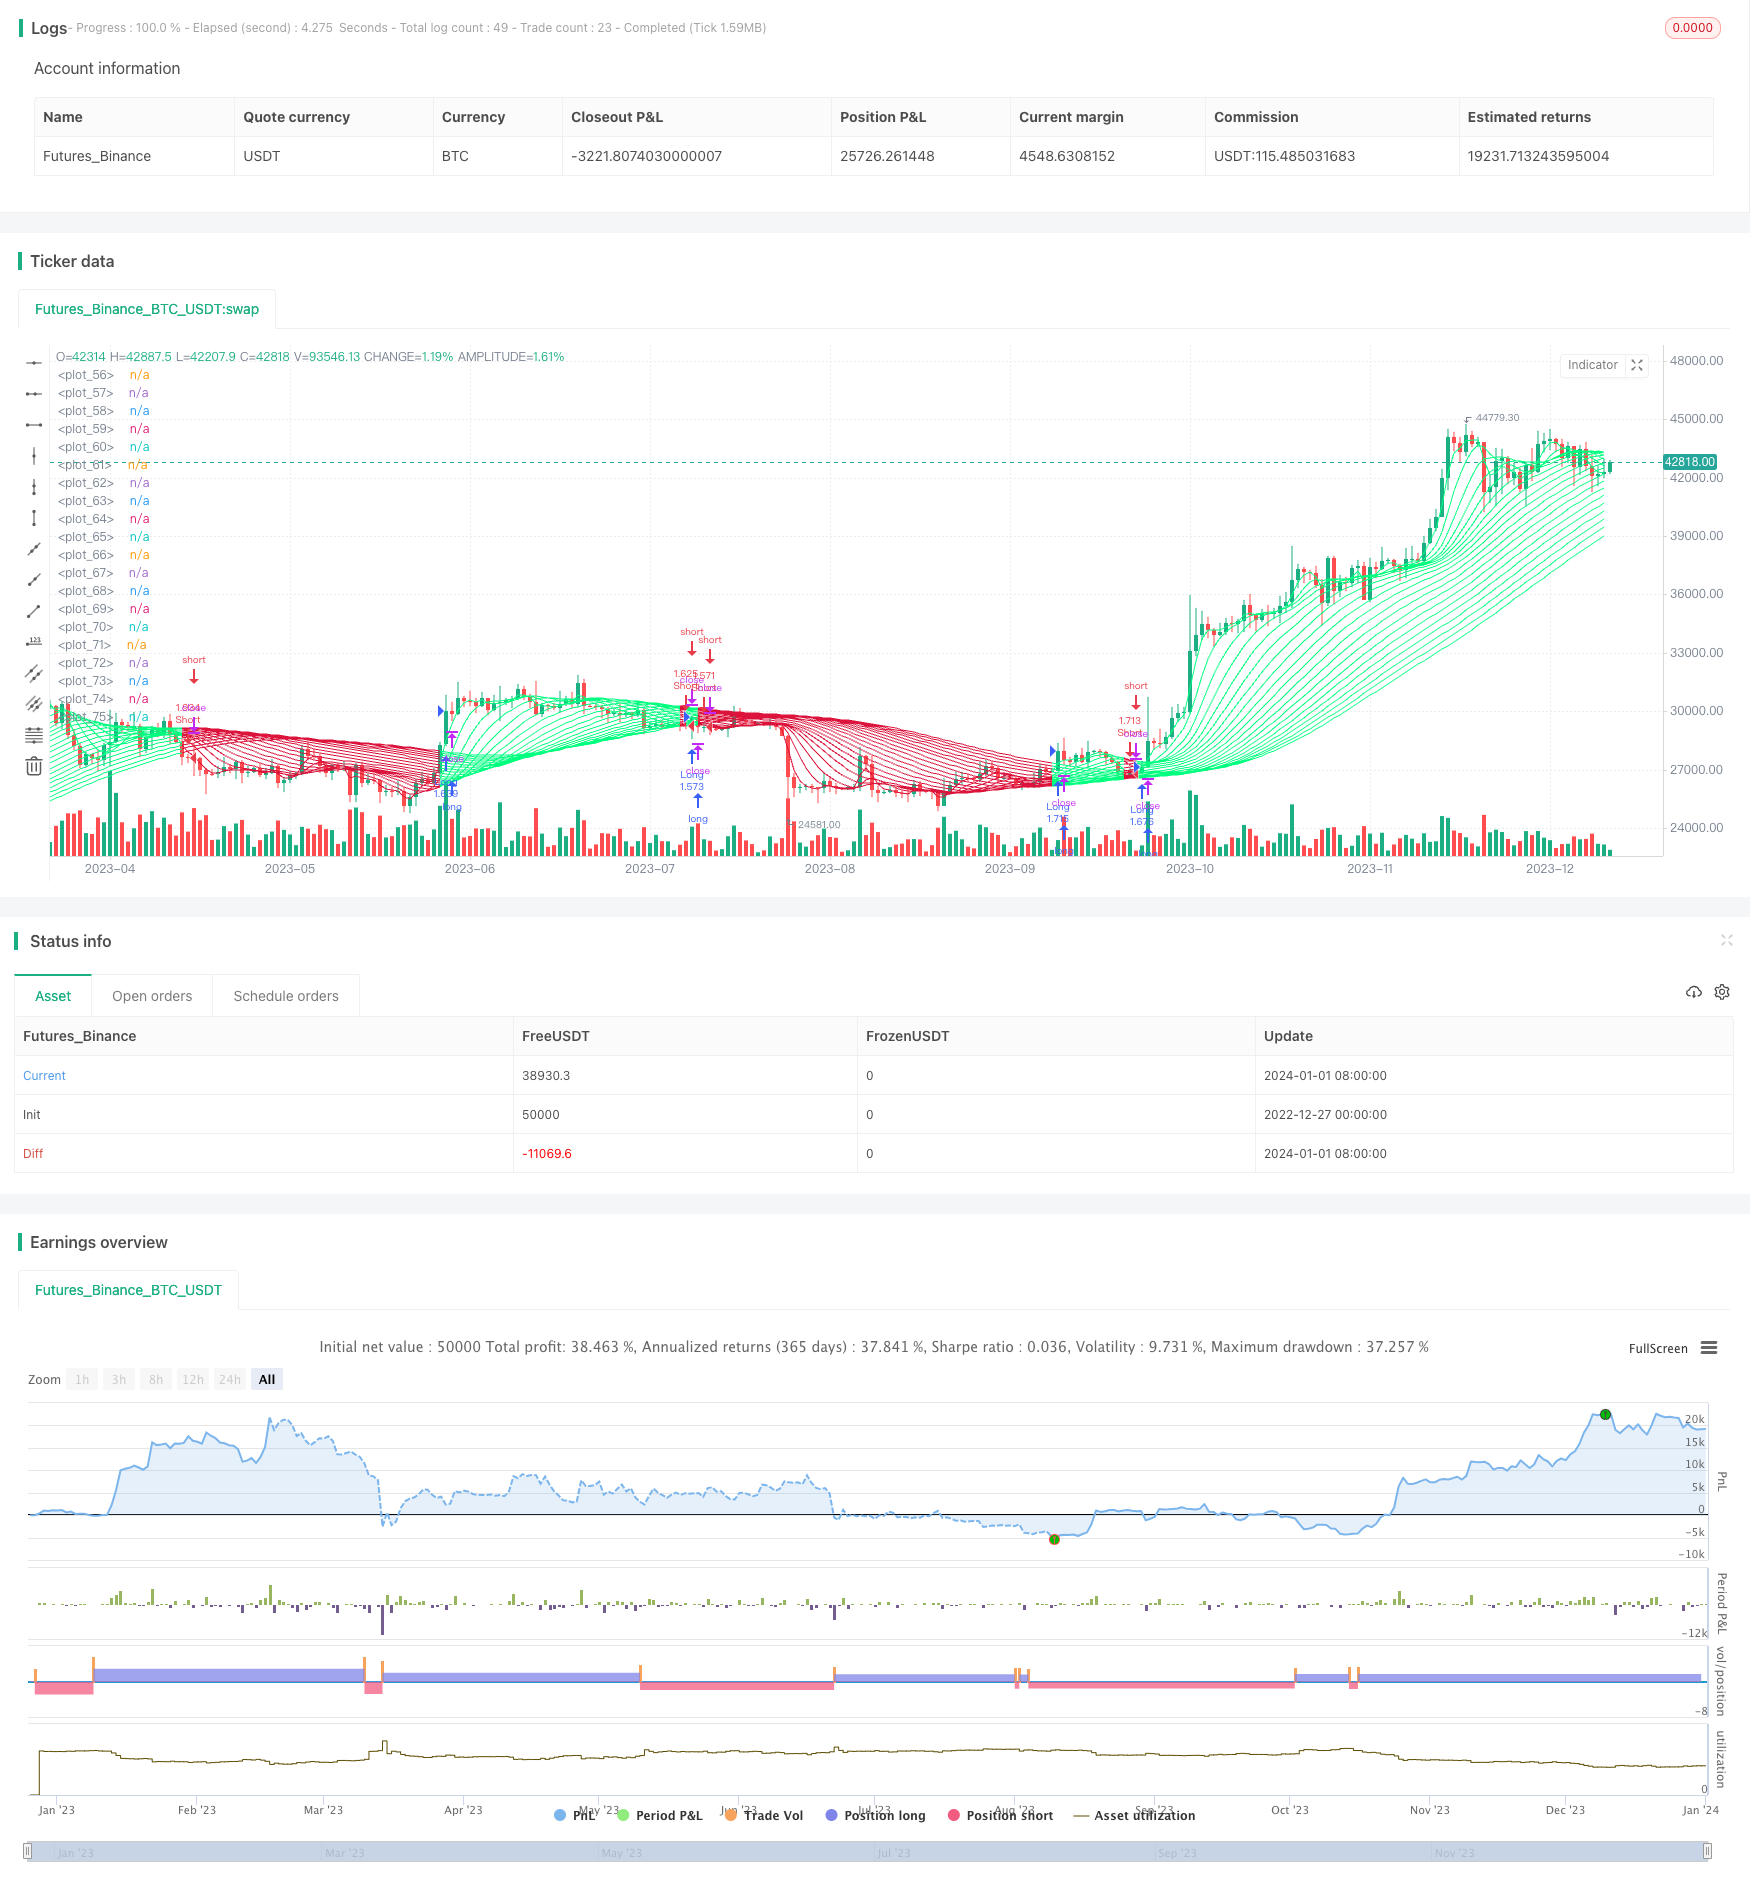
Overview
This strategy uses moving average theory to build a grid trading system by judging the market trend through multiple sets of JMA moving averages with different parameters. It aims to capture profits during long-term trend reversals in the market.
Strategy Logic
Use a combination of 1-20 period JMA moving averages to determine the market trend. When the short period MA is above the long period MA, it is judged as an upward trend, and vice versa as a downward trend.
Open grid trades at trend reversal points, when the short MA crosses below or above the long MA. Establish short positions gradually during uptrends, and long positions during downtrends.
An option to filter based on candlestick color - only buy on red candles and sell on green candles, otherwise disregard color and trade at trend reversal only.
Exits are either tracking stop loss or time-based exit when strategy duration ends.
Advantage Analysis
Using MA system to determine trends can effectively identify long-term trend reversals.
Grid trading can capture profits from range-bound markets without clear trends, with stop loss to control risks.
Customizable JMA parameters, can optimize for different periods, high flexibility.
Candle filter avoids being misled by false breakouts.
Risk Analysis
High whip saw markets without clear trends have higher stop loss risks.
Judgment errors from MA system may lead to incorrect trade signals.
Candle filter risks missing some trading opportunities.
If grid spacing is too wide, insufficient profits; too narrow may result in too many positions and high costs.
Optimization Directions
Test more parameter combinations to find optimal JMA MA combinations for different products.
Incorporate other filters like BOLL bands, KD etc to improve signal quality.
Optimize grid configurations like grid spacing, entry lots etc.
Consider more stop loss methods like gap based, trailing stops etc.
Conclusion
This strategy judges reversals using JMA theory and opens grid trades at turning points to capture profits from long-term trend shifts. Performance can be further improved through parameter optimization. Overall it is suitable for medium-long term holdings to gradually track and profit from trending moves.
Parameters
| Name | Default | What it controls |
|---|---|---|
| v_input_1 | true | Long |
| v_input_2 | true | Short |
| v_input_3 | 100 | Lot |
| v_input_4 | false | Use Color-filter |
| v_input_5 | 1900 | From Year |
| v_input_6 | 2100 | To Year |
| v_input_7 | true | From Month |
| v_input_8 | 12 | To Month |
| v_input_9 | true | From day |
| v_input_10 | 31 | To day |
Source Pine Script
/*backtest
start: 2022-12-27 00:00:00
end: 2024-01-02 00:00:00
period: 1d
basePeriod: 1h
exchanges: [{"eid":"Futures_Binance","currency":"BTC_USDT"}]
*/

//Noro
//2019

//@version=3
strategy(title = "Noro's Fishnet Strategy", shorttitle = "Fishnet str", overlay = true, default_qty_type = strategy.percent_of_equity, default_qty_value = 100, pyramiding = 0)

//Settings
needlong = input(true, defval = true, title = "Long")
needshort = input(true, defval = true, title = "Short")
capital = input(100, defval = 100, minval = 1, maxval = 10000, title = "Lot")
usecf = input(false, defval = false, title = "Use Color-filter")
fromyear = input(1900, defval = 1900, minval = 1900, maxval = 2100, title = "From Year")
toyear = input(2100, defval = 2100, minval = 1900, maxval = 2100, title = "To Year")
frommonth = input(01, defval = 01, minval = 01, maxval = 12, title = "From Month")
tomonth = input(12, defval = 12, minval = 01, maxval = 12, title = "To Month")
fromday = input(01, defval = 01, minval = 01, maxval = 31, title = "From day")
today = input(31, defval = 31, minval = 01, maxval = 31, title = "To day")

//JMA
jmax(src, len) =>
    beta = 0.45*(len-1)/(0.45*(len-1)+2)
    alpha = pow(beta, 3)
    L0=0.0, L1=0.0, L2=0.0, L3=0.0, L4=0.0
    L0 := (1-alpha)*src + alpha*nz(L0[1])
    L1 := (src - L0[0])*(1-beta) + beta*nz(L1[1])
    L2 := L0[0] + L1[0]
    L3 := (L2[0] - nz(L4[1]))*((1-alpha)*(1-alpha)) + (alpha*alpha)*nz(L3[1])
    L4 := nz(L4[1]) + L3[0]
	L4

ma01 = jmax(close, 10)
ma02 = jmax(close, 20)
ma03 = jmax(close, 30)
ma04 = jmax(close, 40)
ma05 = jmax(close, 50)
ma06 = jmax(close, 60)
ma07 = jmax(close, 70)
ma08 = jmax(close, 80)
ma09 = jmax(close, 90)
ma10 = jmax(close, 100)
ma11 = jmax(close, 110)
ma12 = jmax(close, 120)
ma13 = jmax(close, 130)
ma14 = jmax(close, 140)
ma15 = jmax(close, 150)
ma16 = jmax(close, 160)
ma17 = jmax(close, 170)
ma18 = jmax(close, 180)
ma19 = jmax(close, 190)
ma20 = jmax(close, 200)

trend = 0
trend := ma01 > ma20 ? 1 : ma01 < ma20 ? -1 : trend[1]
col = trend == 1 ? #00FF7F : #DC143C

plot(ma01, transp = 0, color = col)
plot(ma02, transp = 0, color = col)
plot(ma03, transp = 0, color = col)
plot(ma04, transp = 0, color = col)
plot(ma05, transp = 0, color = col)
plot(ma06, transp = 0, color = col)
plot(ma07, transp = 0, color = col)
plot(ma08, transp = 0, color = col)
plot(ma09, transp = 0, color = col)
plot(ma10, transp = 0, color = col)
plot(ma11, transp = 0, color = col)
plot(ma12, transp = 0, color = col)
plot(ma13, transp = 0, color = col)
plot(ma14, transp = 0, color = col)
plot(ma15, transp = 0, color = col)
plot(ma16, transp = 0, color = col)
plot(ma17, transp = 0, color = col)
plot(ma18, transp = 0, color = col)
plot(ma19, transp = 0, color = col)
plot(ma20, transp = 0, color = col)

//Trading
lot = 0.0
lot := strategy.equity / close * capital / 100

if trend == 1 and (close < open or usecf == false)
    strategy.entry("Long", strategy.long, needlong ? lot : na)

if trend == -1 and (close > open or usecf == false)
    strategy.entry("Short", strategy.short, needshort ? lot : na)
Published by ChaoZhang on the FMZ strategy square · last modified 2024-01-03. Collected in the Quant Trading Vault. Unvalidated research: re-test with your own data and costs before trusting it.
Build this with AgenKit
A spec is not a trading system. Paste this into your coding agent and AgenKit runs a specialist team — architecture, test-first build, risk gates, review — with paper trading on by default.
/agenkit build a grid bot with inventory caps and order deduplication from strategies/Grid-Trading-Strategy-Based-on-Moving-Average-System.md- npx agenkit install engineering-kit in your project
- Paste the command into your agent and approve each phase
- Get tests, backtest, risk controls and a paper-trading switch
Understand it first
Before you run this, read the lesson behind the idea and how to backtest it honestly. Specs like this one are the survivors of an unknown number of trials; deflate their results accordingly.
Related specs
- Adaptive Bollinger Bands Grid Trading Strategy with Dynamic Level AdjustmentPine Script · Grid · 1d
- Adaptive Grid Trading Strategy Based on Quantitative Trading PlatformPine Script · Grid · 1h
- Assassins Grid B A Dynamic Grid Trading StrategyPine Script · Grid · 1d
- Bollinger Fibonacci Grid Tracking Trend StrategyPine Script · Grid · 1h
- Double Bottom Reversal Mean Reversion DCA Grid StrategyPine Script · Grid · 3m
- Fixed Grid Trading StrategyPine Script · Grid · 1d