Strategy vault / Trend following
Heiken Ashi and Super Trend Combination Strategy
This is a quantitative trading strategy that combines the Heiken Ashi and Super Trend indicators. The strategy mainly uses Heiken Ashi to smooth candlesticks and filter market noise, and uses the Super Trend…
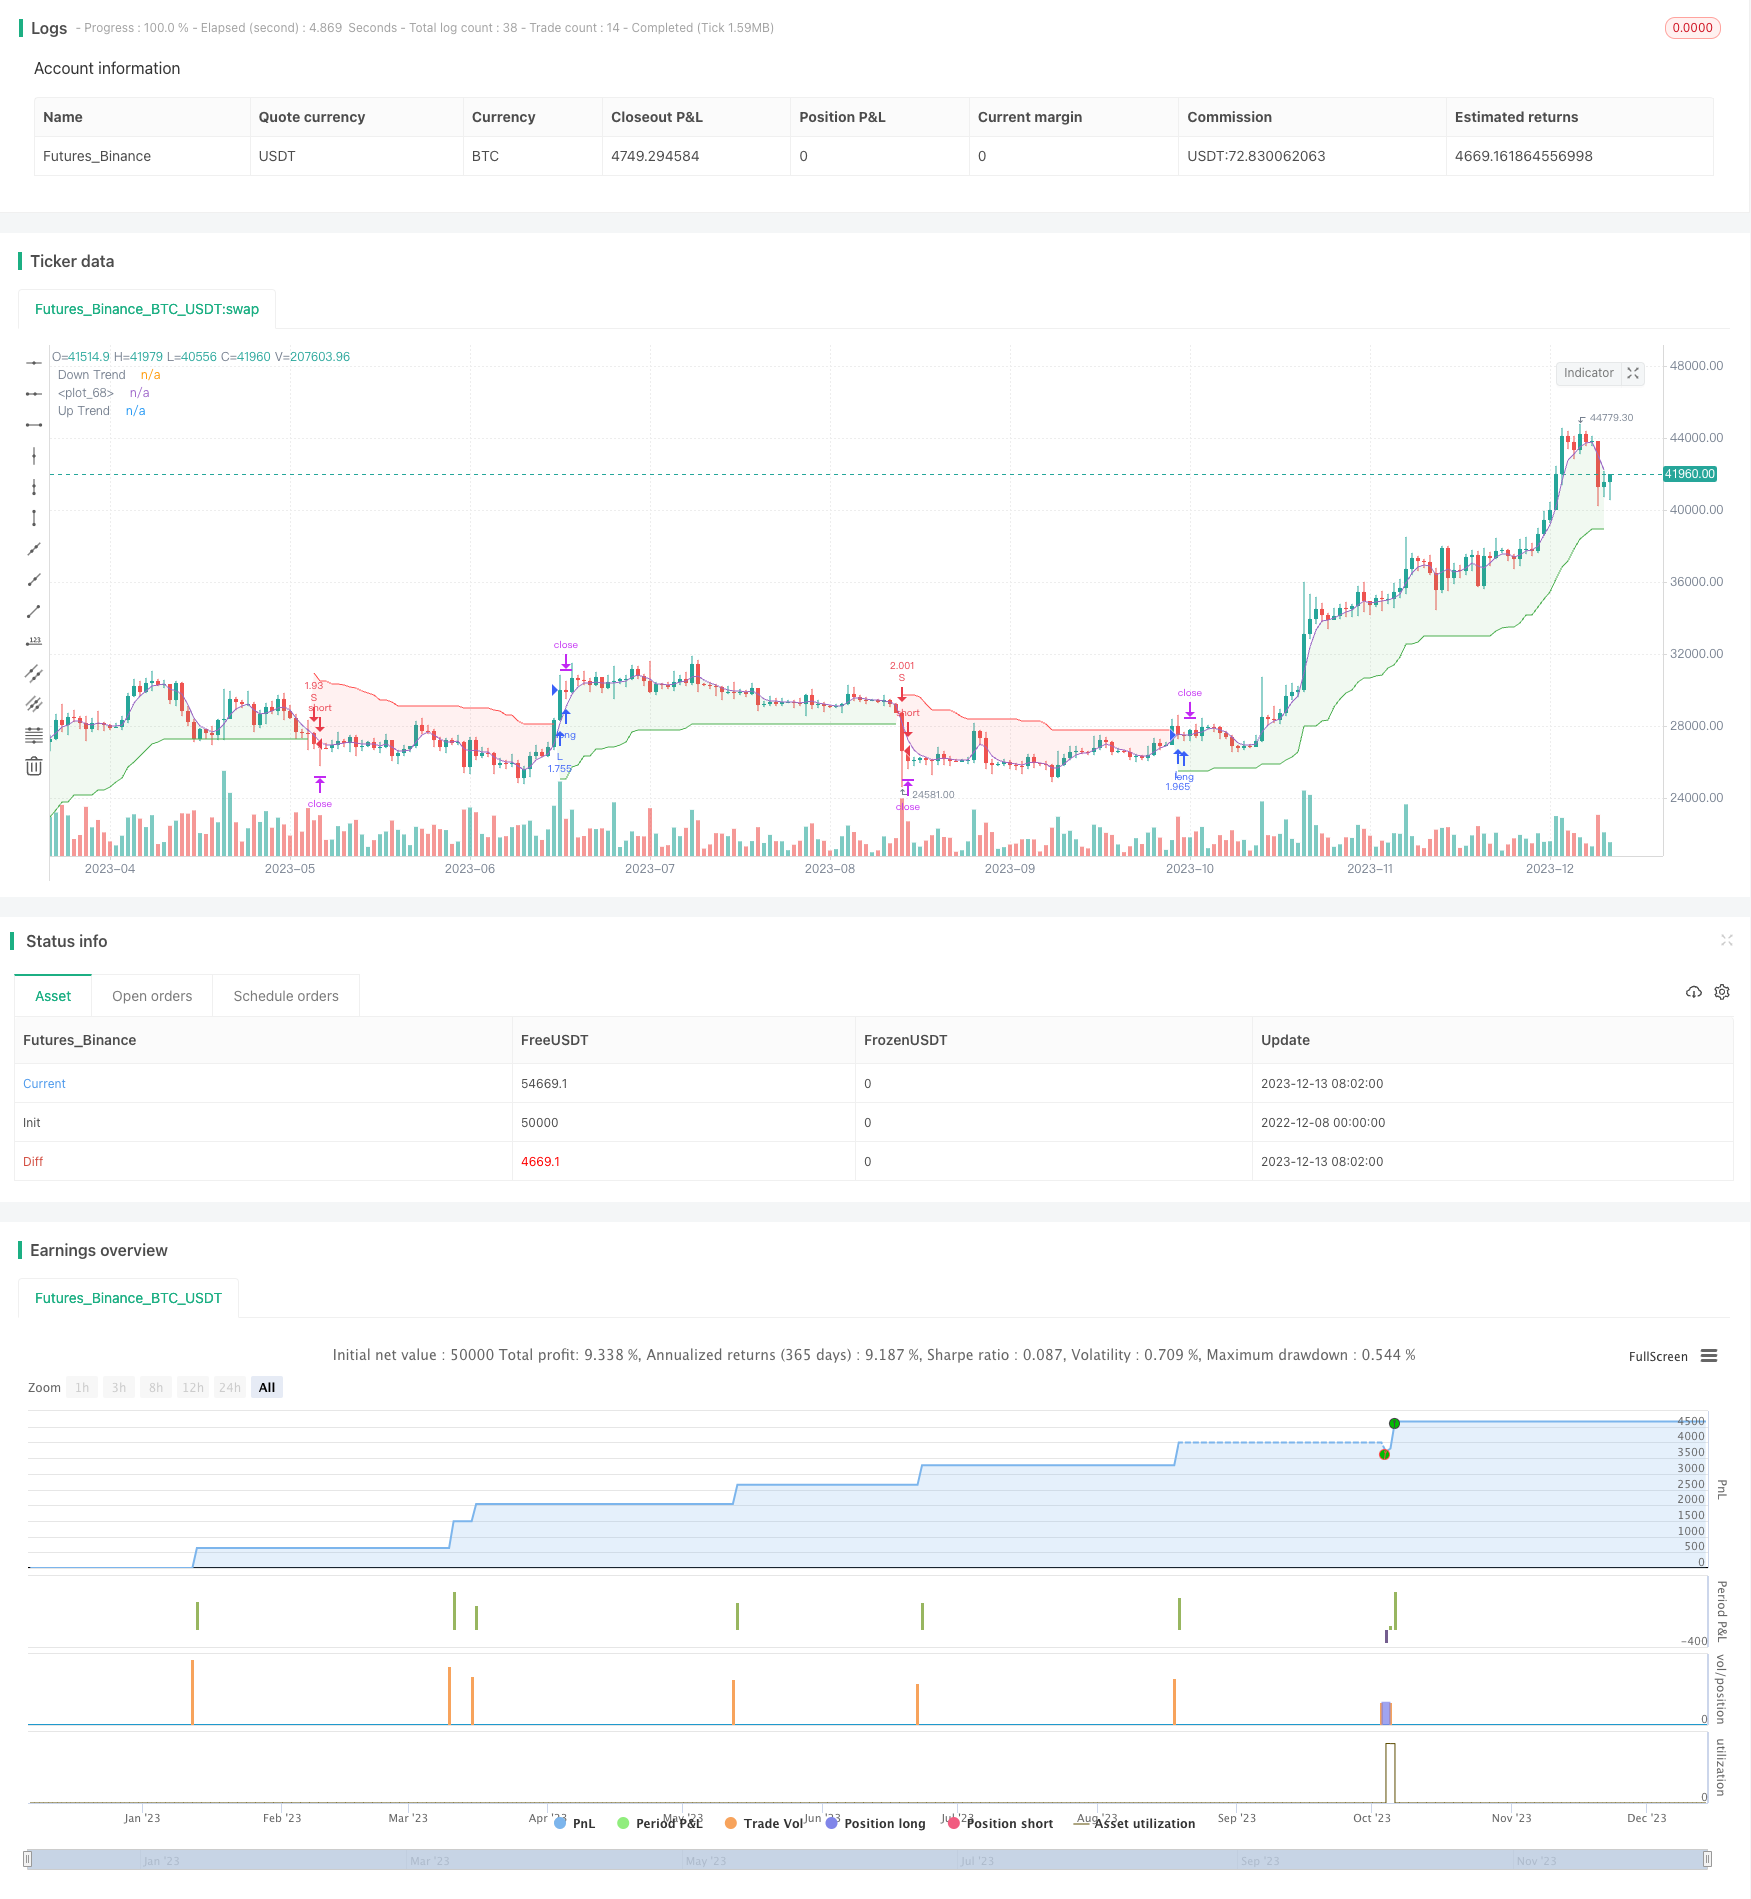
Overview
This is a quantitative trading strategy that combines the Heiken Ashi and Super Trend indicators. The strategy mainly uses Heiken Ashi to smooth candlesticks and filter market noise, and uses the Super Trend indicator to judge the price trend direction to track trends.
Strategy Principle
- Use the Heiken Ashi indicator to process candlesticks, filter out some market noise, and make the trend more obvious
- Calculate the upper and lower bands of the Super Trend based on ATR and factors
- When the price breaks through the upper rail, it is a bearish signal. When it breaks through the lower rail, it is a bullish signal
- The larger the factor, the fewer Super Trend signals, the better the tracking effect, but the number of entries decreases
- Combine Heiken Ashi and Super Trend indicators to judge and track trends
Advantages of the Strategy
- Heiken Ashi indicator effectively filters out some market noise and makes the graph clearer
- The Super Trend indicator has good optimization effect and can flexibly adjust the frequency of entry
- Combining double indicators makes the effect of judging the price trend better
- Automatically track strong trends
Risks of the Strategy
- The combination of indicators cannot completely avoid wrong signals in the interval of market consolidation
- Large gaps may cause invalid indicators, thus missing important signal points
- Setting the Super Trend factor too large will miss trend opportunities
Solutions:
(1) Properly adjust Super Trend parameters to balance tracking effect and frequency of entry
(2) Increase other indicators to assist in judging to avoid problems caused by gaps
Optimization Directions of the Strategy
- Adjust ATR cycle and Super Trend factor to optimize entry frequency
- Increase stop loss indicator to control single loss
- Combine other indicators to determine the trend type to avoid improper handling of the rhythm of trend shocks
- Increase machine learning algorithms to assist in judging trend direction
Summary
This strategy integrates the advantages of the double indicators of Heiken Ashi and Super Trend, uses the indicators to determine the direction of the price trend, and achieves automatic tracking. Compared with using a single indicator alone, the effect of judging price movements is better, and the stability of the strategy is enhanced. Of course, there is still room for improvement. In the future, optimization can be carried out from the aspects of entry frequency and stop loss to make the strategy more profitable and less risky.
Parameters
| Name | Default | What it controls |
|---|---|---|
| v_input_1 | 10 | ATR Length |
| v_input_float_1 | 3 | Factor |
| v_input_float_2 | 1.1 | TP [%] |
| v_input_int_1 | 2000 | (?BACKTEST)start year |
| v_input_int_2 | true | start month |
| v_input_int_3 | true | start day |
| v_input_int_4 | 3333 | stop year |
| v_input_int_5 | 12 | stop month |
| v_input_int_6 | 31 | stop day |
Source Pine Script
/*backtest
start: 2022-12-08 00:00:00
end: 2023-12-14 00:00:00
period: 1d
basePeriod: 1h
exchanges: [{"eid":"Futures_Binance","currency":"BTC_USDT"}]
*/

// This source code is subject to the terms of the Mozilla Public License 2.0 at https://mozilla.org/MPL/2.0/
// © RingsCherrY

//@version=5

strategy("Heiken Ashi & Super Trend", overlay=true,  pyramiding=1,initial_capital = 10000, default_qty_type= strategy.percent_of_equity, default_qty_value = 100, calc_on_order_fills=false, slippage=0,commission_type=strategy.commission.percent,commission_value=0.02)

///////////////////////////////////////////////////
////////////////////Function///////////////////////
///////////////////////////////////////////////////


heikinashi_open = request.security(ticker.heikinashi(syminfo.tickerid), timeframe.period, open)
heikinashi_high = request.security(ticker.heikinashi(syminfo.tickerid), timeframe.period, high)
heikinashi_low  = request.security(ticker.heikinashi(syminfo.tickerid), timeframe.period, low)
heikinashi_close= request.security(ticker.heikinashi(syminfo.tickerid), timeframe.period, close)
heikinashi_color = heikinashi_open < heikinashi_close ? #53b987 : #eb4d5c
// plotbar(heikinashi_open, heikinashi_high, heikinashi_low, heikinashi_close, color=heikinashi_color)

x_sma(x, y) =>
    sumx = 0.0
    for i = 0 to y - 1
        sumx := sumx + x[i] / y
    sumx

x_rma(src, length) =>
	alpha = 1/length
	sum = 0.0
	sum := na(sum[1]) ? x_sma(src, length) : alpha * src + (1 - alpha) * nz(sum[1])

x_atr(length) =>
    trueRange = na(heikinashi_high[1])? heikinashi_high-heikinashi_low : math.max(math.max(heikinashi_high - heikinashi_low, math.abs(heikinashi_high - heikinashi_close[1])), math.abs(heikinashi_low - heikinashi_close[1]))
    //true range can be also calculated with ta.tr(true)
    x_rma(trueRange, length)

x_supertrend(factor, atrPeriod) =>
	src = (heikinashi_high+heikinashi_low)/2
	atr = x_atr(atrPeriod)
	upperBand = src + factor * atr
	lowerBand = src - factor * atr
	prevLowerBand = nz(lowerBand[1])
	prevUpperBand = nz(upperBand[1])

	lowerBand := lowerBand > prevLowerBand or heikinashi_close[1] < prevLowerBand ? lowerBand : prevLowerBand
	upperBand := upperBand < prevUpperBand or heikinashi_close[1] > prevUpperBand ? upperBand : prevUpperBand
	int direction = na
	float superTrend = na
	prevSuperTrend = superTrend[1]
	if na(atr[1])
		direction := 1
	else if prevSuperTrend == prevUpperBand
		direction := heikinashi_close > upperBand ? -1 : 1
	else
		direction := heikinashi_close < lowerBand ? 1 : -1
	superTrend := direction == -1 ? lowerBand : upperBand
	[superTrend, direction]


///////////////////////////////////////////////////
////////////////////Indicators/////////////////////
///////////////////////////////////////////////////

atrPeriod = input(10, "ATR Length")
factor = input.float(3.0, "Factor", step = 0.01)

[supertrend, direction] = x_supertrend(factor, atrPeriod)

bodyMiddle = plot((heikinashi_open + heikinashi_close) / 2, display=display.none)
upTrend = plot(direction < 0 ? supertrend : na, "Up Trend", color = color.green, style=plot.style_linebr)
downTrend = plot(direction < 0? na : supertrend, "Down Trend", color = color.red, style=plot.style_linebr)

fill(bodyMiddle, upTrend, color.new(color.green, 90), fillgaps=false)
fill(bodyMiddle, downTrend, color.new(color.red, 90), fillgaps=false)

///////////////////////////////////////////////////
////////////////////Strategy///////////////////////
///////////////////////////////////////////////////

var bool longCond                    = na, var bool shortCond                   = na, longCond := nz(longCond[1]), shortCond := nz(shortCond[1])
var int CondIni_long                 = 0, var int CondIni_short                 = 0, CondIni_long := nz(CondIni_long[1]), CondIni_short := nz(CondIni_short[1])
var float open_longCondition         = na, var float open_shortCondition   = na


long  = ta.change(direction) < 0
short = ta.change(direction) > 0


longCond        :=                                                              long
shortCond       :=                                                              short

CondIni_long    :=                                                              longCond[1] ? 1 : shortCond[1] ? -1 : nz(CondIni_long[1])
CondIni_short   :=                                                              longCond[1] ? 1 : shortCond[1] ? -1 : nz(CondIni_short[1])
longCondition   =                                                               (longCond[1] and nz(CondIni_long[1]) == -1)
shortCondition  =                                                               (shortCond[1] and nz(CondIni_short[1]) == 1)


open_longCondition             :=                                          long ? close[1] :                                                      nz(open_longCondition[1])
open_shortCondition            :=                                          short ? close[1] :                                                     nz(open_shortCondition[1])


//TP
tp                    = input.float(1.1  , "TP [%]",                      step = 0.1)

//BACKTESTING inputs --------------------------------------------------------------------------------------------------------------------------------------------------------------------------------------------------------------------------------------------------------------------------------------------------------

testStartYear       =                   input.int(2000,                             title="start year",                                         minval = 1997, maxval = 3000,                                                   group= "BACKTEST")
testStartMonth      =                   input.int(01,                               title="start month",                                        minval = 1, maxval = 12,                                                        group= "BACKTEST")
testStartDay        =                   input.int(01,                               title="start day",                                          minval = 1, maxval = 31,                                                        group= "BACKTEST")
testPeriodStart     =                   timestamp(testStartYear,testStartMonth,testStartDay,0,0)
testStopYear        =                   input.int(3333,                             title="stop year",                                          minval=1980, maxval = 3333,                                                     group= "BACKTEST")
testStopMonth       =                   input.int(12,                               title="stop month",                                         minval=1, maxval=12,                                                            group= "BACKTEST")
testStopDay         =                   input.int(31,                               title="stop day",                                           minval=1, maxval=31,                                                            group= "BACKTEST")
testPeriodStop      =                   timestamp(testStopYear, testStopMonth, testStopDay, 0, 0)
testPeriod          =                   true

// Backtest  ==================================================================================================================================================================================================================================================================================================================================


if longCond
    strategy.entry("L", strategy.long, when=testPeriod)

if shortCond
    strategy.entry("S", strategy.short, when=testPeriod)


strategy.exit("TP_L", "L", profit =((open_longCondition   *       (1+(tp/100))) - open_longCondition)/syminfo.mintick)

strategy.exit("TP_S", "S", profit =((open_shortCondition  *       (1+(tp/100))) - open_shortCondition)/syminfo.mintick)
Published by ChaoZhang on the FMZ strategy square · last modified 2023-12-15. Collected in the Quant Trading Vault. Unvalidated research: re-test with your own data and costs before trusting it.
Build this with AgenKit
A spec is not a trading system. Paste this into your coding agent and AgenKit runs a specialist team — architecture, test-first build, risk gates, review — with paper trading on by default.
/agenkit build a production-grade trading bot with a backtest engine, risk controls and paper trading by default from strategies/Heiken-Ashi-and-Super-Trend-Combination-Strategy.md- npx agenkit install engineering-kit in your project
- Paste the command into your agent and approve each phase
- Get tests, backtest, risk controls and a paper-trading switch
Understand it first
Before you run this, read the lesson behind the idea and how to backtest it honestly. Specs like this one are the survivors of an unknown number of trials; deflate their results accordingly.
Related specs
- Heiken Ashi Trend Following Strategy Multi Timeframe Trend Identification System with Multi Layer Stop Loss MechanismPine Script · Trend following · 1d
- SuperTrend Trailing Stop Strategy Based on Heikin AshiPine Script · Trend following · 4h
- Multi Technical Indicator Gold Real Time Movement Detection and Risk Management StrategyPine Script · Trend following · 1d
- Bitcoin Multi factor Trading StrategyPine Script · Trend following · 10m
- Heiken Ashi and Super Trend StrategyPine Script · Trend following · 1d
- Triple Confirmation Trend Tracking StrategyPine Script · Trend following · 1h