Strategy vault / Trend following
Heyping Moving Average Trend Strategy
The Heyping Moving Average Trend Strategy is a technical indicator combo strategy designed to track price trends. It generates entry and exit signals based on moving average crossovers to time the market. The…
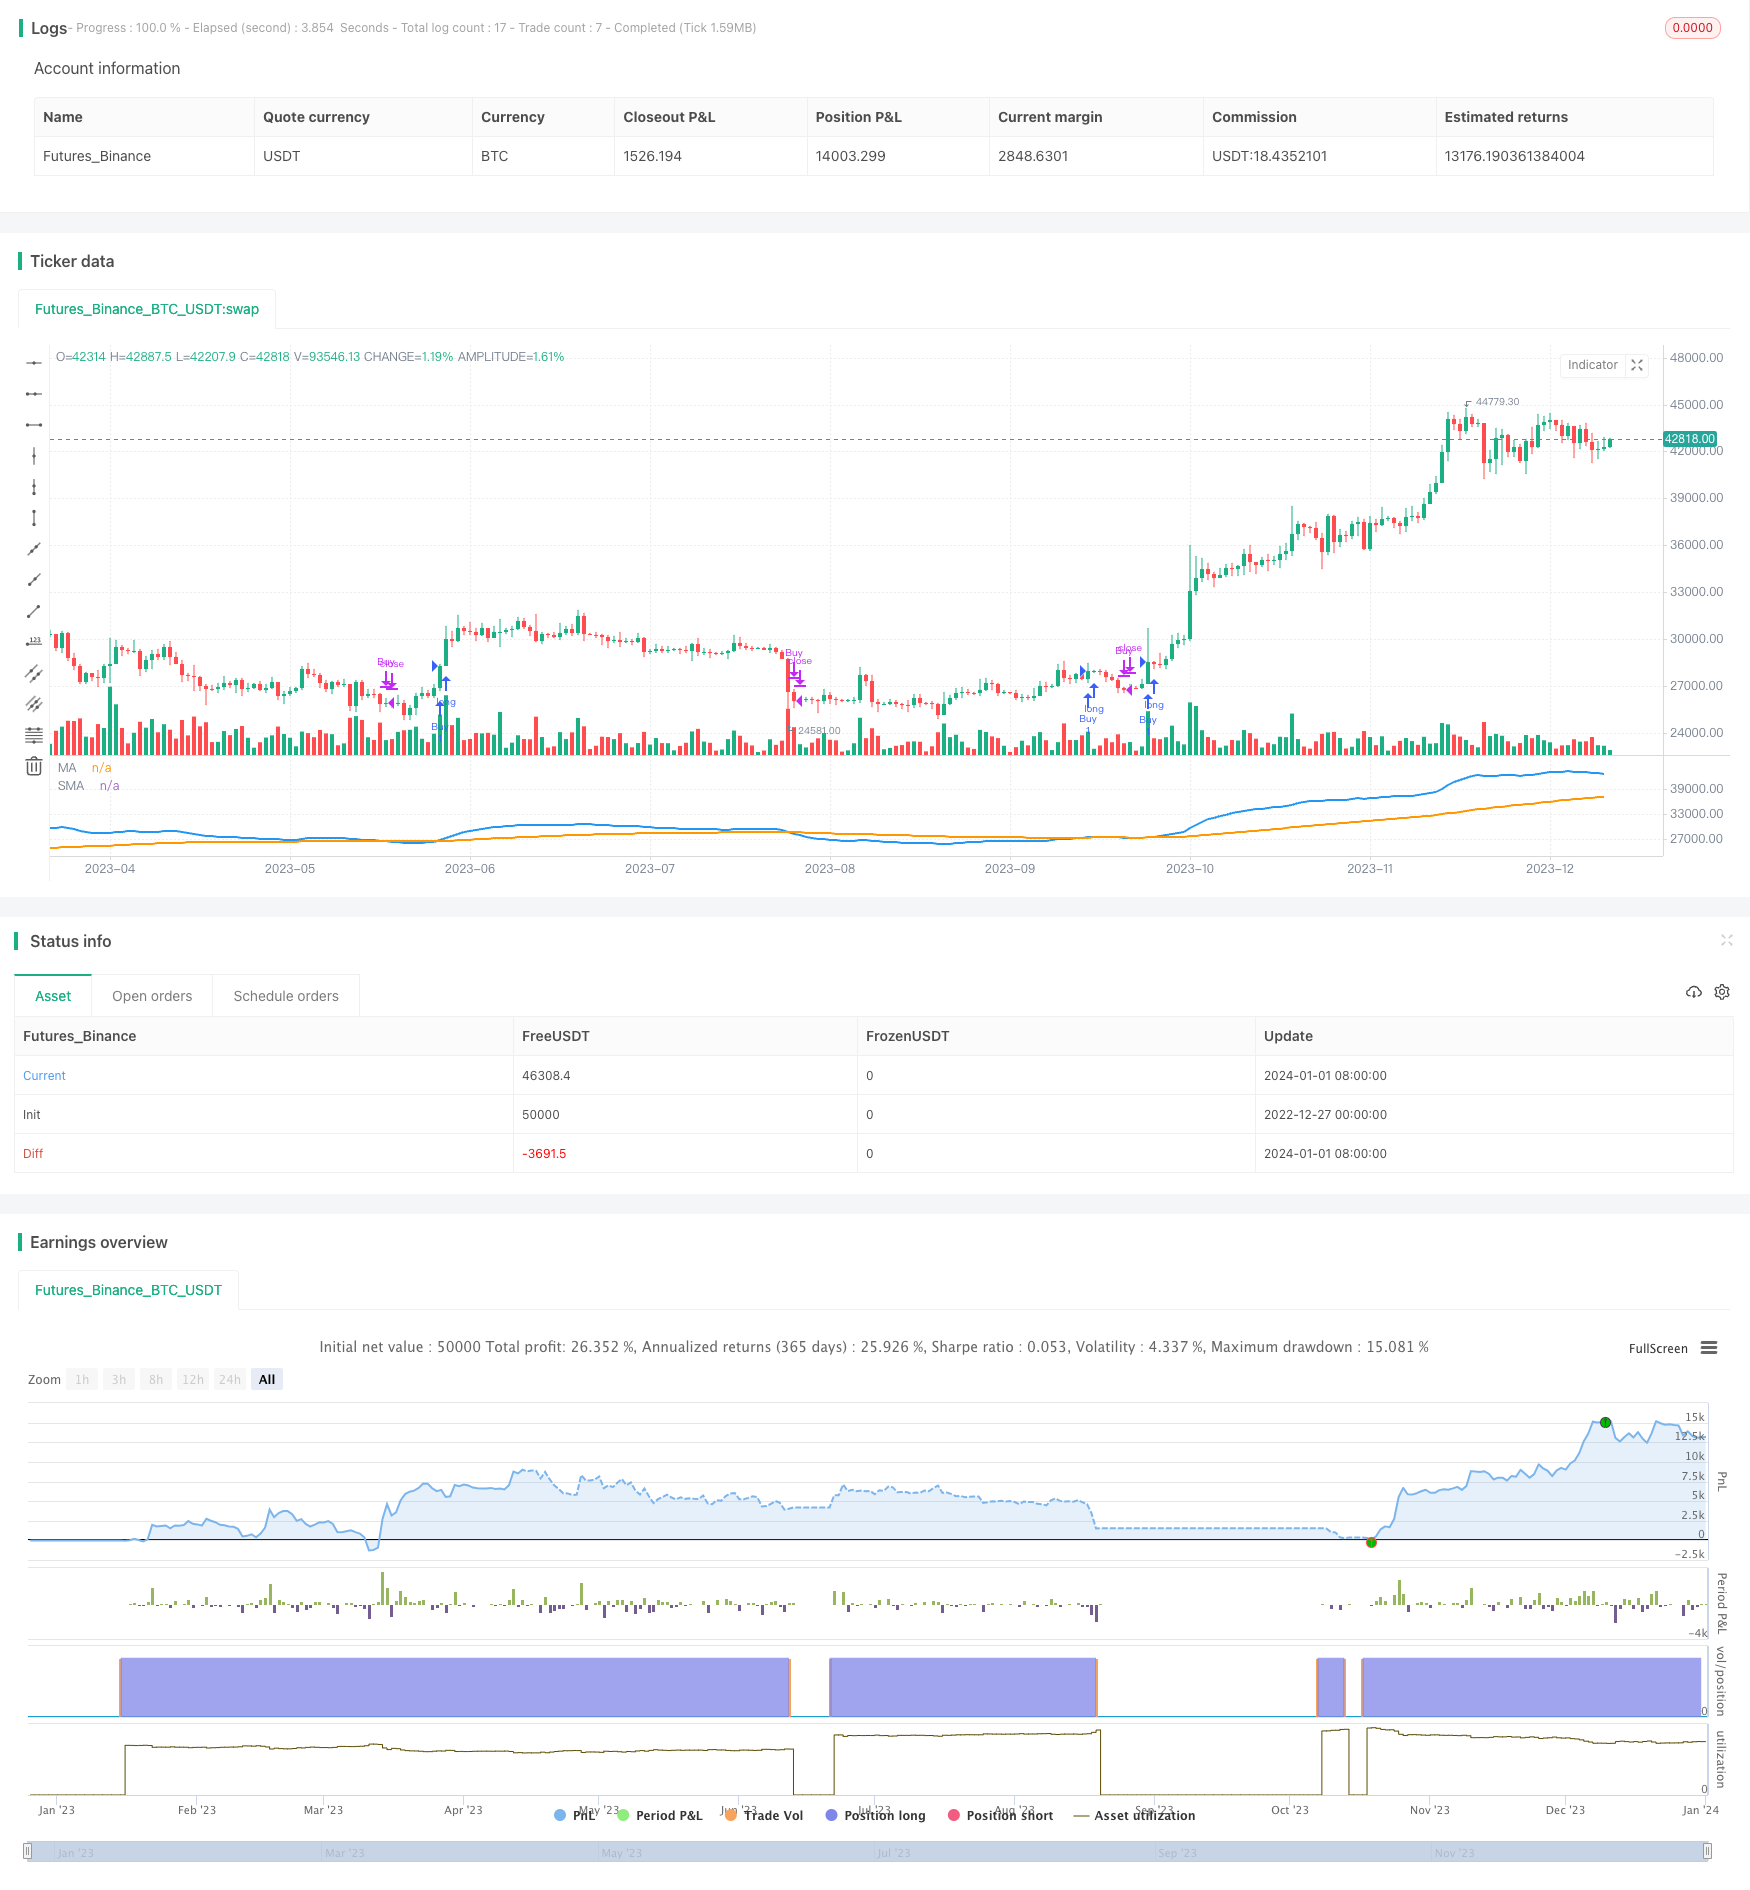
Overview
The Heyping Moving Average Trend Strategy is a technical indicator combo strategy designed to track price trends. It generates entry and exit signals based on moving average crossovers to time the market. The strategy can be implemented on the TradingView platform and optimized for performance.
Strategy Logic
The KP strategy utilizes three types of indicators:
Moving Averages: A faster EMA and slower SMA. The EMA reacts faster to price changes while the SMA is more stable. Crossovers between the two produce trade signals.
Heiken Ashi Candles: Special candlestick charts with clearer trend definition. Used as the price data source for plotting the EMAs.
Log Transformation: An option to log transform price data to better visualize percentage changes.
The specific logic is to go long when the faster EMA crosses above the slower SMA, and to exit the position when the reverse crossover happens. This strategy belongs to the trend following category.
Advantage Analysis
- Highly customizable parameters catering to different products and timeframes
- Visual indicators combined into an easy-to-read system
- Log transformation option to handle volatile instruments
- Heiken Ashi candles offer superior trend determination
- Integrates stop loss to control risk
Risk Analysis
- Trend reversal risk. Timely stop loss required
- Careful parameter optimization to avoid overfitting
- Instrument and timeframe selections greatly impact results
- Robustness must be validated through backtesting
Optimization Directions
- Add adaptive parameter optimization module
- Incorporate more filters to avoid false signals
- Build algo trading module for automation
- Apply machine learning models at inflection points
- Enhance stop loss strategy for dynamic trailing stop loss
Conclusion
The Heyping Moving Average Trend Strategy combines various technical indicators to define trend directions with flexible configurations and great visualization. It can serve as a baseline trend following strategy and be further tuned for live trading while noting no strategy is perfect. Risk management is key.
Parameters
| Name | Default | What it controls |
|---|---|---|
| v_input_1 | D | Heikin Ashi Candle Time Frame |
| v_input_2 | false | Heikin Ashi Candle Time Frame Shift |
| v_input_3 | W | Heikin Ashi EMA Time Frame |
| v_input_4 | false | Heikin Ashi EMA Time Frame Shift |
| v_input_5 | 10 | Heikin Ashi EMA Period |
| v_input_6 | false | Heikin Ashi EMA Shift |
| v_input_7 | 100 | Slow EMA Period |
| v_input_8 | false | Slow EMA Shift |
| v_input_9 | false | Log Transform |
| v_input_10 | true | Stop Loss |
| v_input_11 | true | Show Plots |
Source Pine Script
/*backtest
start: 2022-12-27 00:00:00
end: 2024-01-02 00:00:00
period: 1d
basePeriod: 1h
exchanges: [{"eid":"Futures_Binance","currency":"BTC_USDT"}]
*/

//@version=5
strategy("KP 15min Strategy", shorttitle="KP15", overlay=false)

res = input("D",title="Heikin Ashi Candle Time Frame")
hshift = input(0, title="Heikin Ashi Candle Time Frame Shift")
res1 = input("W",title="Heikin Ashi EMA Time Frame")
mhshift = input(0, title="Heikin Ashi EMA Time Frame Shift")
fama = input(10, title="Heikin Ashi EMA Period")
test = input(0, title="Heikin Ashi EMA Shift")
sloma = input(100, title="Slow EMA Period")
slomas = input(0, title="Slow EMA Shift")
logtransform = input(false, title="Log Transform")
stoploss = input(true, title="Stop Loss")
showplots = input(true, title="Show Plots")

ha_t = request.security(syminfo.tickerid, res, expression=hlc3)
ha_close = request.security(syminfo.tickerid, res, expression=logtransform ? math.log(close[hshift]) : close[hshift])
mha_close = request.security(syminfo.tickerid, res1, expression=logtransform ? math.log(close[mhshift]) : close[mhshift])

fma = ta.ema(mha_close[test], fama)
sma = ta.ema(ha_close[slomas], sloma)

plot(showplots ? (logtransform ? math.exp(fma) : fma) : na, title="MA", color=color.new(color.blue, 0), linewidth=2, style=plot.style_line)
plot(showplots ? (logtransform ? math.exp(sma) : sma) : na, title="SMA", color=color.new(color.orange, 0), linewidth=2, style=plot.style_line)

golong = ta.crossover(fma, sma)
exitLong = ta.crossunder(fma, sma)

if (golong)
    strategy.entry("Buy", strategy.long)

if (exitLong)
    strategy.close("Buy")
Published by ChaoZhang on the FMZ strategy square · last modified 2024-01-03. Collected in the Quant Trading Vault. Unvalidated research: re-test with your own data and costs before trusting it.
Build this with AgenKit
A spec is not a trading system. Paste this into your coding agent and AgenKit runs a specialist team — architecture, test-first build, risk gates, review — with paper trading on by default.
/agenkit build a production-grade trading bot with a backtest engine, risk controls and paper trading by default from strategies/Heyping-Moving-Average-Trend-Strategy.md- npx agenkit install engineering-kit in your project
- Paste the command into your agent and approve each phase
- Get tests, backtest, risk controls and a paper-trading switch
Understand it first
Before you run this, read the lesson behind the idea and how to backtest it honestly. Specs like this one are the survivors of an unknown number of trials; deflate their results accordingly.
Related specs
- Volatility Trend Tracking StrategyPine Script · Trend following · 1h
- DPO EMA Trend Crossover Quantitative Strategy ResearchPine Script · Trend following · 1d
- Dynamic ATR Trailing Stop with EMA Cross Combination StrategyPine Script · Trend following · 2h
- Dynamic Moving Average Tracking Strategy 433137Pine Script · Trend following · 1d
- Multi Moving Average Crossover Trading StrategyPine Script · Trend following · 1d
- SuperTrend Trailing Stop Strategy Based on Heikin AshiPine Script · Trend following · 4h