Strategy vault / Multi-timeframe
High Frequency Quantitative Multi Timeframe Heatmap Sniper Strategy
This is a high-frequency quantitative trading strategy based on heatmap and multi-timeframe trend analysis. The strategy achieves precise market entry timing by combining heatmap support/resistance zones, weekly and…
Overview
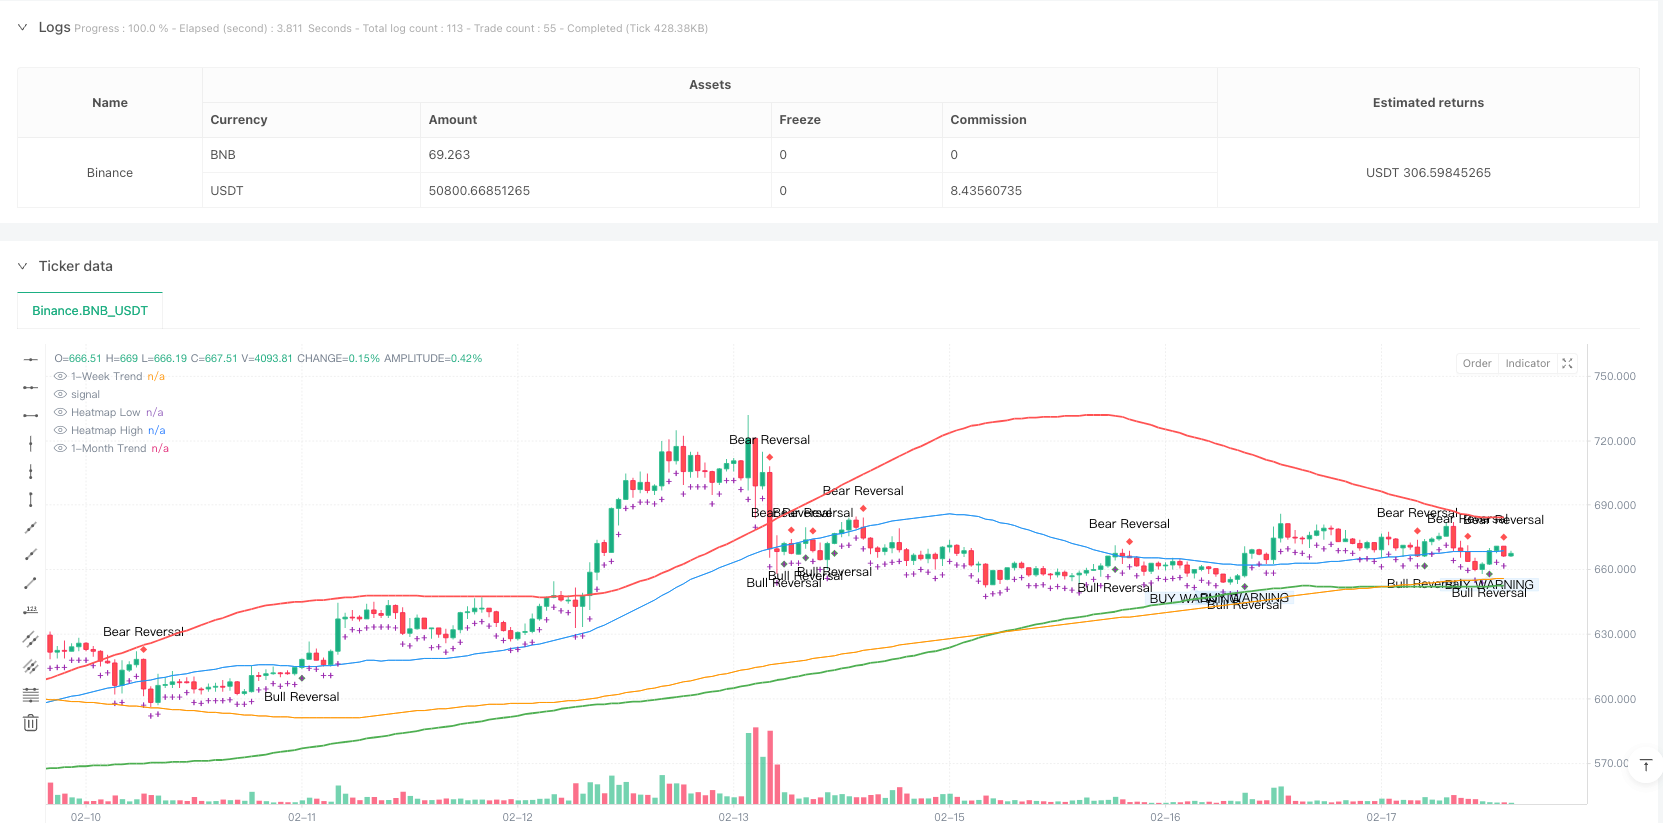
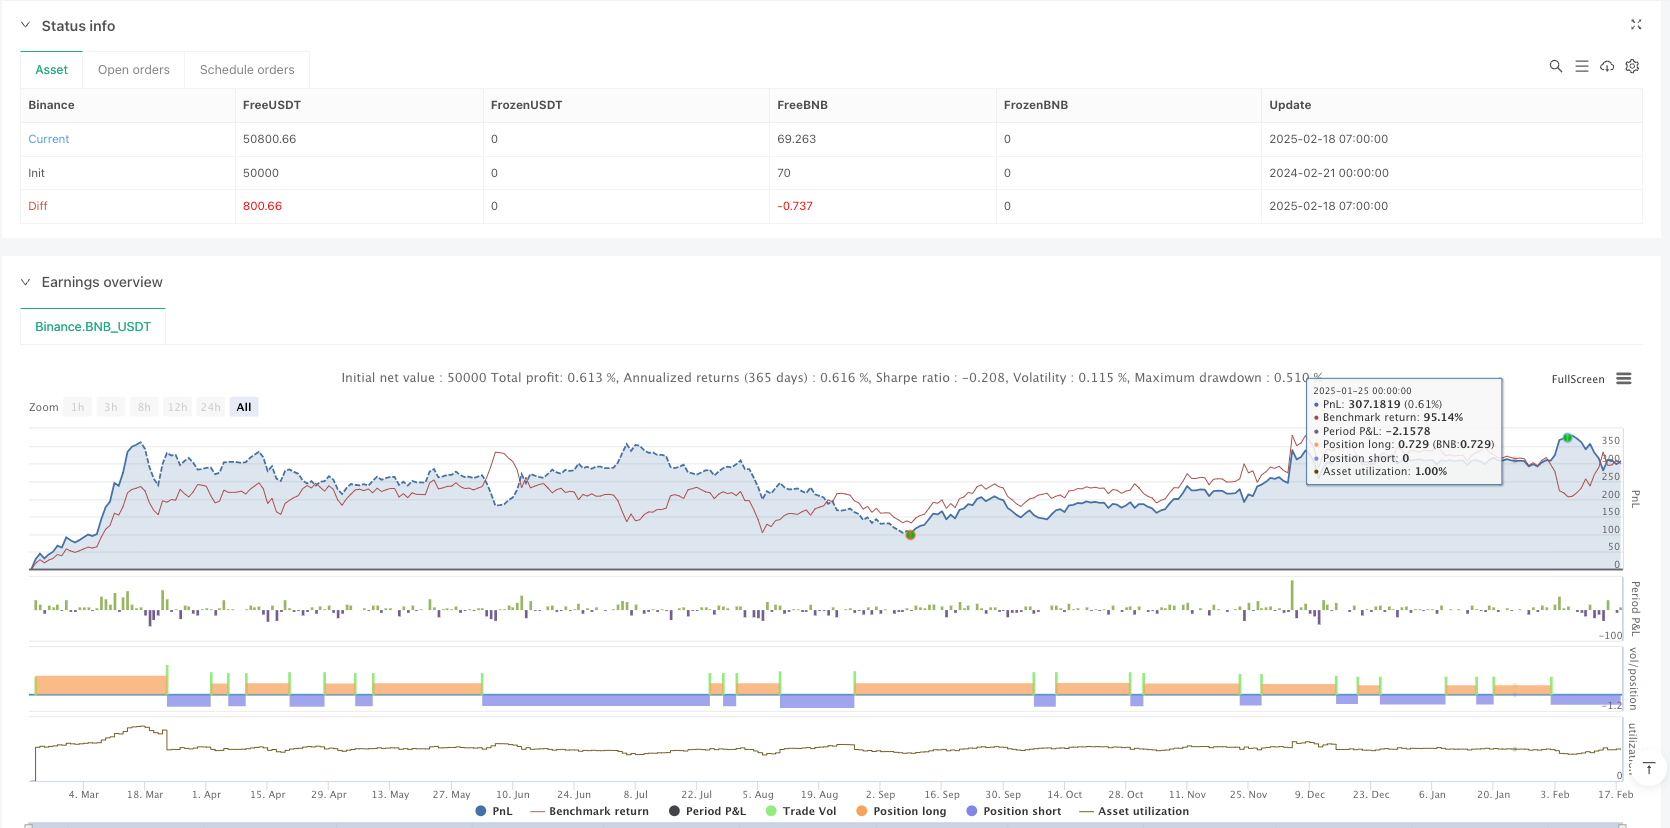
This is a high-frequency quantitative trading strategy based on heatmap and multi-timeframe trend analysis. The strategy achieves precise market entry timing by combining heatmap support/resistance zones, weekly and monthly moving averages, and an early warning signal system. The core lies in identifying key price areas through heatmap technology and using multi-timeframe trend confirmation to improve trading accuracy.
Strategy Principles
The strategy is based on several core components:
- Heatmap Trading Zones: Calculate support and resistance levels using moving averages of highs and lows to form trading heatmaps.
- Multi-timeframe Trend Confirmation: Use weekly and monthly moving averages to judge market trends.
- Early Warning Signal System: Provide warnings before actual trade signals to help traders prepare.
- Trend Projection Trail: Show potential price movement direction through purple cross markers.
- Bull and Bear Reversal Indicators: Display potential trend reversal points through diamond-shaped markers.
Strategy Advantages
- Multi-dimensional Analysis: Combines heatmap, trend, and reversal signals for comprehensive market insights.
- Warning Mechanism: Provides early warnings through warning bubbles to avoid hasty decisions.
- Adaptability: Can operate across multiple timeframes, adapting to different trading styles.
- Visualization: Clear visual indicator system for quick decision making.
- Risk Control: Reduces false signal risk through multiple confirmation mechanisms.
Strategy Risks
- Market Volatility Risk: May generate false signals during high volatility periods.
- Parameter Sensitivity: Strategy performance heavily depends on heatmap sensitivity and moving average period selection.
- Slippage Risk: High-frequency trading may face significant slippage.
- Trading Costs: Frequent trading may incur high transaction costs.
- Market Environment Dependency: Strategy may not perform well in certain market conditions.
Strategy Optimization Directions
- Dynamic Parameter Adjustment: Introduce adaptive parameter system to adjust heatmap sensitivity based on market volatility.
- Signal Filtering: Add volume and volatility filters to reduce false signals.
- Risk Management: Incorporate dynamic stop-loss and profit target management system.
- Market Environment Recognition: Develop market environment recognition module to automatically stop trading in unsuitable conditions.
- Machine Learning Optimization: Introduce machine learning algorithms to optimize parameter selection and signal confirmation.
Summary
The High-Frequency Quantitative Multi-Timeframe Heatmap Sniper Strategy is a comprehensive trading system integrating multiple technical indicators. Through the combination of heatmap analysis, multi-timeframe trend confirmation, and warning mechanisms, it provides traders with a reliable decision support tool. The strategy's success depends on correct parameter settings and market environment selection, and it is recommended to conduct thorough backtesting and optimization before live trading. Through continuous improvement and optimization, this strategy has the potential to maintain stable performance across various market conditions.
Source Pine Script
/*backtest
start: 2024-02-21 00:00:00
end: 2025-02-18 08:00:00
period: 1h
basePeriod: 1h
exchanges: [{"eid":"Binance","currency":"BNB_USDT"}]
*/

//@version=6
strategy("Ultimate Heatmap Sniper Bot", overlay=true, default_qty_type=strategy.percent_of_equity, default_qty_value=1)

// Input Parameters
sensitivity = input(50, title="Heatmap Sensitivity")
weekMA = input(50, title="1-Week Moving Average Length")
monthMA = input(200, title="1-Month Moving Average Length")
lookback = input(50, title="Heatmap Lookback")
tradeFrequency = input(6, title="Max Trades Per Day")

// Calculate Heatmap Highs & Lows
highs = ta.highest(high, lookback)
lows = ta.lowest(low, lookback)
heatmapLow = ta.sma(lows, sensitivity)
heatmapHigh = ta.sma(highs, sensitivity)

// Trend Confirmation using Higher Timeframes
weekTrend = ta.sma(close, weekMA)
monthTrend = ta.sma(close, monthMA)
trendDirection = weekTrend > monthTrend ? 1 : -1

// Reversal Signals
bullishReversal = ta.crossover(close, weekTrend)
bearishReversal = ta.crossunder(close, weekTrend)

// Entry Conditions
longEntry = ta.crossover(close, heatmapLow) and trendDirection == 1
shortEntry = ta.crossunder(close, heatmapHigh) and trendDirection == -1

// Execute Trades
if (longEntry)
    strategy.entry("Sniper Long", strategy.long)
if (shortEntry)
    strategy.entry("Sniper Short", strategy.short)

// Visualization
plot(heatmapLow, color=color.green, linewidth=2, title="Heatmap Low")
plot(heatmapHigh, color=color.red, linewidth=2, title="Heatmap High")
plot(weekTrend, color=color.blue, linewidth=1, title="1-Week Trend")
plot(monthTrend, color=color.orange, linewidth=1, title="1-Month Trend")

// Mark Trades on Chart
plotshape(series=longEntry, location=location.belowbar, color=color.green, style=shape.labelup, title="BUY Signal", text="BUY")
plotshape(series=shortEntry, location=location.abovebar, color=color.red, style=shape.labeldown, title="SELL Signal", text="SELL")

// Warning Bubble Before Execution
preLongWarning = ta.crossover(close, heatmapLow * 1.02) and trendDirection == 1
preShortWarning = ta.crossunder(close, heatmapHigh * 0.98) and trendDirection == -1
plotshape(series=preLongWarning, location=location.belowbar, color=color.new(color.blue, 90), style=shape.labelup, title="BUY WARNING", text="BUY WARNING")
plotshape(series=preShortWarning, location=location.abovebar, color=color.orange, style=shape.labeldown, title="SELL WARNING", text="SELL WARNING")

// Reversal Indicators with Diamonds
plotshape(series=bullishReversal, location=location.belowbar, color=color.green, style=shape.diamond, title="Bullish Reversal", text="Bull Reversal")
plotshape(series=bearishReversal, location=location.abovebar, color=color.red, style=shape.diamond, title="Bearish Reversal", text="Bear Reversal")

// Sparkle Trail Projection
projectedMove = (heatmapHigh + heatmapLow) / 2
plotshape(series=projectedMove, location=location.belowbar, color=color.purple, style=shape.cross, title="Projected Move Cross")
Published by ianzeng123 on the FMZ strategy square · last modified 2025-02-20. Collected in the Quant Trading Vault. Unvalidated research: re-test with your own data and costs before trusting it.
Build this with AgenKit
A spec is not a trading system. Paste this into your coding agent and AgenKit runs a specialist team — architecture, test-first build, risk gates, review — with paper trading on by default.
/agenkit build a production-grade trading bot with a backtest engine, risk controls and paper trading by default from strategies/High-Frequency-Quantitative-Multi-Timeframe-Heatmap-Sniper-Strategy.md- npx agenkit install engineering-kit in your project
- Paste the command into your agent and approve each phase
- Get tests, backtest, risk controls and a paper-trading switch
Understand it first
Before you run this, read the lesson behind the idea and how to backtest it honestly. Specs like this one are the survivors of an unknown number of trials; deflate their results accordingly.
Related specs
- Multi Timeframe Smart Money Concept Support and Resistance Dynamic Trading StrategyPine Script · Multi-timeframe · 2d
- Advanced Multi Timeframe Ichimoku Cloud Trading Strategy with Dynamic Multidimensional AnalysisPine Script · Multi-timeframe · 2h
- Multi Timeframe MACD Moving Average Trading StrategyPine Script · Multi-timeframe · 3h
- Multi Timeframe MACD Trading StrategyPine Script · Multi-timeframe · 1h
- Adaptive Multi Timeframe Fibonacci Retracement Trading StrategyPine Script · Multi-timeframe · 1m
- EMA RSI and MACD Based Multi Timeframe Trading StrategyPine Script · Multi-timeframe · 1h