Strategy vault / Trend following
High Low Breaker Backtest Strategy
The High Low Breaker Backtest strategy is a trend-following strategy that uses the historical highs and lows of a stock to determine if the price breaks out of these high-low ranges. It calculates the highest price…
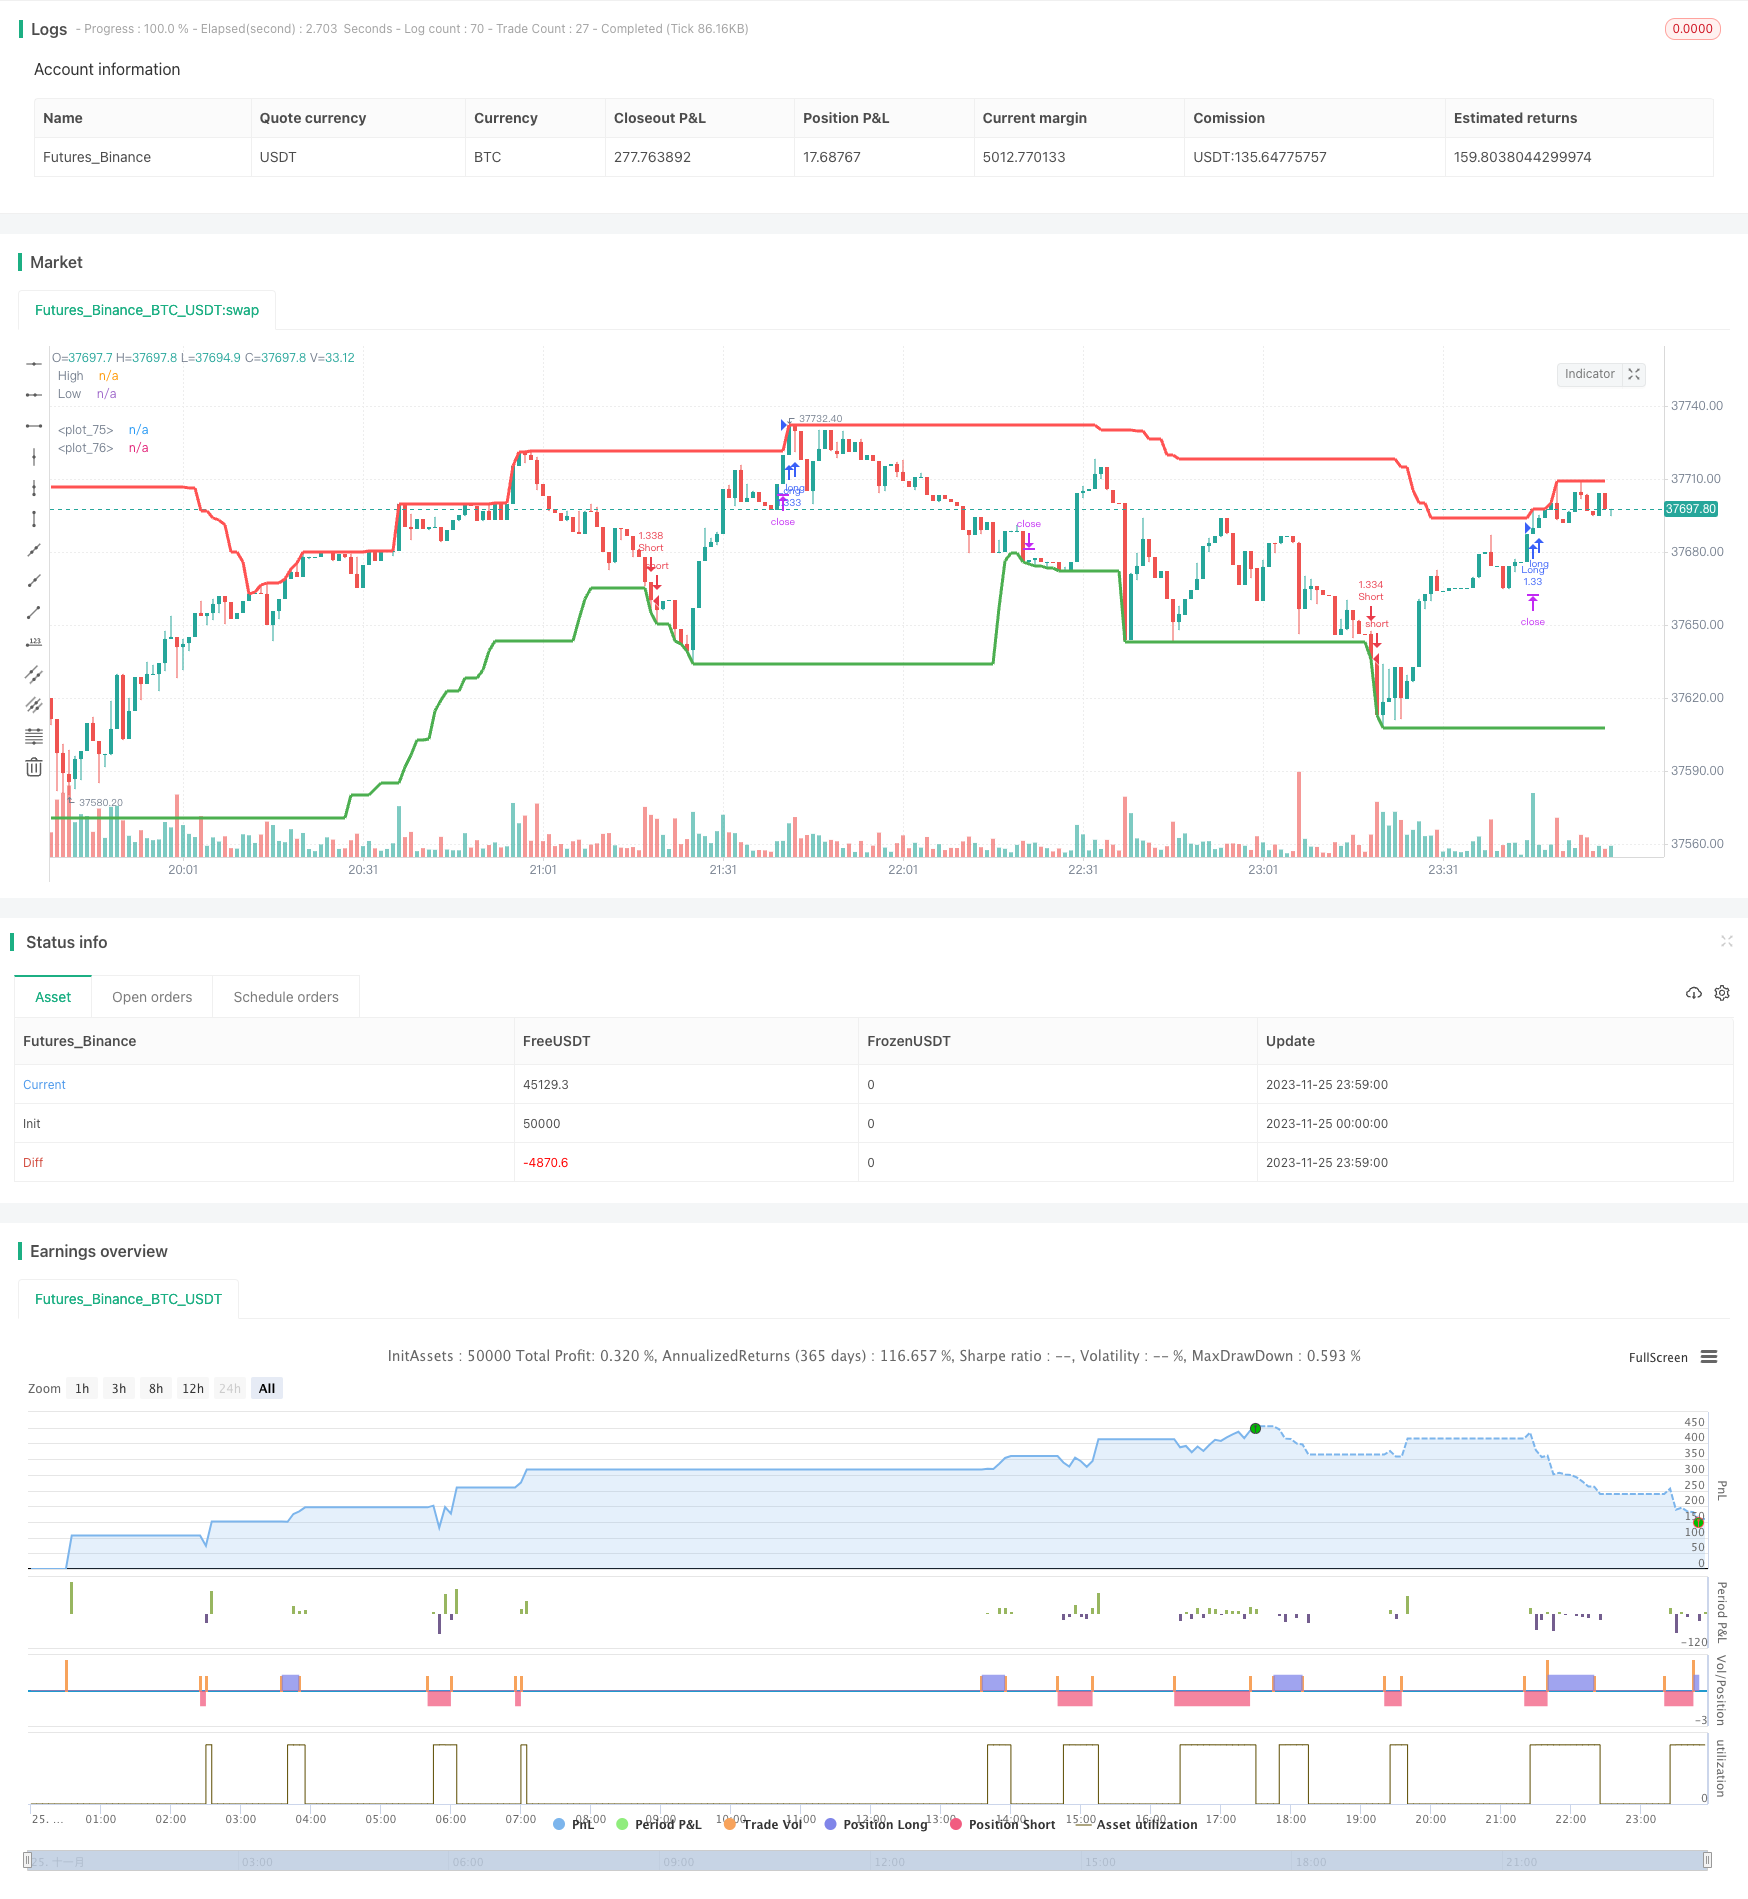
Overview
The High Low Breaker Backtest strategy is a trend-following strategy that uses the historical highs and lows of a stock to determine if the price breaks out of these high-low ranges. It calculates the highest price and lowest price over a certain period, and generates buy signals when the current period's price exceeds the highest price over a recent period, and sell signals when the price breaks below the lowest price over a recent period. As a type of trend-following strategy, it can capture some trending characteristics of stock prices and has practical value for live trading.
Strategy Logic
The core logic of this strategy is to calculate the highest price and lowest price over a certain number of bars (default 50 bars). When calculating highest/lowest prices, it allows using close prices or actual high/low prices (default to use high/low prices). Then it checks if the current bar's closing price or high price exceeds the highest price over the recent period. If yes and it's been more than a minimum number of bars (default 30 bars) since the last highest price bar, it generates a buy signal. Likewise, if the current bar's closing price or low price breaks the lowest price over the recent period and a minimum number of bars passed since last lowest price bar, it generates a sell signal.
Upon generating buy signals, the strategy enters long positions at that price, with a stop loss price and take profit price set. It exits the position with a stop loss when stop loss price is touched, and exits with a take profit when take profit price is touched. The logic for sell signals is similar.
Advantage Analysis
This high low breaker backtest strategy has the following advantages:
- The logic is simple and easy to understand/implement.
- It can capture some trending characteristics of stock prices.
- Parameters can be optimized to find best parameter combinations.
- Built-in stop loss and take profit controls risk.
- Visualizations greatly facilitate parameter tuning and results analysis.
Risk Analysis
This strategy also has some risks:
- Prone to multiple flip-flop trades and over-trading.
- Frequent position opening when price oscillates.
- Missing major trend opportunities if parameters not properly set.
- Not considering price fluctuations frequency and magnitude.
- No signal validation with other indicators.
The following aspects can help mitigate these risks:
- Reduce stop loss distance to increase holding time.
- Add more entry criteria to avoid frequent entries.
- Optimize parameters to find optimum combinations.
- Add filter conditions with other indicators.
Optimization Directions
This strategy can be improved in the following ways:
- Parameter optimization using more systematic testing.
- Add signal filters with other indicators e.g. moving averages.
- Consider price volatility using ATR to adapt breakout thresholds.
- Differentiate trending vs oscillating markets to adapt parameters.
- Enhance position sizing rules e.g. stop opening new positions after significant loss.
Summary
In summary, the High Low Breaker Backtest Strategy is a simple and practical trend-following strategy. It generates trading signals based on price breaking periodic highest/lowest prices. The strategy has advantages like simplicity, trend-following, and parameter optimizability, but also risks like over-trading and inability to handle oscillating markets. Further optimizations can be done around parameters, signal filters, position sizing etc. to improve its performance.
Parameters
| Name | Default | What it controls |
|---|---|---|
| v_input_1 | 0.1 | Take Profit Percentage Long |
| v_input_2 | 0.15 | Stop Loss Percentage Long |
| v_input_3 | 0.1 | Take Profit Percentage Short |
| v_input_4 | 0.15 | Stop Loss Percentage Short |
| v_input_5 | 50 | Number of candles back |
| v_input_6 | true | Use high and lows (uncheck to use close) |
| v_input_7 | 30 | Number of candles back to ignore for last high/low |
| v_input_8 | true | Show high/low lines |
Source Pine Script
/*backtest
start: 2023-11-25 00:00:00
end: 2023-11-26 00:00:00
period: 1m
basePeriod: 1m
exchanges: [{"eid":"Futures_Binance","currency":"BTC_USDT"}]
*/

//@version=3
strategy("High/Low Breaker Backtest 1.0", overlay=true, initial_capital=1000, default_qty_type=strategy.percent_of_equity, default_qty_value=100, max_bars_back=700)

// Strategy Settings
takeProfitPercentageLong = input(.1, title='Take Profit Percentage Long', type=float)/100
stopLossPercentageLong = input(0.15, title='Stop Loss Percentage Long', type=float)/100
takeProfitPercentageShort = input(.1, title='Take Profit Percentage Short', type=float)/100
stopLossPercentageShort = input(0.15, title='Stop Loss Percentage Short', type=float)/100


candlesBack = input(title="Number of candles back",  defval=50)
useHighAndLows =  input(true, title="Use high and lows (uncheck to use close)", defval=true)
lastBarsBackMinimum =  input(title="Number of candles back to ignore for last high/low",  defval=30)
showHighsAndLows = input(true, title="Show high/low lines", defval=true)

getIndexOfLowestInSeries(series, period) =>
    index = 0
    current = series
    for i = 1 to period
        if series[i] <= current
            index := i
            current := series[i]
    index

getIndexOfHighestInSeries(series, period) =>
    index = 0
    current = series
    for i = 1 to period
        if series[i] >= current
            index := i
            current := series[i]
    index

indexOfHighestInRange = getIndexOfHighestInSeries(useHighAndLows ? high : close, candlesBack)
indexOfLowestInRange = getIndexOfLowestInSeries(useHighAndLows ? low : close, candlesBack)

max = useHighAndLows ? high[indexOfHighestInRange] : close[indexOfHighestInRange]
min = useHighAndLows ? low[indexOfLowestInRange] : close[indexOfLowestInRange]

barsSinceLastHigh = indexOfHighestInRange
barsSinceLastLow = indexOfLowestInRange

isNewHigh = (useHighAndLows ? high > max[1] : close > max[1]) and (barsSinceLastHigh[1] + 1 > lastBarsBackMinimum)
isNewLow = (useHighAndLows ? low < min[1] : close < min[1]) and (barsSinceLastLow[1] + 1 > lastBarsBackMinimum)

alertcondition(condition=isNewHigh, title="New High", message="Last High Broken")
alertcondition(condition=isNewLow, title="New Low", message="Last Low Broken")

if high > max
    max := high
    barsSinceLastHigh := 0

if low < min
    min := low
    barsSinceLastLow := 0

plot( showHighsAndLows ? max : na, color=red, style=line, title="High", linewidth=3)
plot( showHighsAndLows ? min : na, color=green, style=line, title="Low", linewidth=3)

// Strategy Entry/Exit Logic
goLong =isNewHigh
longStopLevel = strategy.position_avg_price * (1 - stopLossPercentageLong)
longTakeProfitLevel = strategy.position_avg_price * (1 + takeProfitPercentageLong)

goShort = isNewLow
shortStopLevel = strategy.position_avg_price * (1 + stopLossPercentageShort)
shortTakeProfitLevel = strategy.position_avg_price * (1 - takeProfitPercentageShort)

strategy.entry("Long", strategy.long, when=goLong)
strategy.exit("Long Exit", "Long", stop=longStopLevel, limit=longTakeProfitLevel)

strategy.entry("Short", strategy.short, when=goShort)
strategy.exit("Short Exit", "Short", stop=shortStopLevel, limit=shortTakeProfitLevel)

plot(goShort ? shortStopLevel : na, color=yellow, style=linebr, linewidth=2)
plot(goShort ? shortTakeProfitLevel : na, color=blue, style=linebr, linewidth=2)
plot(goLong ? longStopLevel : na, color=yellow, style=linebr, linewidth=2)
plot(goLong ? longTakeProfitLevel : na, color=blue, style=linebr, linewidth=2)
Published by ChaoZhang on the FMZ strategy square · last modified 2023-11-27. Collected in the Quant Trading Vault. Unvalidated research: re-test with your own data and costs before trusting it.
Build this with AgenKit
A spec is not a trading system. Paste this into your coding agent and AgenKit runs a specialist team — architecture, test-first build, risk gates, review — with paper trading on by default.
/agenkit build a production-grade trading bot with a backtest engine, risk controls and paper trading by default from strategies/High-Low-Breaker-Backtest-Strategy.md- npx agenkit install engineering-kit in your project
- Paste the command into your agent and approve each phase
- Get tests, backtest, risk controls and a paper-trading switch
Understand it first
Before you run this, read the lesson behind the idea and how to backtest it honestly. Specs like this one are the survivors of an unknown number of trials; deflate their results accordingly.
Related specs
- 200 EMA VWAP MFI Trend Following StrategyPine Script · Trend following · 1d
- 4 EMA Trend StrategyPine Script · Trend following · 1d
- ADX MA and EMA Long Only Trend Tracking StrategyPine Script · Trend following · 1d
- ATR Dynamic Profit Target and Stop Loss StrategyPine Script · Trend following · 1d
- ATR Dynamic Trend Following and EMA Crossover Trading StrategyPine Script · Trend following · 1d
- ATR and Moving Average Crossover Hybrid StrategyPine Script · Trend following · 1h