High Probability Breakthrough Trading Strategy Based on Pressure Balance
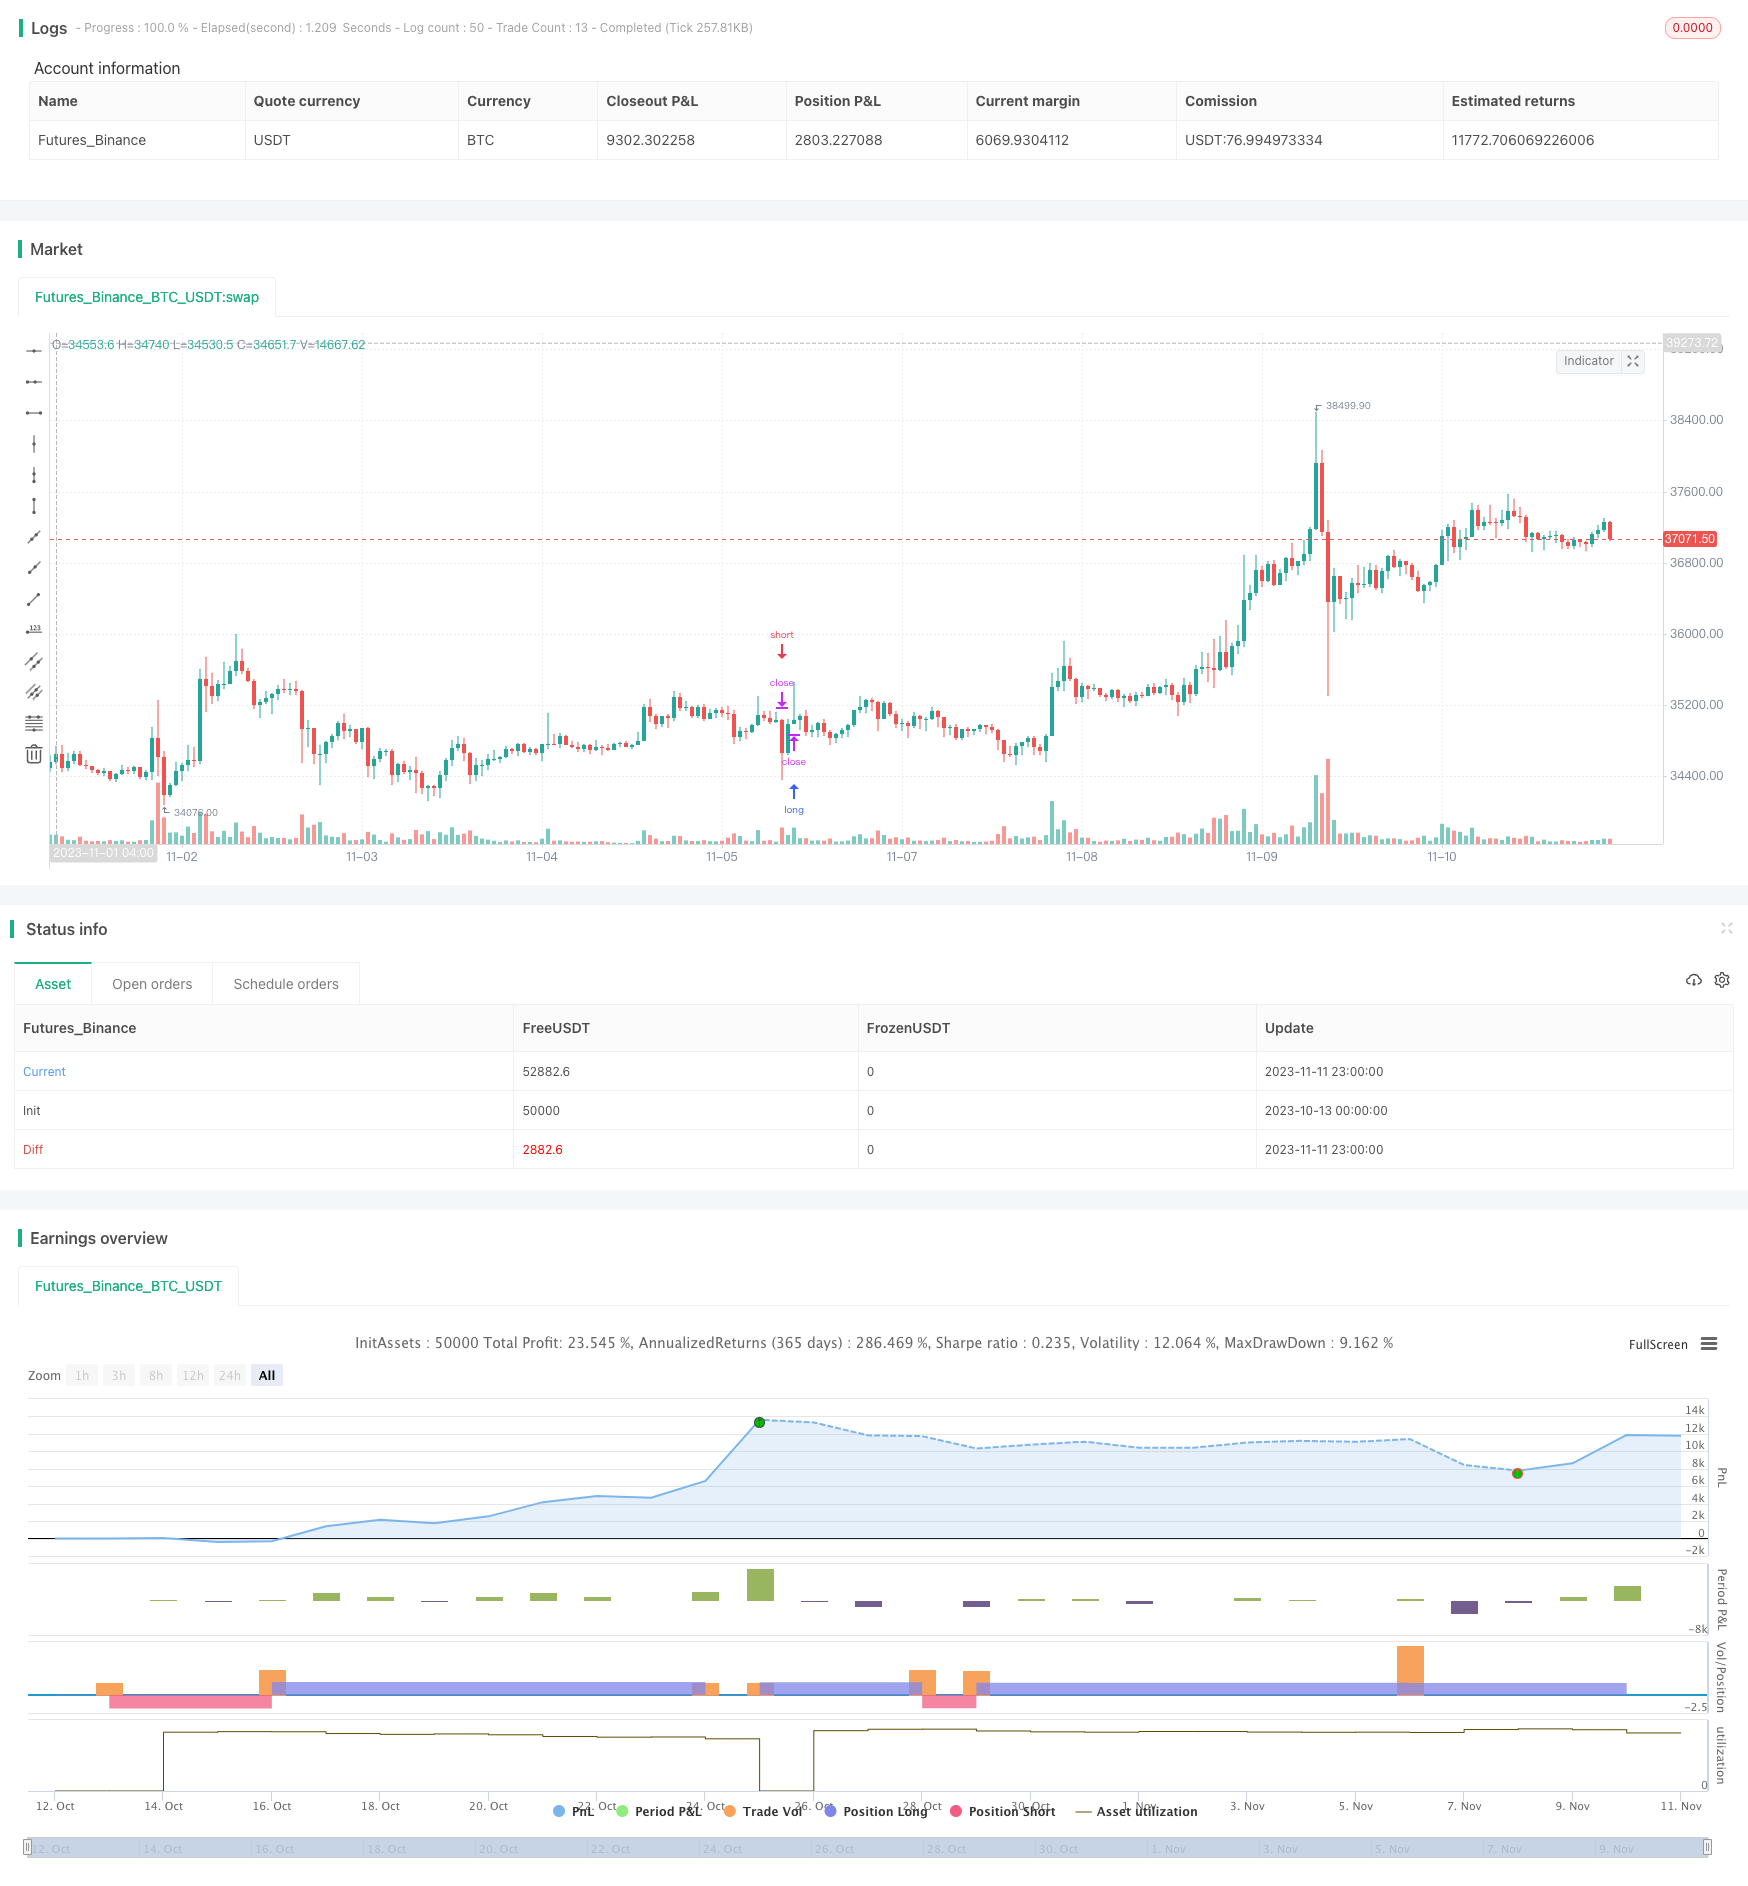
This strategy uses a combination of multiple indicators to determine the trend direction and trading opportunities, adopting a pressure balance approach to increase the winning rate of trades. It mainly utilizes…
Overview
This strategy uses a combination of multiple indicators to determine the trend direction and trading opportunities, adopting a pressure balance approach to increase the winning rate of trades. It mainly utilizes MACD, PSAR and EMA indicators for judgement, and implements stop loss and take profit to achieve effective profitability.
Strategy Logic
Use EMA to calculate moving average to determine the overall trend direction. Larger EMA value indicates an uptrend, while smaller EMA value indicates a downtrend.
Use MACD to calculate the difference between fast and slow moving averages. When the difference is greater than 0, it indicates an uptrend, when less than 0, it indicates a downtrend.
Use PSAR to calculate the continuous varying point. When PSAR value is large, it indicates a downtrend, when PSAR value is small, it indicates an uptrend.
Combine the above three indicators to determine consistency of the trend. When the judgments of the three indicators are consistent, it represents a clear trend that allows entry trades.
Enter trades based on buy and sell criteria, and set stop loss and take profit points. Exit trades when stop loss or take profit conditions are met to realize profits.
Specific rules are:
- Buy condition: not in uptrend, MACD histogram < 0, close price > EMA
- Sell condition: in uptrend, MACD histogram > 0, close price < EMA
- Stop loss condition: price hits next PSAR value
- Take profit condition: reaching preset take profit ratio
Advantages of the Strategy
Using multiple indicators to determine the trend improves accuracy.
Opening trades based on definite trends identified through pressure balance increases winning rate.
Setting stop loss and take profit can limit losses and lock in profits.
Clear and systematic trading rules make it suitable for algorithm trading.
Parameters can be optimized to adapt to different products and timeframes.
Risks of the Strategy
Trend judgement may be wrong, resulting in incorrect trade direction.
Extreme market moves may generate false signals from the indicators.
Stop loss being set too wide, unable to exit timely.
Improper parameter tuning leads to over-trading or missing trades.
Illiquid products cannot fulfill stop loss and take profit plans.
Risks can be reduced by optimizing parameters, adjusting stops, and selecting liquid products.
Optimization Directions
Adjust EMA period to optimize trend accuracy.
Tune MACD fast and slow period to improve sensitivity.
Optimize stop loss and take profit ratios to find ideal balance.
Add other auxiliary indicators to improve entry timing.
Select products with good liquidity and large swings.
Adjust timeframes to suit different product characteristics.
Summary
This strategy integrates multiple indicators for trend analysis and enters trades based on definite trends, with preset stop loss and take profit, which can effectively capture market moves and achieve good returns while ensuring certain profitability. Further improvements on stability and profitability can be achieved through parameter tuning and additional indicators. The clear trading rules make this strategy very suitable for algorithmic trading.
Parameters
| Name | Default | What it controls |
|---|---|---|
| v_input_1 | 60 | Length EMA |
| v_input_2_close | 0 | Source: close | high | low | open | hl2 | hlc3 | hlcc4 | ohlc4 |
| v_input_3 | 12 | Fast Length MACD |
| v_input_4 | 26 | Slow Length MACD |
| v_input_5 | 9 | Signal Smoothing |
| v_input_6 | 0 | Oscillator MA Type MACD: EMA | SMA |
| v_input_7 | 0 | Signal Line MA Type MACD: EMA | SMA |
| v_input_8 | 0.02 | start |
| v_input_9 | 0.02 | increment |
| v_input_10 | 0.2 | maximum |
| v_input_11 | 0.245 | tplong |
| v_input_12 | true | sllong |
| v_input_13 | 0.055 | tpshort |
| v_input_14 | 0.03 | slshort |
Source Pine Script
/*backtest
start: 2023-10-13 00:00:00
end: 2023-11-12 00:00:00
period: 1h
basePeriod: 15m
exchanges: [{"eid":"Futures_Binance","currency":"BTC_USDT"}]
*/

// This source code is subject to the terms of the Mozilla Public License 2.0 at https://mozilla.org/MPL/2.0/
// © exlux99

//@version=4
strategy(title = "Crypto Scalper", overlay = true,  pyramiding=1,initial_capital = 100, default_qty_type= strategy.percent_of_equity, default_qty_value = 100, calc_on_order_fills=false, slippage=0,commission_type=strategy.commission.percent,commission_value=0.03)
len = input(60, minval=1, title="Length EMA")
src = input(close, title="Source")
out = ema(src, len)
//
fast_length = input(title="Fast Length MACD", type=input.integer, defval=12)
slow_length = input(title="Slow Length MACD", type=input.integer, defval=26)
signal_length = input(title="Signal Smoothing", type=input.integer, minval = 1, maxval = 50, defval = 9)
sma_source = input(title="Oscillator MA Type MACD", type=input.string, defval="EMA", options=["SMA", "EMA"])
sma_signal = input(title="Signal Line MA Type MACD", type=input.string, defval="EMA", options=["SMA", "EMA"])

// Calculating
fast_ma = sma_source == "SMA" ? sma(src, fast_length) : ema(src, fast_length)
slow_ma = sma_source == "SMA" ? sma(src, slow_length) : ema(src, slow_length)
macd = fast_ma - slow_ma
signal = sma_signal == "SMA" ? sma(macd, signal_length) : ema(macd, signal_length)
hist = macd - signal


start = input(0.02)
increment = input(0.02)
maximum = input(0.2)
var bool uptrend = na
var float EP = na
var float SAR = na
var float AF = start
var float nextBarSAR = na
if bar_index > 0
	firstTrendBar = false
	SAR := nextBarSAR
	if bar_index == 1
		float prevSAR = na
		float prevEP = na
		lowPrev = low[1]
		highPrev = high[1]
		closeCur = close
		closePrev = close[1]
		if closeCur > closePrev
			uptrend := true
			EP := high
			prevSAR := lowPrev
			prevEP := high
		else
			uptrend := false
			EP := low
			prevSAR := highPrev
			prevEP := low
		firstTrendBar := true
		SAR := prevSAR + start * (prevEP - prevSAR)
	if uptrend
		if SAR > low
			firstTrendBar := true
			uptrend := false
			SAR := max(EP, high)
			EP := low
			AF := start
	else
		if SAR < high
			firstTrendBar := true
			uptrend := true
			SAR := min(EP, low)
			EP := high
			AF := start
	if not firstTrendBar
		if uptrend
			if high > EP
				EP := high
				AF := min(AF + increment, maximum)
		else
			if low < EP
				EP := low
				AF := min(AF + increment, maximum)
	if uptrend
		SAR := min(SAR, low[1])
		if bar_index > 1
			SAR := min(SAR, low[2])
	else
		SAR := max(SAR, high[1])
		if bar_index > 1
			SAR := max(SAR, high[2])
	nextBarSAR := SAR + AF * (EP - SAR)

tplong=input(0.245, step=0.005)
sllong=input(1.0, step=0.005)
tpshort=input(0.055, step=0.005)
slshort=input(0.03, step=0.005)

if (uptrend and hist >0 and close < out)
	strategy.entry("short", strategy.short, stop=nextBarSAR, comment="short")
	strategy.exit("short_tp/sl", "short", profit=close * tpshort / syminfo.mintick, loss=close * slshort / syminfo.mintick, comment='SHORT EXIT',  alert_message = 'closeshort')
if (not uptrend and hist <0 and close > out)
	strategy.entry("long", strategy.long, stop=nextBarSAR, comment="long")
	strategy.exit("short_tp/sl", "long", profit=close * tplong / syminfo.mintick, loss=close * sllong / syminfo.mintick, comment='LONG EXIT',  alert_message = 'closelong')
Published by ChaoZhang on the FMZ strategy square · last modified 2023-11-13. Collected in the Quant Trading Vault. Unvalidated research: re-test with your own data and costs before trusting it.
Build this with AgenKit
A spec is not a trading system. Paste this into your coding agent and AgenKit runs a specialist team — architecture, test-first build, risk gates, review — with paper trading on by default.
/agenkit build a production-grade trading bot with a backtest engine, risk controls and paper trading by default from strategies/High-Probability-Breakthrough-Trading-Strategy-Based-on-Pressure-Balance.md- npx agenkit install engineering-kit in your project
- Paste the command into your agent and approve each phase
- Get tests, backtest, risk controls and a paper-trading switch
Understand it first
Before you run this, read the lesson behind the idea and how to backtest it honestly. Specs like this one are the survivors of an unknown number of trials; deflate their results accordingly.
Related specs
- Quantitative Strategy PSARZigZagMACDART Based on Multi Indicator CombinationPine Script · Breakout · 1m
- Quantitative Trading Strategy Based on Ichimoku with Multiple SignalsPine Script · Breakout · 1h
- MACD Bollinger Turtle Trading StrategyPine Script · Breakout · 1d
- Multifactor Dynamic Money Management StrategyPine Script · Breakout · 10m
- Parabolic Stop and Reserve Multi Indicator Trading StrategyPine Script · Breakout · 45m
- Breakthrough Moving Average Trend Tracking StrategyPine Script · Breakout · 1h