Strategy vault / Trend following
Hull Moving Average Trend Following Strategy 430853
This strategy is based on the Hull Moving Average indicator to construct a trend following trading system. It decides to go long or go short based on the direction of the Hull curves, making it a typical trend…
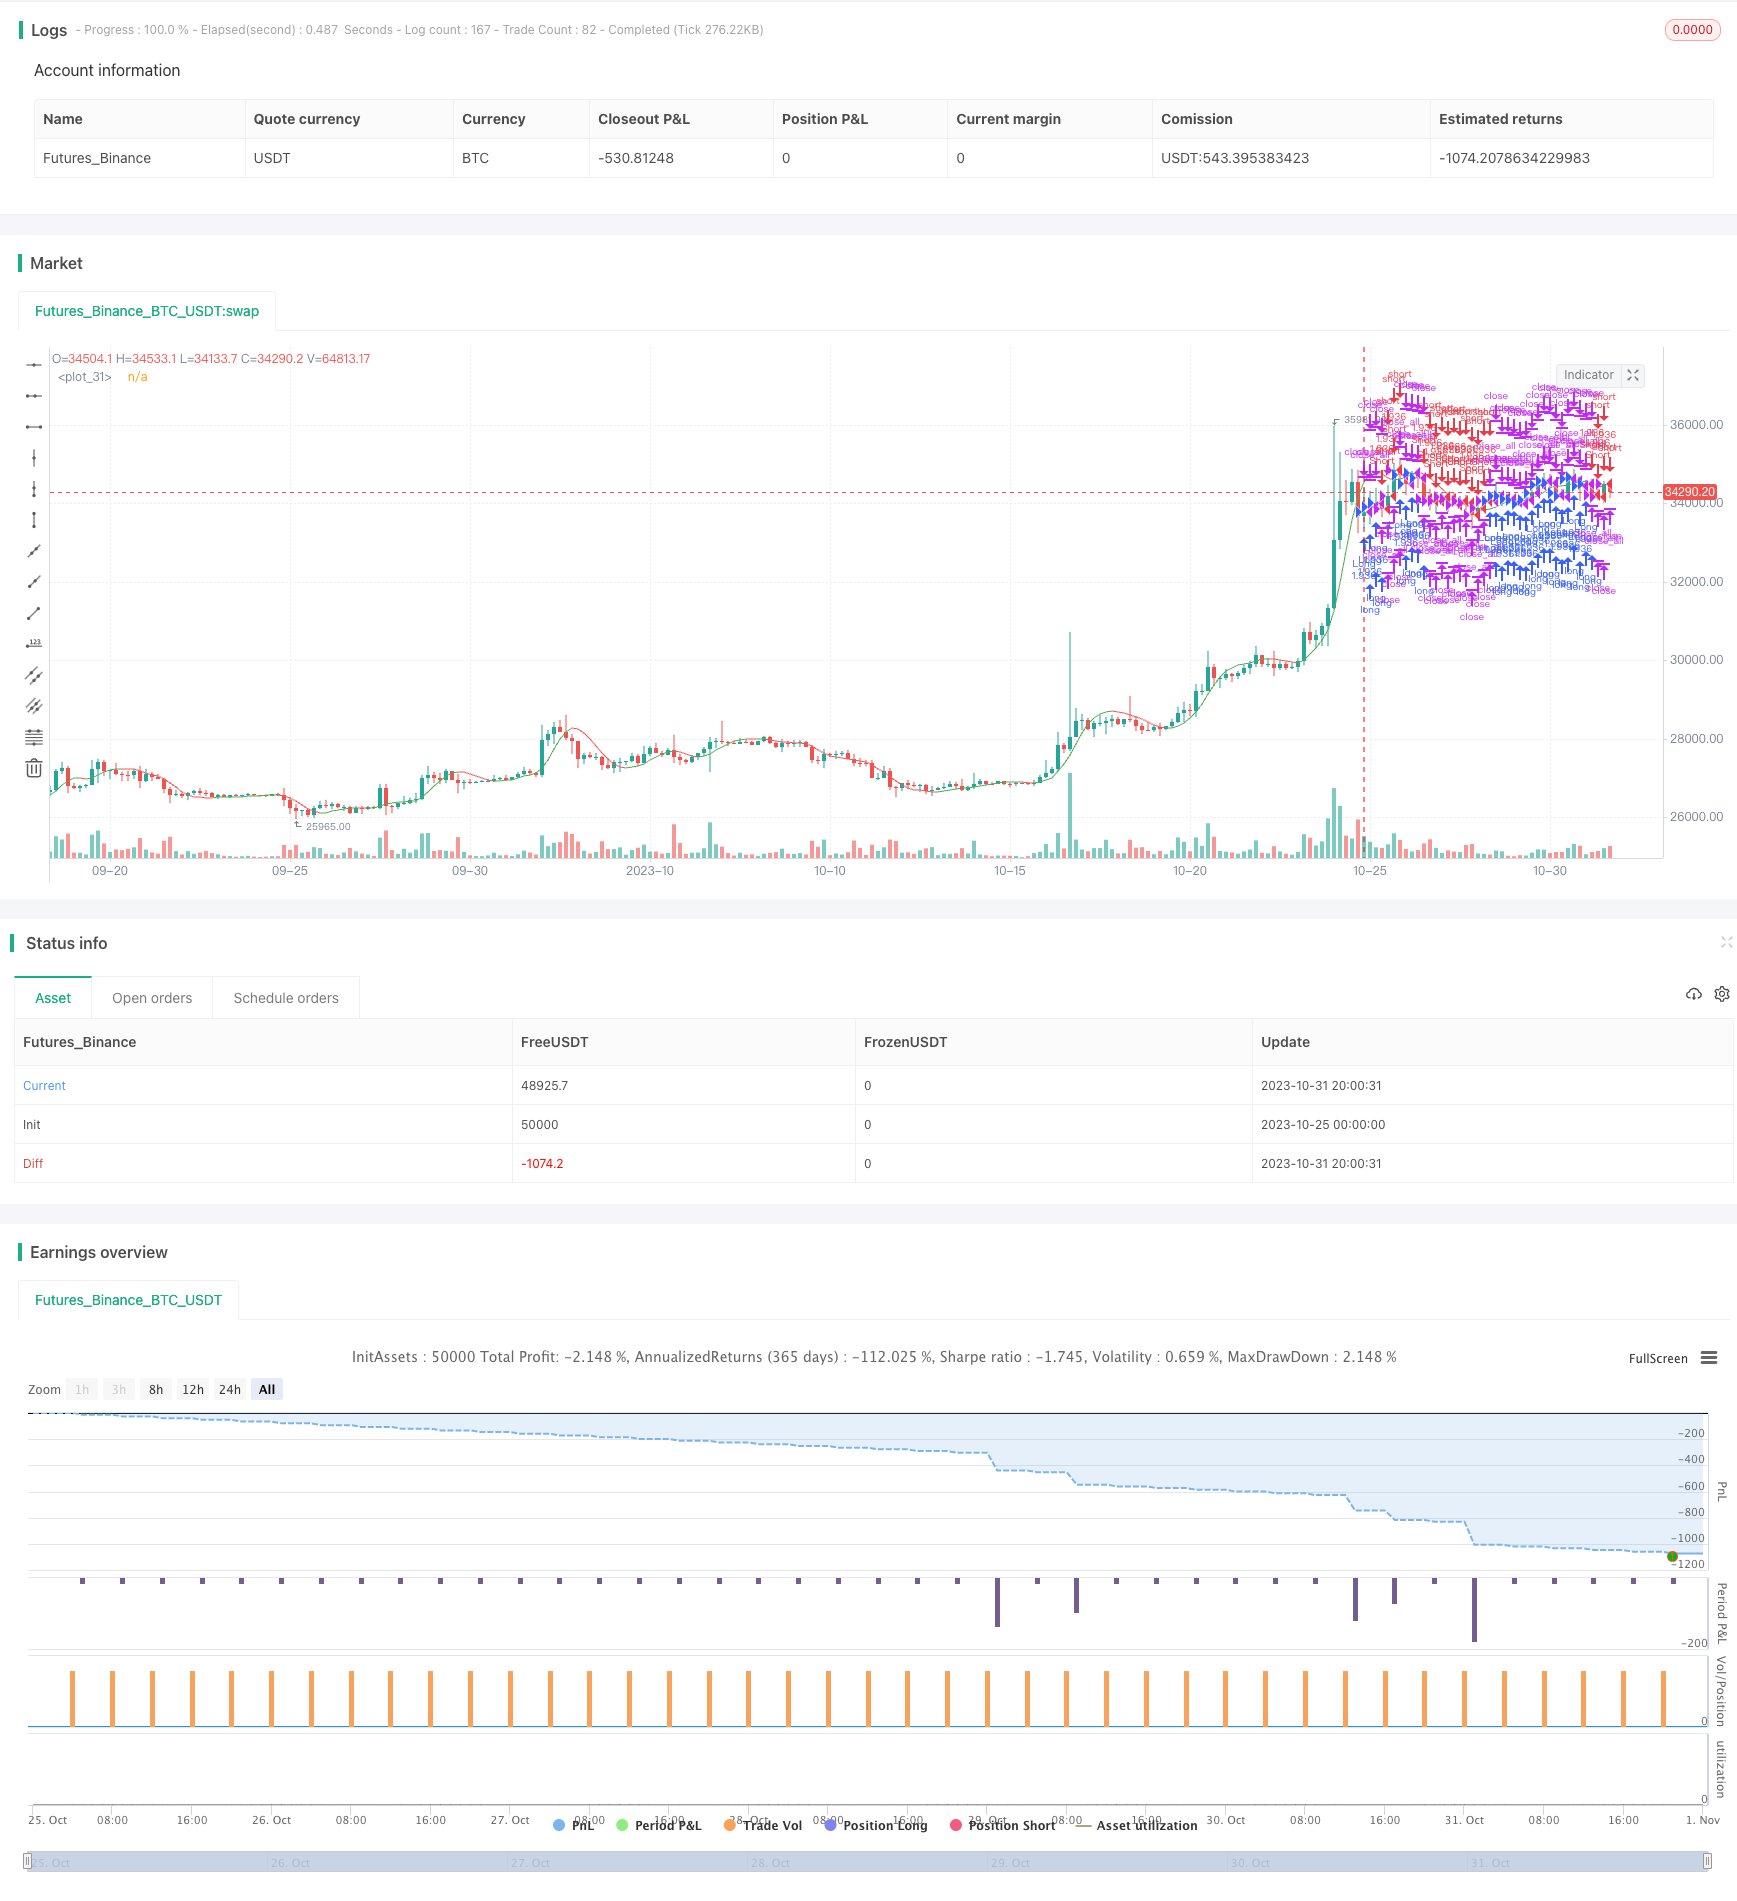
Overview
This strategy is based on the Hull Moving Average indicator to construct a trend following trading system. It decides to go long or go short based on the direction of the Hull curves, making it a typical trend chasing strategy.
Strategy Logic
This strategy uses the Hull Moving Average as the main technical indicator. The Hull Moving Average was proposed by American trader Alan Hull in 2005. It improves on moving averages by using a square root function to reduce lag.
Specifically, the Hull Moving Average contains two averages - one is the moving average MA(n) of period n, the other is the moving average MA(n/2) of period n/2. The difference between the two moving averages forms the Hull difference curve. Taking the moving average of the Hull difference curve itself gives the Hull curve.
When the Hull curve slopes up, the shorter period moving average crosses above the longer period one, giving a long signal. When the Hull curve slopes down, the shorter MA crosses below the longer MA, giving a short signal.
This strategy sets period n of the Hull curve to 16. It calculates the 8-period MA (n/2=8), the 16-period MA, and the difference between them to get the Hull curve. It then takes the 4-period MA (square root of n=4) of the Hull curve itself. When the Hull curve crosses up, it goes long. When the Hull curve crosses down, it goes short.
Advantage Analysis
Compared to ordinary moving averages, the Hull Moving Average has the following advantages:
Reduces lag. By using a square root function, the Hull curve hugs price action closer and is quicker to catch trend reversals.
Reduces false crosses. Traditional MAs tend to generate more false crosses. The Hull curve can filter out some noise and avoid unnecessary trades.
Fewer parameters. The Hull curve only needs one parameter n, making optimization easier. A dual-MA system needs to optimize two parameters.
Customizable. The n value of the Hull curve can be adjusted for different markets and customized to suit different instruments.
Systematic. The Hull system is robust and avoids manual selection, adhering to the consistency of mechanical trading systems.
Risk Analysis
Despite its advantages over moving average systems, the Hull system still carries the following risks:
Limitations of trend following itself. As a trend chasing strategy, Hull systems are prone to stop outs during drastic trend changes.
Potential for overtrading. The fast response of Hull curves may increase trade frequency and lead to overtrading.
Overoptimization of parameters. Having just one parameter n can lead to curve fitting risks from overoptimization.
Varying effectiveness across instruments. The Hull system works less well for instruments with high volatility. Parameters need to be adjusted accordingly.
Improvement Directions
Based on the limitations above, the Hull moving average strategy can be improved in the following aspects:
Add filters with additional indicators to avoid false crosses. MACD, KD etc. can help gauge the trend.
Add stop loss strategies to control single trade loss, e.g. with trailing stops or take profit stops.
Optimize parameter n selection to prevent overoptimization. Walk forward analysis can be used for rolling optimization.
Use machine learning models like RNNs to dynamically optimize parameter values.
Optimize parameters separately for different instruments using machine learning fitting.
Optimize position sizing to lower trade frequency. Fixed fractional position sizing can help.
Conclusion
The Hull Moving Average strategy is a typical trend following strategy. Despite its advantages over MAs, it still faces issues like overoptimization and overtrading. We can improve the strategy through parameter optimization, stop losses, position sizing etc. The Hull system is simple and practical. It deserves further research and enhancement by incorporating more indicators and techniques to build a robust trading system.
Parameters
| Name | Default | What it controls |
|---|---|---|
| v_input_1 | true | Long |
| v_input_2 | true | Short |
| v_input_3 | 100 | Capital, % |
| v_input_4 | 16 | HullMA period |
| v_input_5 | 1900 | From Year |
| v_input_6 | 2100 | To Year |
| v_input_7 | true | From Month |
| v_input_8 | 12 | To Month |
| v_input_9 | true | From day |
| v_input_10 | 31 | To day |
Source Pine Script
/*backtest
start: 2023-10-25 00:00:00
end: 2023-11-01 00:00:00
period: 4h
basePeriod: 15m
exchanges: [{"eid":"Futures_Binance","currency":"BTC_USDT"}]
*/

//Noro
//2018

//@version=3
strategy(title = "Noro's HullMA Strategy", shorttitle = "HullMA str", overlay = true, default_qty_type = strategy.percent_of_equity, default_qty_value = 100, pyramiding = 0)

//Settings
needlong = input(true, defval = true, title = "Long")
needshort = input(true, defval = true, title = "Short")
capital = input(100, defval = 100, minval = 1, maxval = 10000, title = "Capital, %")
n = input(title = "HullMA period", defval=16)
fromyear = input(1900, defval = 1900, minval = 1900, maxval = 2100, title = "From Year")
toyear = input(2100, defval = 2100, minval = 1900, maxval = 2100, title = "To Year")
frommonth = input(01, defval = 01, minval = 01, maxval = 12, title = "From Month")
tomonth = input(12, defval = 12, minval = 01, maxval = 12, title = "To Month")
fromday = input(01, defval = 01, minval = 01, maxval = 31, title = "From day")
today = input(31, defval = 31, minval = 01, maxval = 31, title = "To day")

//HullMA
n2ma=2*wma(close,round(n/2))
nma=wma(close,n)
diff=n2ma-nma
sqn=round(sqrt(n))
n2ma1=2*wma(close[1],round(n/2))
nma1=wma(close[1],n)
diff1=n2ma1-nma1
sqn1=round(sqrt(n))
n1=wma(diff,sqn)
n2=wma(diff1,sqn)
c=n1>n2?green:red
ma=plot(n1,color=c)

//Trading
lot = 0.0
lot := strategy.position_size != strategy.position_size[1] ? strategy.equity / close * capital / 100 : lot[1]
if n1 > n2
    strategy.entry("Long", strategy.long, needlong == false ? 0 : lot)
if n1 < n2
    strategy.entry("Short", strategy.short, needshort == false ? 0 : lot)
if true
    strategy.close_all()
Published by ChaoZhang on the FMZ strategy square · last modified 2023-12-01. Collected in the Quant Trading Vault. Unvalidated research: re-test with your own data and costs before trusting it.
Build this with AgenKit
A spec is not a trading system. Paste this into your coding agent and AgenKit runs a specialist team — architecture, test-first build, risk gates, review — with paper trading on by default.
/agenkit build a production-grade trading bot with a backtest engine, risk controls and paper trading by default from strategies/Hull-Moving-Average-Trend-Following-Strategy-430853.md- npx agenkit install engineering-kit in your project
- Paste the command into your agent and approve each phase
- Get tests, backtest, risk controls and a paper-trading switch
Understand it first
Before you run this, read the lesson behind the idea and how to backtest it honestly. Specs like this one are the survivors of an unknown number of trials; deflate their results accordingly.
Related specs
- 200 EMA VWAP MFI Trend Following StrategyPine Script · Trend following · 1d
- 4 EMA Trend StrategyPine Script · Trend following · 1d
- ADX MA and EMA Long Only Trend Tracking StrategyPine Script · Trend following · 1d
- ATR Dynamic Profit Target and Stop Loss StrategyPine Script · Trend following · 1d
- ATR Dynamic Trend Following and EMA Crossover Trading StrategyPine Script · Trend following · 1d
- ATR and Moving Average Crossover Hybrid StrategyPine Script · Trend following · 1h