Strategy vault / Mean reversion
HYE Mean Reversion SMA Strategy
The HYE Mean Reversion SMA Strategy is a mean reversion trading strategy using simple moving averages and the relative strength index (RSI). It generates buy and sell signals when the price deviates from the moving…
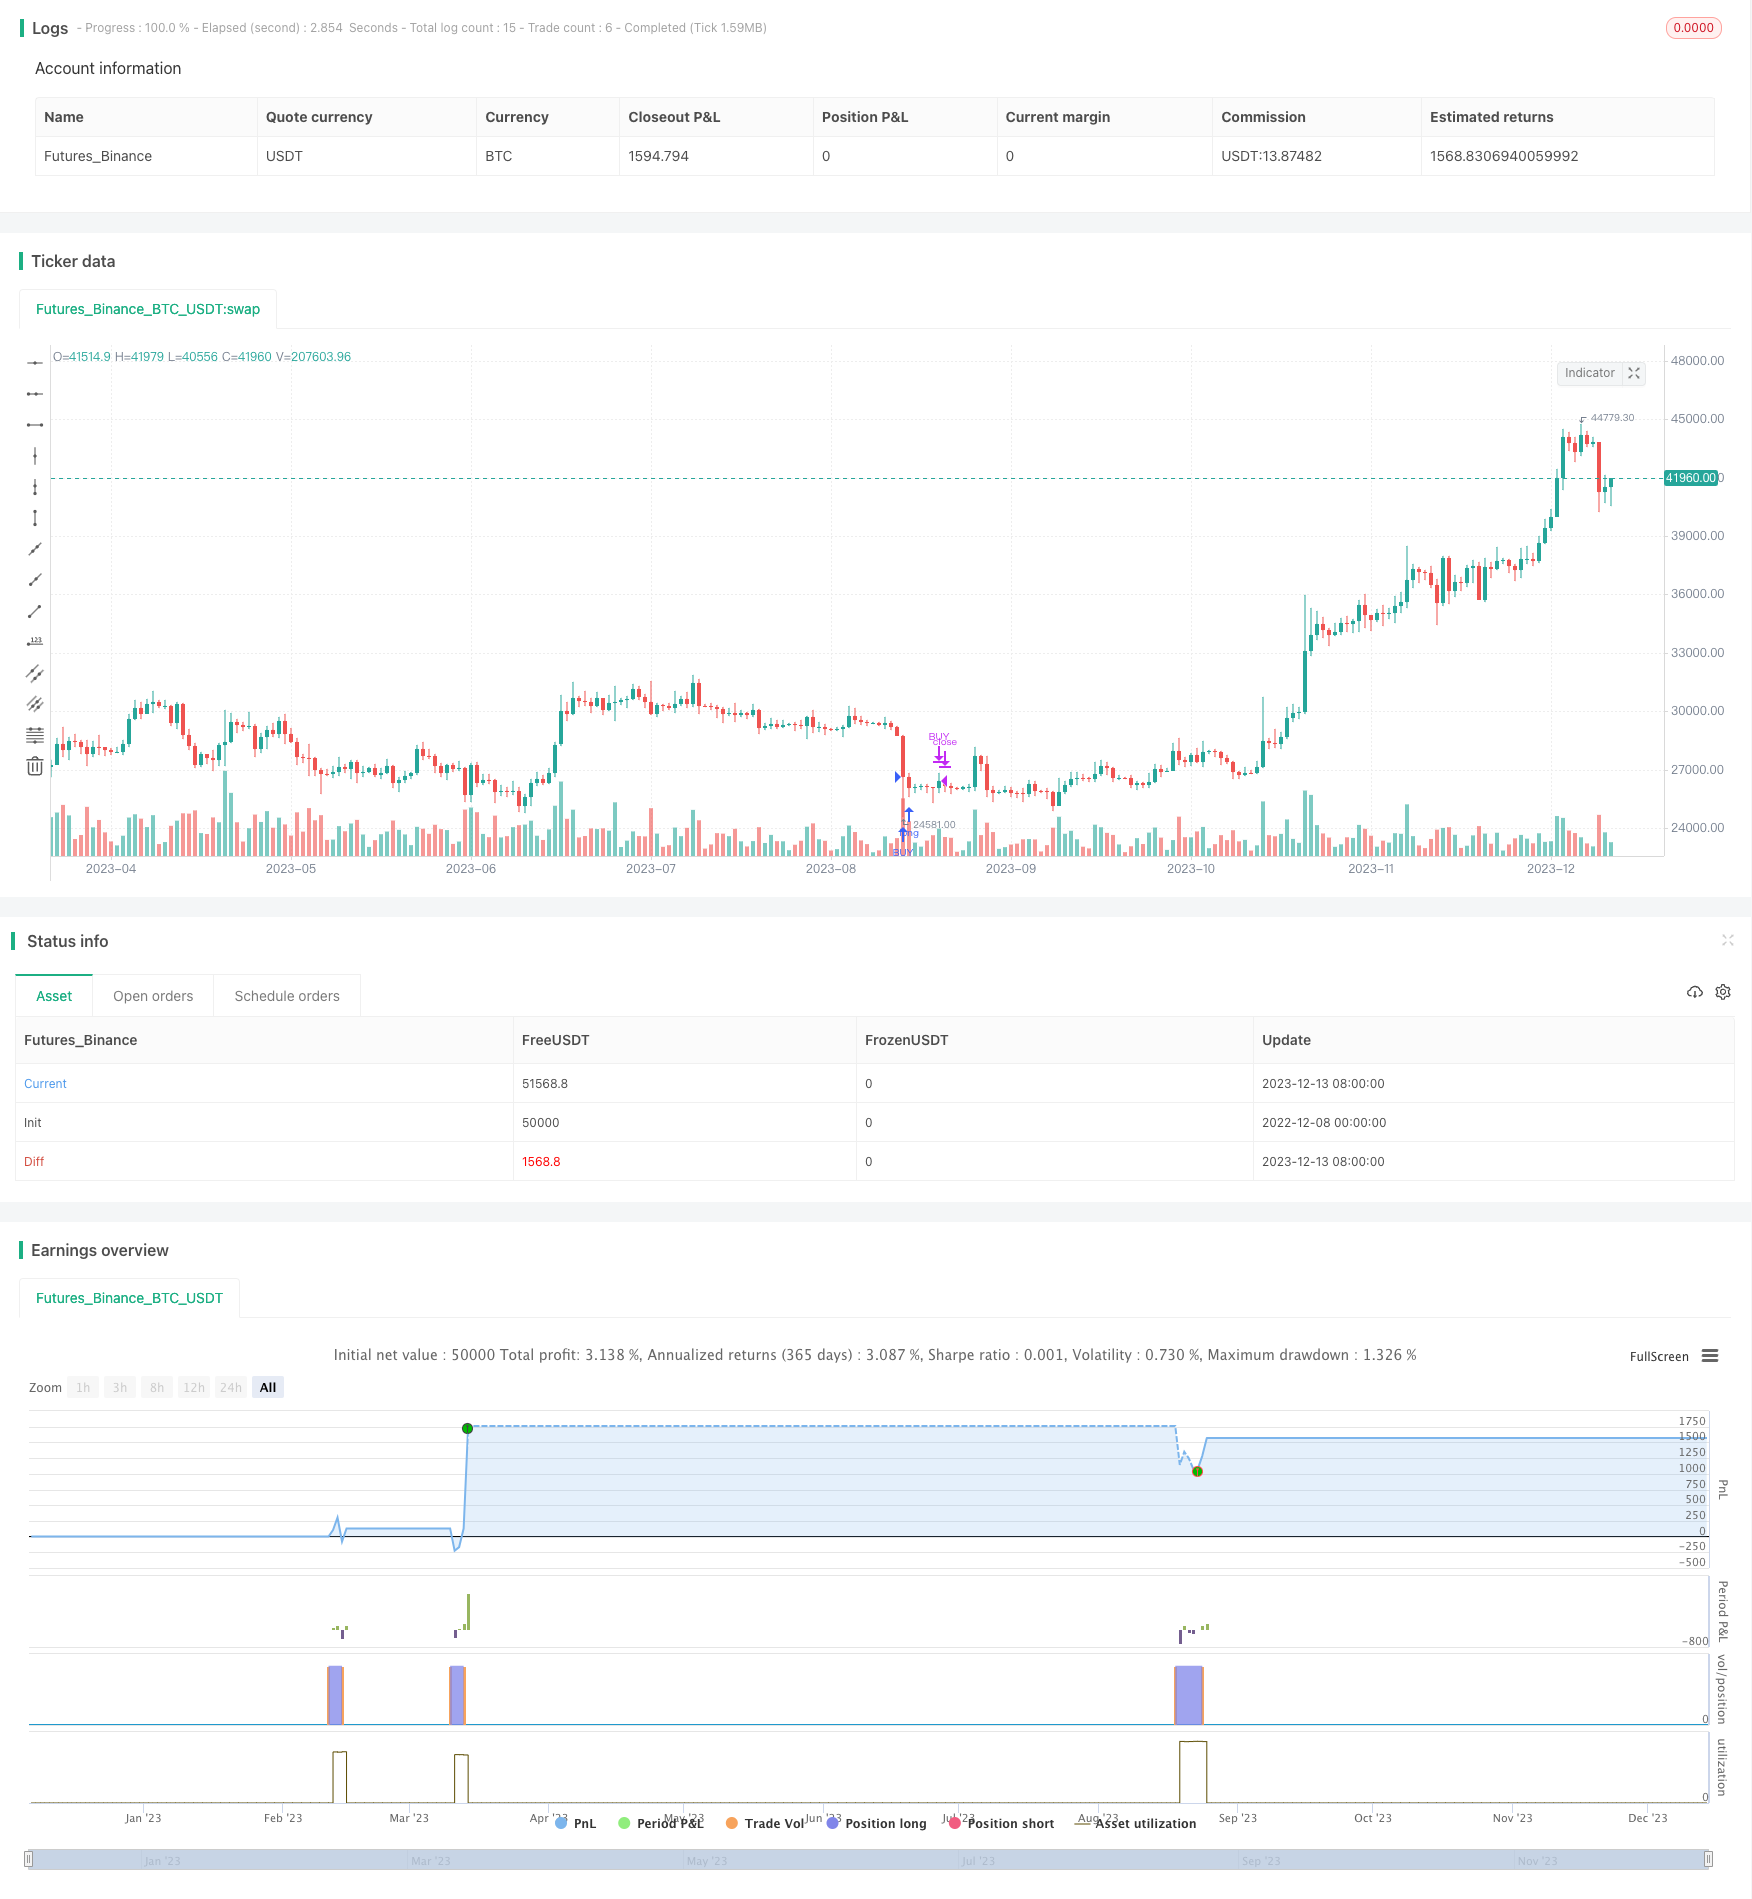
Overview
The HYE Mean Reversion SMA Strategy is a mean reversion trading strategy using simple moving averages and the relative strength index (RSI). It generates buy and sell signals when the price deviates from the moving average by a certain percentage, combined with RSI indicator filtering. It is a short-term trading strategy.
Strategy Logic
The strategy is mainly based on the following rules:
When the 2-period simple moving average falls 3% below the 5-period simple moving average, it is considered the price deviates from the mean and a buy signal is generated.
When the 2-period SMA crosses over the 5-period SMA, it is considered the price reverts to the mean and a sell signal is generated.
Combined with the exponential moving average of 5-period RSI, buy signals are only generated when RSI is below 30 and sell signals when RSI is above 70, to avoid unnecessary trading.
The main idea is to capture mean reversion opportunities by using short-term price fluctuations. Buy when the price drops by a certain percentage, sell when the price reverts near the moving average, to make a profit. Meanwhile, the RSI indicator can identify overbought and oversold conditions to filter out some noisy trading signals.
Advantage Analysis
The strategy has the following advantages:
Simple to implement with low monitoring costs.
Captures short-term mean reversion opportunities using price deviation from moving averages. Good backtest performances historically.
RSI indicator can effectively filter noise trading and avoid chasing peaks and killing valleys.
Flexible parameter adjustment adaptable to different market environments.
Supports long only, short only or both directions trading to suit different preferences.
Risk Analysis
There are also some risks:
Mean reversion relies on the price reverting to the moving average. There are high stop loss risks if drastic price changes occur.
Improper parameter settings may lead to over-trading or missing opportunities.
Performance is highly correlated with the market. Underperforms in range-bound and volatile markets.
Countermeasures:
Set proper stop loss to control single trade loss.
Gradually optimize parameters and evaluate risk adjusted returns.
Combine with stock index to enhance adaptivity.
Optimization Directions
The strategy can be optimized in the following aspects:
Test different moving average combinations to find optimal parameters.
Try incorporating other indicators to identify trends and improve win rate.
Add stop loss mechanisms to reduce maximum drawdown.
Optimize entry and exit rules to improve profit factors.
Adopt machine learning techniques to build adaptive parameters.
Conclusion
The HYE Mean Reversion SMA Strategy is a simple and practical short-term mean reversion strategy. It uses the price deviation from moving averages to generate trading signals, filtering out noise with RSI indicator. It demonstrated good backtest performances. The strategy is easy to implement with adjustable parameters adaptive to different market environments. But the uncertainty of reversion and stop loss risks should be noted, necessitating proper optimization for different market conditions. Overall, it provides a good reference mean reversion strategy template for quantitative trading.
Parameters
| Name | Default | What it controls |
|---|---|---|
| v_input_1_close | 0 | Source: close | high | low | open | hl2 | hlc3 | hlcc4 | ohlc4 |
| v_input_2 | 0 | Trade Direction: Long Only | Short Only | Both |
| v_input_3 | 2 | Small Moving Average |
| v_input_4 | 5 | Big Moving Average |
| v_input_5 | 3 | Percent below to buy % |
| v_input_6 | 3 | Percent above to sell % |
| v_input_7 | 2 | Rsi Period |
| v_input_8 | 30 | Maximum Rsi Level for Buy |
| v_input_9 | 70 | Minimum Rsi Level for Sell |
| v_input_10 | true | Start Date |
| v_input_11 | true | Start Month |
| v_input_12 | 2020 | Start Year |
| v_input_13 | 31 | End Date |
| v_input_14 | 12 | End Month |
| v_input_15 | 2021 | End Year |
Source Pine Script
/*backtest
start: 2022-12-08 00:00:00
end: 2023-12-14 00:00:00
period: 1d
basePeriod: 1h
exchanges: [{"eid":"Futures_Binance","currency":"BTC_USDT"}]
*/

// @version=4

strategy("HYE Mean Reversion SMA [Strategy]", overlay = true )

//Strategy inputs
source = input(title = "Source", defval = close)
tradeDirection = input(title="Trade Direction", type=input.string,
     options=["Long Only", "Short Only", "Both"], defval="Long Only")
smallMAPeriod = input(title = "Small Moving Average", defval = 2)
bigMAPeriod = input(title = "Big Moving Average", defval = 5)
percentBelowToBuy = input(title = "Percent below to buy %", defval = 3)
percentAboveToSell = input(title = "Percent above to sell %", defval = 3)
rsiPeriod = input(title = "Rsi Period", defval = 2)
rsiLevelforBuy = input(title = "Maximum Rsi Level for Buy", defval = 30)
rsiLevelforSell = input(title = "Minimum Rsi Level for Sell", defval = 70)

longOK  = (tradeDirection == "Long Only") or (tradeDirection == "Both")
shortOK = (tradeDirection == "Short Only") or (tradeDirection == "Both")

// Make input options that configure backtest date range
startDate = input(title="Start Date", type=input.integer,
     defval=1, minval=1, maxval=31)
startMonth = input(title="Start Month", type=input.integer,
     defval=1, minval=1, maxval=12)
startYear = input(title="Start Year", type=input.integer,
     defval=2020, minval=1800, maxval=2100)

endDate = input(title="End Date", type=input.integer,
     defval=31, minval=1, maxval=31)
endMonth = input(title="End Month", type=input.integer,
     defval=12, minval=1, maxval=12)
endYear = input(title="End Year", type=input.integer,
     defval=2021, minval=1800, maxval=2100)

inDateRange = true

//Strategy calculation
rsiValue = rsi(source, rsiPeriod)
rsiEMA   = ema(rsiValue, 5)
smallMA = sma(source, smallMAPeriod)
bigMA =  sma(source, bigMAPeriod)
buyMA = ((100 - percentBelowToBuy) / 100) * sma(source, bigMAPeriod)[0]
sellMA = ((100 + percentAboveToSell) / 100) * sma(source, bigMAPeriod)[0]

if(crossunder(smallMA, buyMA) and rsiEMA < rsiLevelforBuy and inDateRange and longOK)
    strategy.entry("BUY", strategy.long)

if(crossover(smallMA, bigMA) or not inDateRange)
    strategy.close("BUY")

if(crossover(smallMA, sellMA) and rsiEMA > rsiLevelforSell and inDateRange and shortOK)
    strategy.entry("SELL", strategy.short)

if(crossunder(smallMA, bigMA) or not inDateRange)
    strategy.close("SELL")
Published by ChaoZhang on the FMZ strategy square · last modified 2023-12-15. Collected in the Quant Trading Vault. Unvalidated research: re-test with your own data and costs before trusting it.
Build this with AgenKit
A spec is not a trading system. Paste this into your coding agent and AgenKit runs a specialist team — architecture, test-first build, risk gates, review — with paper trading on by default.
/agenkit build a production-grade trading bot with a backtest engine, risk controls and paper trading by default from strategies/HYE-Mean-Reversion-SMA-Strategy.md- npx agenkit install engineering-kit in your project
- Paste the command into your agent and approve each phase
- Get tests, backtest, risk controls and a paper-trading switch
Understand it first
Before you run this, read the lesson behind the idea and how to backtest it honestly. Specs like this one are the survivors of an unknown number of trials; deflate their results accordingly.
Related specs
- Advanced 15 Minute Chart Trading Signal StrategyPine Script · Mean reversion · 3h
- Advanced Momentum EMA Trend Following with RSI Overbought Oversold Trading StrategyPine Script · Mean reversion · 1d
- Advanced Quantitative Trading Strategy Combining RSI Divergence and Moving AveragesPine Script · Mean reversion · 1h
- BONK Multi Factor Trading StrategyPine Script · Mean reversion · 1d
- Customizable Non Repainting HTF MACD MFI Scalable Bot StrategyPine Script · Mean reversion · 1d
- Dual Moving Average Crossover with RSI Overbought Oversold Pyramid Dynamic Trend Trading StrategyPine Script · Mean reversion · 2h