Strategy vault / Mean reversion
Ichimoku Cloud Quant Strategy
This is a long-only Ichimoku cloud quant strategy. The strategy judges the trend direction through the Ichimoku indicator, combined with K-line patterns, moving averages and the Stochastic RSI indicator to filter…
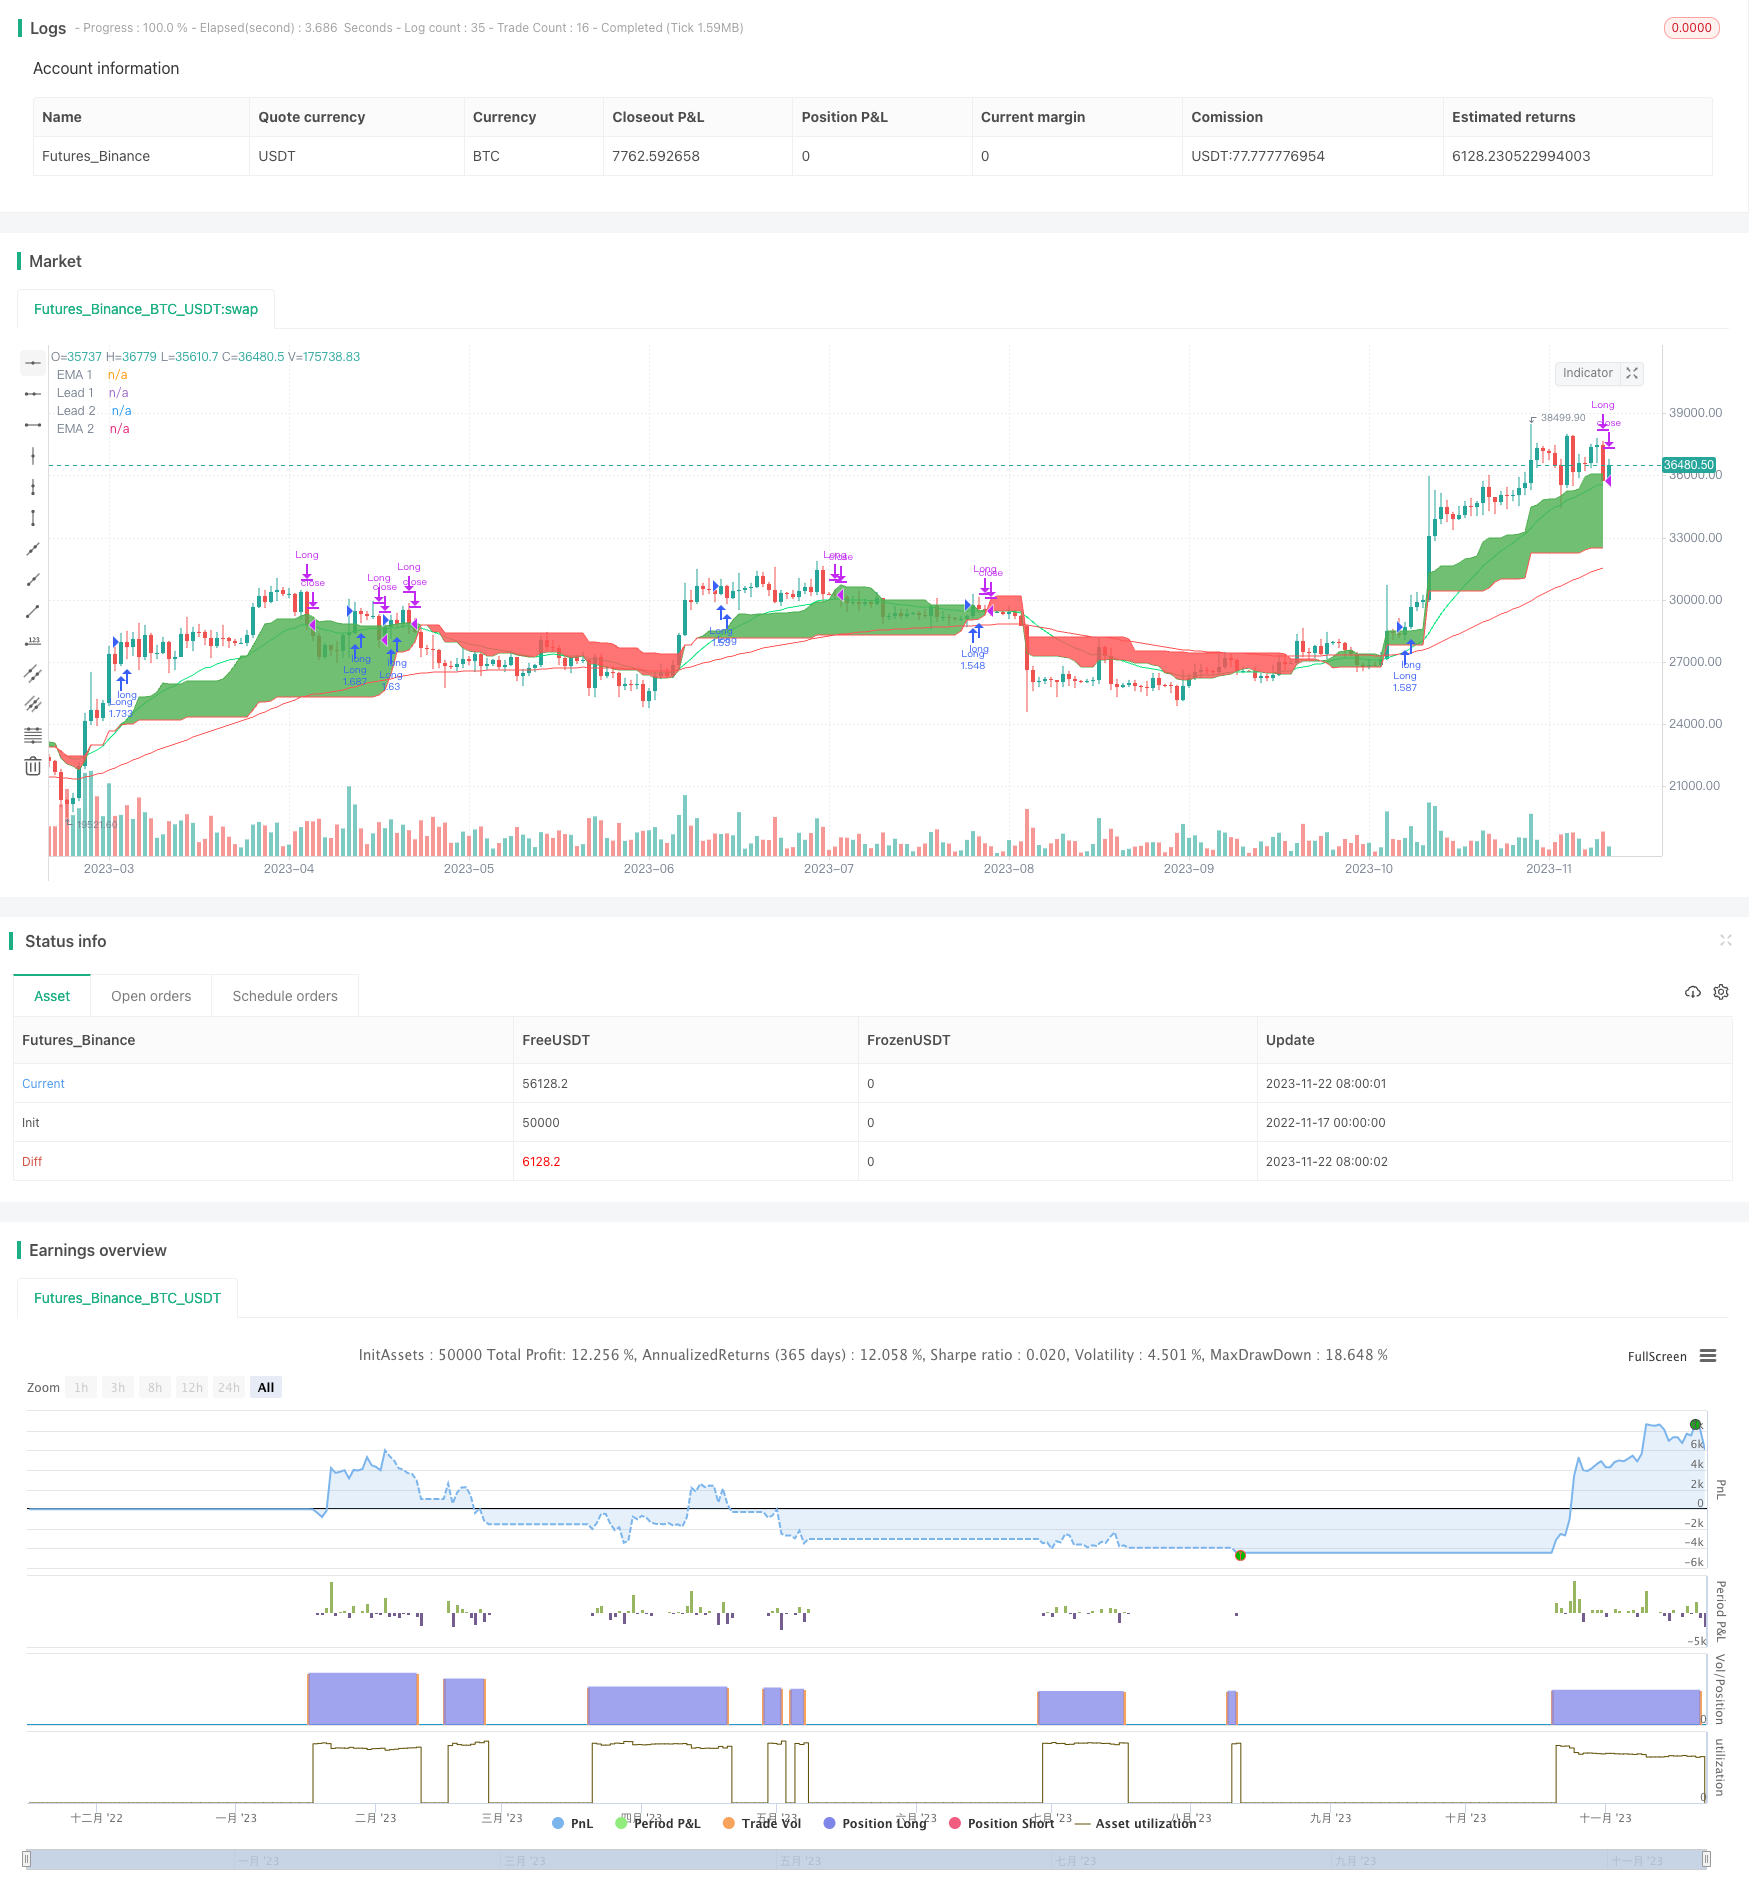
Overview
This is a long-only Ichimoku cloud quant strategy. The strategy judges the trend direction through the Ichimoku indicator, combined with K-line patterns, moving averages and the Stochastic RSI indicator to filter signals and go long at better entry points when the trend goes up.
Strategy Principle
The main judgment criteria of the strategy are:
- Ichimoku lead line 1 crosses above lead line 2, indicating an upward trend
- K-line close price crosses above lead line 1, meeting the condition to follow the trend
- K-line is a green candle, the trend goes up
- When moving averages are enabled, fast MA crosses above slow MA
- When Stochastic RSI is enabled, %K line crosses above %D line
When all the above conditions are met at the same time, the strategy will open long positions. When the price drops below lead line 1, the strategy will close positions.
The strategy mainly uses the Ichimoku cloud to determine the main trend direction, combined with auxiliary indicators to filter signals and go long at better points when the trend goes up.
Advantages of the Strategy
- Use Ichimoku cloud to determine main trend, backtest shows high accuracy
- Combined with multiple auxiliary indicators to filter entry points, can significantly improve profit rate
- Long-only strategy, suitable for currencies judged to be in a bull market
- Large space for parameter optimization, can adjust indicator parameters for further optimization
Risks of the Strategy
- There is a probability of Ichimoku cloud judging the trend wrongly
- Stop loss point may be broken during sudden market changes, leading to enlarged losses
- Designed for bull markets, not suitable for currencies with hidden signs of trend reversal
- Improper parameter settings may lead to over-aggressive entries or over-conservative actions
Countermeasures:
- Combine more indicators to judge the trend, improve accuracy
- Set reasonable stop loss points to strictly control single loss
- Select suitable strategies according to market conditions of different currencies
- Carefully test and optimize parameters to make the strategy more stable
Directions for Strategy Optimization
- Optimize parameter settings of auxiliary indicators to further improve stability
- Add stop loss mechanisms such as trailing stop loss, exponential moving average stop loss, etc.
- Add position management like fixed position sizing, position averaging, etc.
- Make parameter adjustments and optimizations for specific currencies
Summary
This Ichimoku cloud quant strategy achieves a high win rate yet risk-controllable only-long strategy by judging trend directions. The advantages of the strategy are obvious and it shows outstanding performance in bull markets. The next step is to improve aspects like indicator optimization, stop loss mechanism, position management to make the strategy more comprehensive and stable.
Parameters
| Name | Default | What it controls |
|---|---|---|
| v_input_1 | true | FromMonth |
| v_input_2 | true | FromDay |
| v_input_3 | 2017 | FromYear |
| v_input_4 | true | ToMonth |
| v_input_5 | true | ToDay |
| v_input_6 | 9999 | ToYear |
| v_input_7 | true | Enable EMA? |
| v_input_8 | false | Enable Stochastik RSI? |
| v_input_9 | 24 | EMA 1 |
| v_input_10 | 90 | EMA 2 |
| v_input_11 | 3 | RSI K Line |
| v_input_12 | 3 | RSI D Line |
| v_input_13 | 14 | RSI Length |
| v_input_14 | 14 | Stochastik Length |
| v_input_15_close | 0 | RSI Source: close | high | low | open | hl2 | hlc3 | hlcc4 | ohlc4 |
| v_input_16 | 9 | Ichi Conversion Line Length |
| v_input_17 | 26 | Ichi Base Line Length |
| v_input_18 | 52 | Ichi Lagging Span 2 Length |
| v_input_19 | true | Ichi Displacement |
Source Pine Script
/*backtest
start: 2022-11-17 00:00:00
end: 2023-11-23 00:00:00
period: 1d
basePeriod: 1h
exchanges: [{"eid":"Futures_Binance","currency":"BTC_USDT"}]
*/

//@version=4

strategy(title="Ichimoku only Long Strategy", shorttitle="Ichimoku only Long", overlay = true, pyramiding = 0, calc_on_order_fills = false, commission_type =  strategy.commission.percent, commission_value = 0, default_qty_type = strategy.percent_of_equity, default_qty_value = 100, initial_capital=10000, currency=currency.USD)

// Time Range
FromMonth=input(defval=1,title="FromMonth",minval=1,maxval=12)
FromDay=input(defval=1,title="FromDay",minval=1,maxval=31)
FromYear=input(defval=2017,title="FromYear",minval=2017)
ToMonth=input(defval=1,title="ToMonth",minval=1,maxval=12)
ToDay=input(defval=1,title="ToDay",minval=1,maxval=31)
ToYear=input(defval=9999,title="ToYear",minval=2017)
start=timestamp(FromYear,FromMonth,FromDay,00,00)
finish=timestamp(ToYear,ToMonth,ToDay,23,59)
window()=>true
// See if this bar's time happened on/after start date
afterStartDate = time >= start and time<=finish?true:false

//Enable RSI
enableema = input(true, title="Enable EMA?")
enablestochrsi = input(false, title="Enable Stochastik RSI?")

//EMA
emasrc = close,
len1 = input(24, minval=1, title="EMA 1")
len2 = input(90, minval=1, title="EMA 2")

ema1 = ema(emasrc, len1)
ema2 = ema(emasrc, len2)

col1 = color.lime
col2 = color.red

//EMA Plots
plot(ema1, title="EMA 1", linewidth=1, color=col1)
plot(ema2, title="EMA 2", linewidth=1, color=col2)

//STOCH RSI
smoothK = input(3, minval=1, title="RSI K Line")
smoothD = input(3, minval=1, title="RSI D Line")
lengthRSI = input(14, minval=1, title="RSI Length")
lengthStoch = input(14, minval=1, title="Stochastik Length")
src = input(close, title="RSI Source")

rsi1 = rsi(src, lengthRSI)
k = sma(stoch(rsi1, rsi1, rsi1, lengthStoch), smoothK)
d = sma(k, smoothD)

//Ichimoku
conversionPeriods = input(9, minval=1, title="Ichi Conversion Line Length")
basePeriods = input(26, minval=1, title="Ichi Base Line Length")
laggingSpan2Periods = input(52, minval=1, title="Ichi Lagging Span 2 Length")
displacement = input(1, minval=0, title="Ichi Displacement")
donchian(len) => avg(lowest(len), highest(len))
conversionLine = donchian(conversionPeriods)
baseLine = donchian(basePeriods)
leadLine1 = avg(conversionLine, baseLine)
leadLine2 = donchian(laggingSpan2Periods)
p1 = plot(leadLine1, offset = displacement - 1, color=color.green,
	 title="Lead 1")
p2 = plot(leadLine2, offset = displacement - 1, color=color.red,
	 title="Lead 2")
fill(p1, p2, color = leadLine1 > leadLine2 ? color.green : color.red)


//Long Condition
crossup = k[0] > d[0] and k[1] <= d[1]
ichigreenabovered = leadLine1 > leadLine2
ichimokulong = close > leadLine1
greencandle =  close > open
redcandle = close < open
emacond = ema1 > ema2
longcondition = ichigreenabovered and ichimokulong and greencandle

//Exit Condition
ichimokuexit = close < leadLine1

exitcondition = ichimokuexit and redcandle

//Entrys

if (enablestochrsi == false) and (enableema == false) and (longcondition) and (afterStartDate) and (strategy.opentrades < 1)
    strategy.entry("Long", strategy.long)

if (enablestochrsi == true) and (enableema == false) and (longcondition) and (crossup) and (afterStartDate) and (strategy.opentrades < 1)
    strategy.entry("Long", strategy.long)

if (enableema == true) and (enablestochrsi == false) and (longcondition) and (emacond) and (afterStartDate) and (strategy.opentrades < 1)
    strategy.entry("Long", strategy.long)

if (enableema == true) and (enablestochrsi == true) and (longcondition) and (emacond) and (crossup) and (afterStartDate) and (strategy.opentrades < 1)
    strategy.entry("Long", strategy.long)


//Exits
if (afterStartDate)
    strategy.close(id = "Long", when = exitcondition)
Published by ChaoZhang on the FMZ strategy square · last modified 2023-11-24. Collected in the Quant Trading Vault. Unvalidated research: re-test with your own data and costs before trusting it.
Build this with AgenKit
A spec is not a trading system. Paste this into your coding agent and AgenKit runs a specialist team — architecture, test-first build, risk gates, review — with paper trading on by default.
/agenkit build a production-grade trading bot with a backtest engine, risk controls and paper trading by default from strategies/Ichimoku-Cloud-Quant-Strategy.md- npx agenkit install engineering-kit in your project
- Paste the command into your agent and approve each phase
- Get tests, backtest, risk controls and a paper-trading switch
Understand it first
Before you run this, read the lesson behind the idea and how to backtest it honestly. Specs like this one are the survivors of an unknown number of trials; deflate their results accordingly.
Related specs
- Byron Serpent Cloud Quant StrategyPine Script · Mean reversion · 1h
- Dynamic Adaptive Multi Timeframe Trend Following and Range Reversal Hybrid StrategyPine Script · Mean reversion · 2d
- Multi Indicator Scoring Trading StrategyPine Script · Mean reversion · 1d
- Advanced 15 Minute Chart Trading Signal StrategyPine Script · Mean reversion · 3h
- Oma and Apollo Dual Rail Trading StrategyPine Script · Mean reversion · 5m
- 3EMA with Stochastic RSI StrategyPine Script · Mean reversion · 1h