Strategy vault / Trend following
Ichimoku Cloud with Dual Moving Average Crossover Strategy
This strategy combines the Ichimoku cloud with a dual moving average crossover system to form judgments on both long-term and short-term momentum, enabling highly accurate trend identification and trade signals. The…
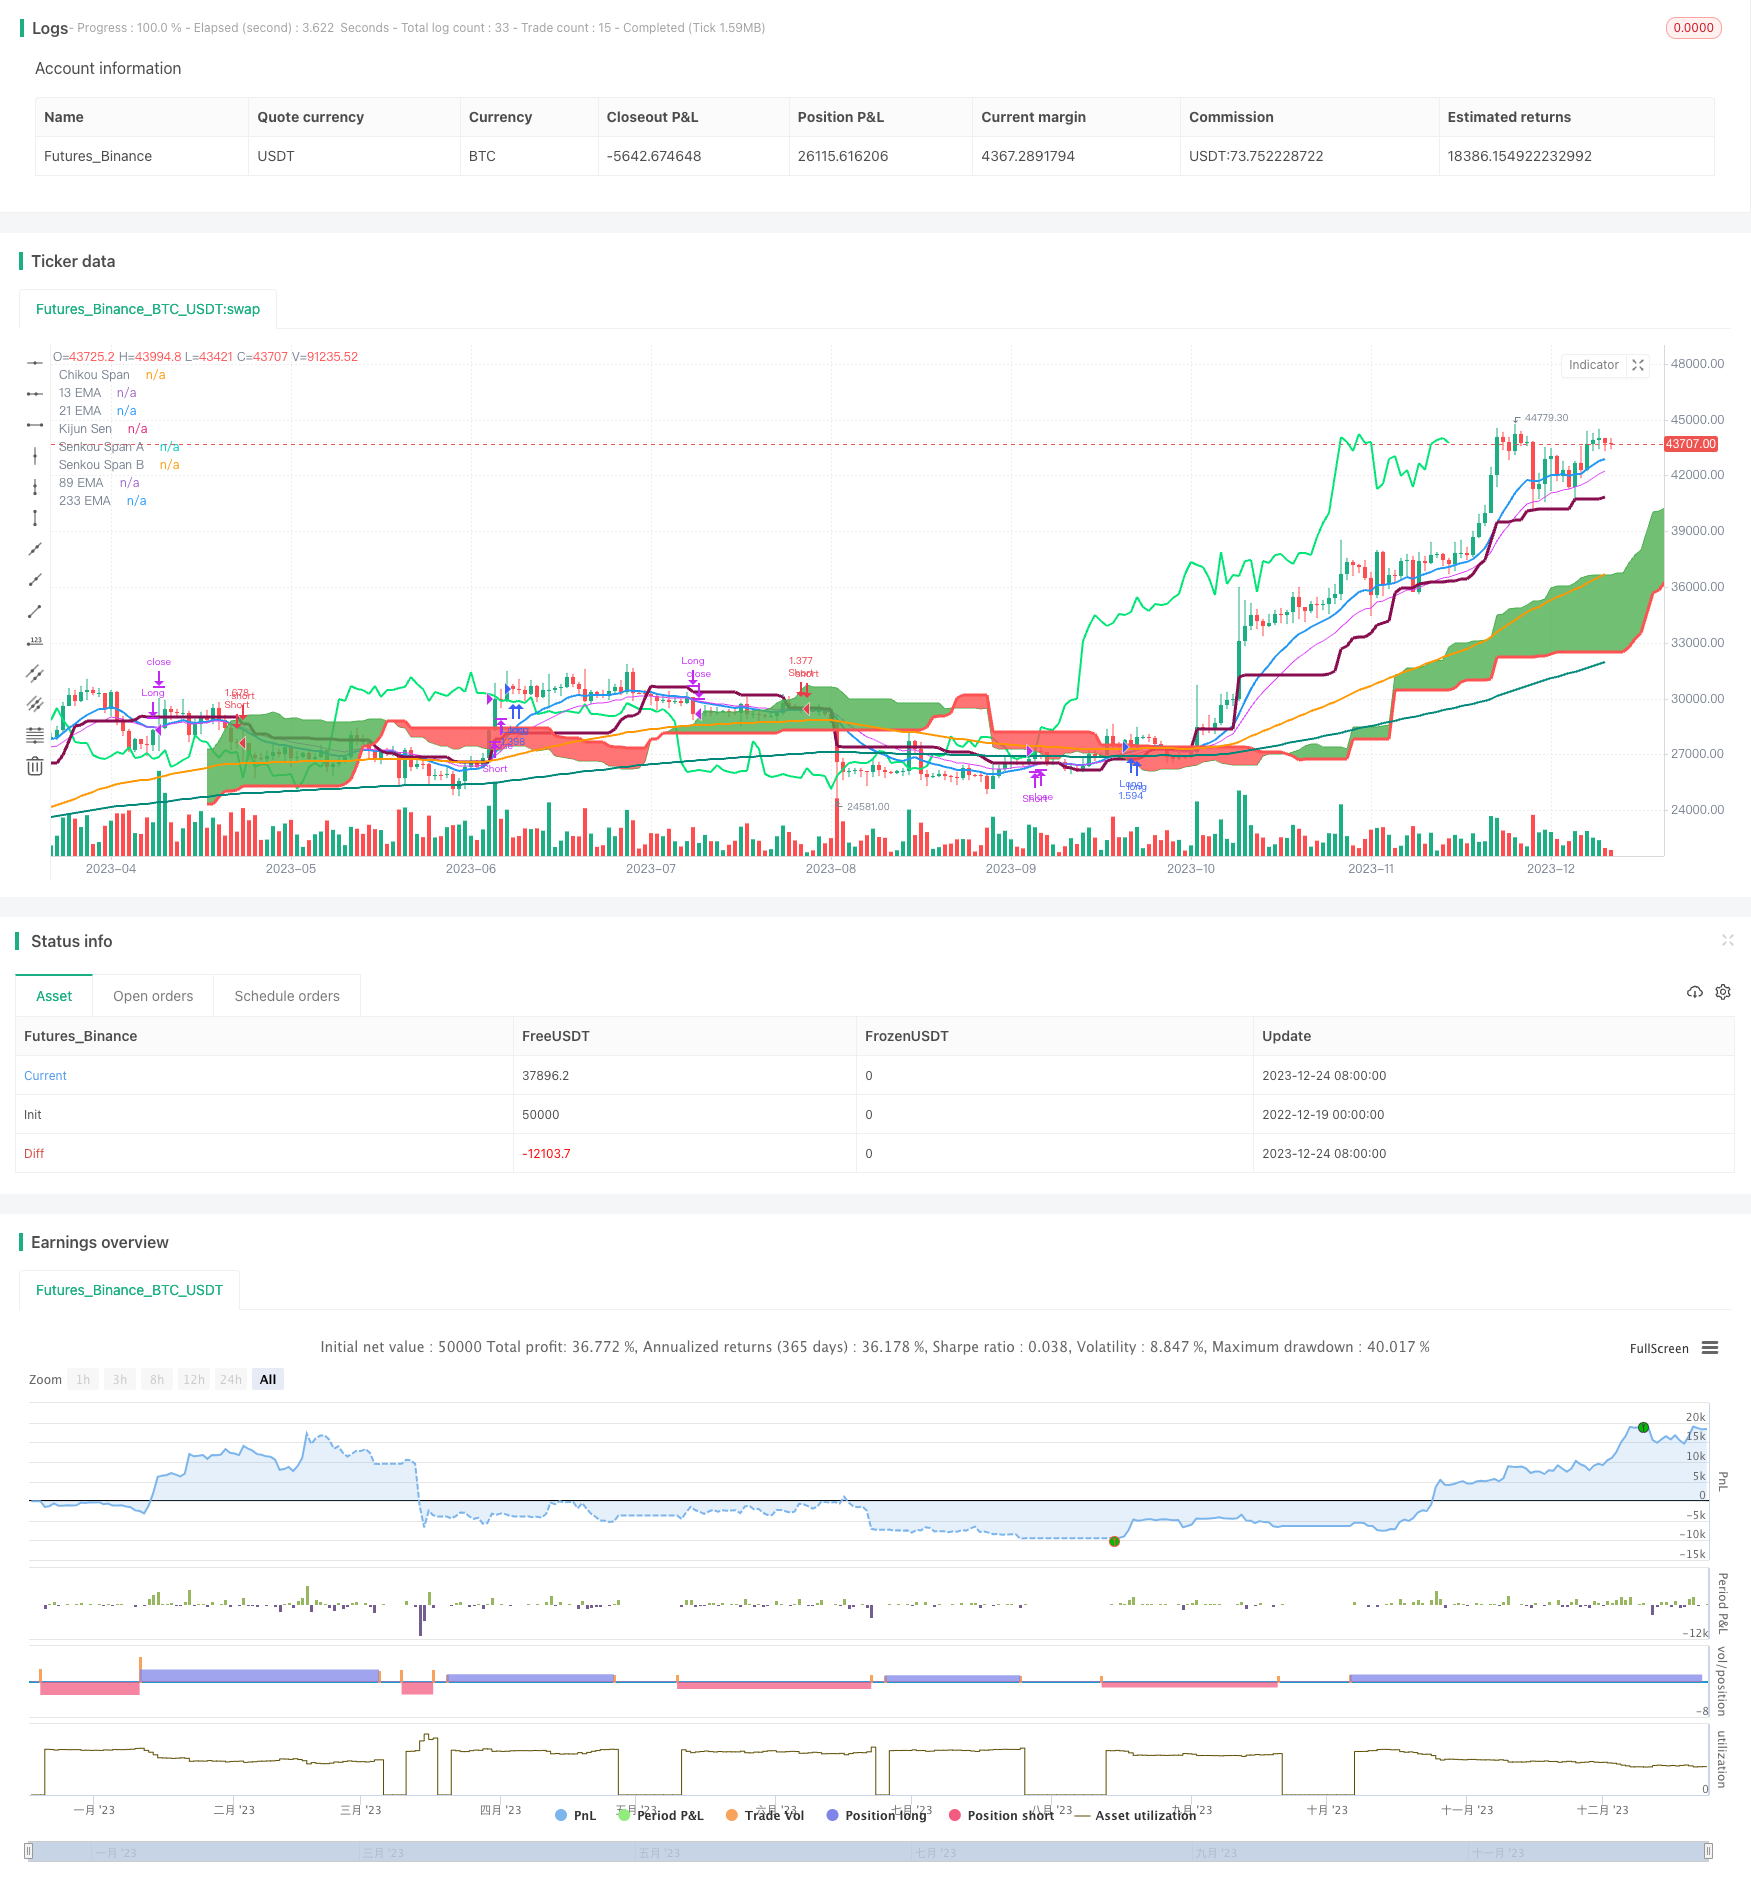
Overview
This strategy combines the Ichimoku cloud with a dual moving average crossover system to form judgments on both long-term and short-term momentum, enabling highly accurate trend identification and trade signals. The Ichimoku cloud is formed by the conversion line, base line, and leading lines to determine price energy and future movements. The dual moving average portion consists of 13 and 21 period exponential moving averages (EMA) to determine short-term price momentum shifts. Together, multiple timeframes are synthesized to improve accuracy and filter out false breaks.
Strategy Logic
The strategy primarily consists of the Ichimoku cloud and dual EMA indicators.
Within the Ichimoku cloud, the base line represents medium-term trends, conversion line for short-term trends, and cloud bands for support/resistance. Specifically, base line is 26 period midprice, conversion is 9 period midprice, cloud borders are midpoints of base/conversion lines and 52 period midprice. Prices above the cloud signal uptrend while below show downtrends.
For dual EMAs, 13 period EMA tracks short-term trends and 21 period EMA for medium-term trends. 13EMA above 21EMA signals uptrend and vice versa for downtrends.
Combining Ichimoku and EMA judgments enables fairly accurate trend detection. Specific entry rules require price above lagging line, 13EMA over base line and 21EMA, and price within cloud for longs. Short entries need the reverse.
The cloud identifies major trends, EMAs short-term momentum, and lagging line filters whipsaws. Together they reliably filter false breaks.
Advantages
The strategy has these main advantages:
Multi-timeframe synthesis. Cloud for medium/long-term, EMAs for short-term combine multiple dimensions for better accuracy.
Effective false break filtering. Strict entry rules requiring price, cloud, lagging line, EMAs alignment filter out noise.
Optimized parameters. Inputs like 9 period conversion line, 26 period base line reliably generate signals.
Applicable for high volatility assets. Ichimoku cloud robust against gaps, fitting for volatile stocks and crypto.
Clear support/resistance levels. Cloud bands clearly show critical S/R zones.
Risk Analysis
There are also some risks to consider:
Whipsaws possible during rangbound markets. Clouds diverge and signal reliability lower when no clear trends.
Lagging line may miss reversal points. Rapid flips could mean losses from lagging line detections.
Multiple indicators increase complexity. Traders need strong grasp of all indicators for accurate judgments.
Break failures possible on initial cloud penetrations. Long contained prices can whip on first breakouts.
Backtest overfitting risks. Current optimized parameters may overfit specific backtest data. Live performance may deteriorate.
Some mitigations for these risks include:
Reduce position sizing during choppy/whipsaw conditions based on volatility.
Additional indicators like MACD, RSI to filter lagging line signals.
Robust backtesting across various periods and instruments to verify stability. Incorporate real trading factors like slippage, commissions.
Track live performance to log anomalies vs expected behaviors as reference for improvements.
Enhancement Opportunities
The strategy can be improved in several aspects:
Incorporate stop loss mechanisms like volatility or high/low based stops to strictly limit risks.
Optimize EMA periods for better trend/counter-trend sensitivity.
Add additional indicators like MACD, RSI to filter signals, removing false positives.
Adapt position sizing based on volatility models, increase size in calm low volatility environments.
Test parameter robustness across different instruments and time periods for stability.
These enhancements can further improve stability, signal quality, robustness against curve fitting, and parameter resilience across various market conditions.
Conclusion
The integrated Ichimoku cloud and dual EMA crossover strategy complements Ichimoku's trending capabilities with EMA's short-term predictive skills into a robust system across multiple timeframes. Strict multi-indicator entry conditions effectively filter out false signals but whipsaw risks in choppy periods should be noted, warranting additional confirmation indicators in those cases. Overall it successfully combines core competencies of trend following and short-term forecasting, worthy of further research and application.
Parameters
| Name | Default | What it controls |
|---|---|---|
| v_input_1 | 9 | Tenkan Sen Periods |
| v_input_2 | 26 | Kijun Sen Periods |
| v_input_3 | 52 | Senkou Span B Periods |
| v_input_4 | 26 | Displacement |
Source Pine Script
/*backtest
start: 2022-12-19 00:00:00
end: 2023-12-25 00:00:00
period: 1d
basePeriod: 1h
exchanges: [{"eid":"Futures_Binance","currency":"BTC_USDT"}]
*/

//@version=3
strategy("13/21 EMA + Ichimoku Kinko Hyo Strategy", shorttitle="EMI", overlay=true, default_qty_type=strategy.percent_of_equity, max_bars_back=1000, default_qty_value=100, calc_on_order_fills= true, calc_on_every_tick=true, pyramiding=0)

TenkanSenPeriods = input(9, minval=1, title="Tenkan Sen Periods")
KijunSenPeriods = input(26, minval=1, title="Kijun Sen Periods")
SenkouSpanBPeriods = input(52, minval=1, title="Senkou Span B Periods")
displacement = input(26, minval=1, title="Displacement")
donchian(len) => avg(lowest(len), highest(len))
TenkanSen = donchian(TenkanSenPeriods)
KijunSen = donchian(KijunSenPeriods)
SenkouSpanA = avg(TenkanSen, KijunSen)
SenkouSpanB = donchian(SenkouSpanBPeriods)
ChikouSpan = close[displacement-1]

Sema = ema(close, 13)
Mema = ema(close, 21)
Lema = ema(close, 89)
XLema = ema(close, 233)

plot(Sema, color=blue, title="13 EMA", linewidth = 2)
plot(Mema, color=fuchsia, title="21 EMA", linewidth = 1)
plot(Lema, color=orange, title="89 EMA", linewidth = 2)
plot(XLema, color=teal, title="233 EMA", linewidth = 2)
plot(KijunSen, color=maroon, title="Kijun Sen", linewidth = 3)
plot(close, offset = -displacement, color=lime, title="Chikou Span", linewidth = 2)
sa=plot (SenkouSpanA, offset = displacement, color=green,  title="Senkou Span A", linewidth = 1)
sb=plot (SenkouSpanB, offset = displacement, color=red,  title="Senkou Span B", linewidth = 3)
fill(sa, sb, color = SenkouSpanA > SenkouSpanB ? green : red)

longCondition = close>ChikouSpan and Sema>KijunSen and Sema>Mema and SenkouSpanA>SenkouSpanB
strategy.entry("Long",strategy.long,when = longCondition)
strategy.close("Long", when = (close<KijunSen and close<ChikouSpan and Sema<Mema))

shortCondition = close<ChikouSpan and Sema<KijunSen and Sema<Mema and SenkouSpanA<SenkouSpanB
strategy.entry("Short",strategy.short, when = shortCondition)
strategy.close("Short", when = (close>KijunSen and close>ChikouSpan and Sema>Mema))
Published by ChaoZhang on the FMZ strategy square · last modified 2023-12-26. Collected in the Quant Trading Vault. Unvalidated research: re-test with your own data and costs before trusting it.
Build this with AgenKit
A spec is not a trading system. Paste this into your coding agent and AgenKit runs a specialist team — architecture, test-first build, risk gates, review — with paper trading on by default.
/agenkit build a production-grade trading bot with a backtest engine, risk controls and paper trading by default from strategies/Ichimoku-Cloud-with-Dual-Moving-Average-Crossover-Strategy.md- npx agenkit install engineering-kit in your project
- Paste the command into your agent and approve each phase
- Get tests, backtest, risk controls and a paper-trading switch
Understand it first
Before you run this, read the lesson behind the idea and how to backtest it honestly. Specs like this one are the survivors of an unknown number of trials; deflate their results accordingly.
Related specs
- Triple Supertrend Ichimoku Cloud Quantitative Trading StrategyPine Script · Trend following · 1d
- Ichimoku Balance Line trend following StrategyPine Script · Trend following · 1d
- Multitimeframe Trend Hunter StrategyPine Script · Trend following · 1h
- Crossing Moving Average Trend Tracking StrategyPine Script · Trend following · 2h
- TrendHunter w MF Multi Timeframe Trend StrategyPine Script · Trend following · 1h
- A Quantitative Ichimoku Cloud Trading StrategyPine Script · Trend following · 1h