Strategy vault / Trend following
Ichimoku Kinko Hyo Trend Following and Support Resistance Strategy
This strategy is based on the Ichimoku Kinko Hyo technical indicator, specifically utilizing its Span B line for trading decisions. The core idea is to buy when the price is above the Span B line and sell when it…
Overview
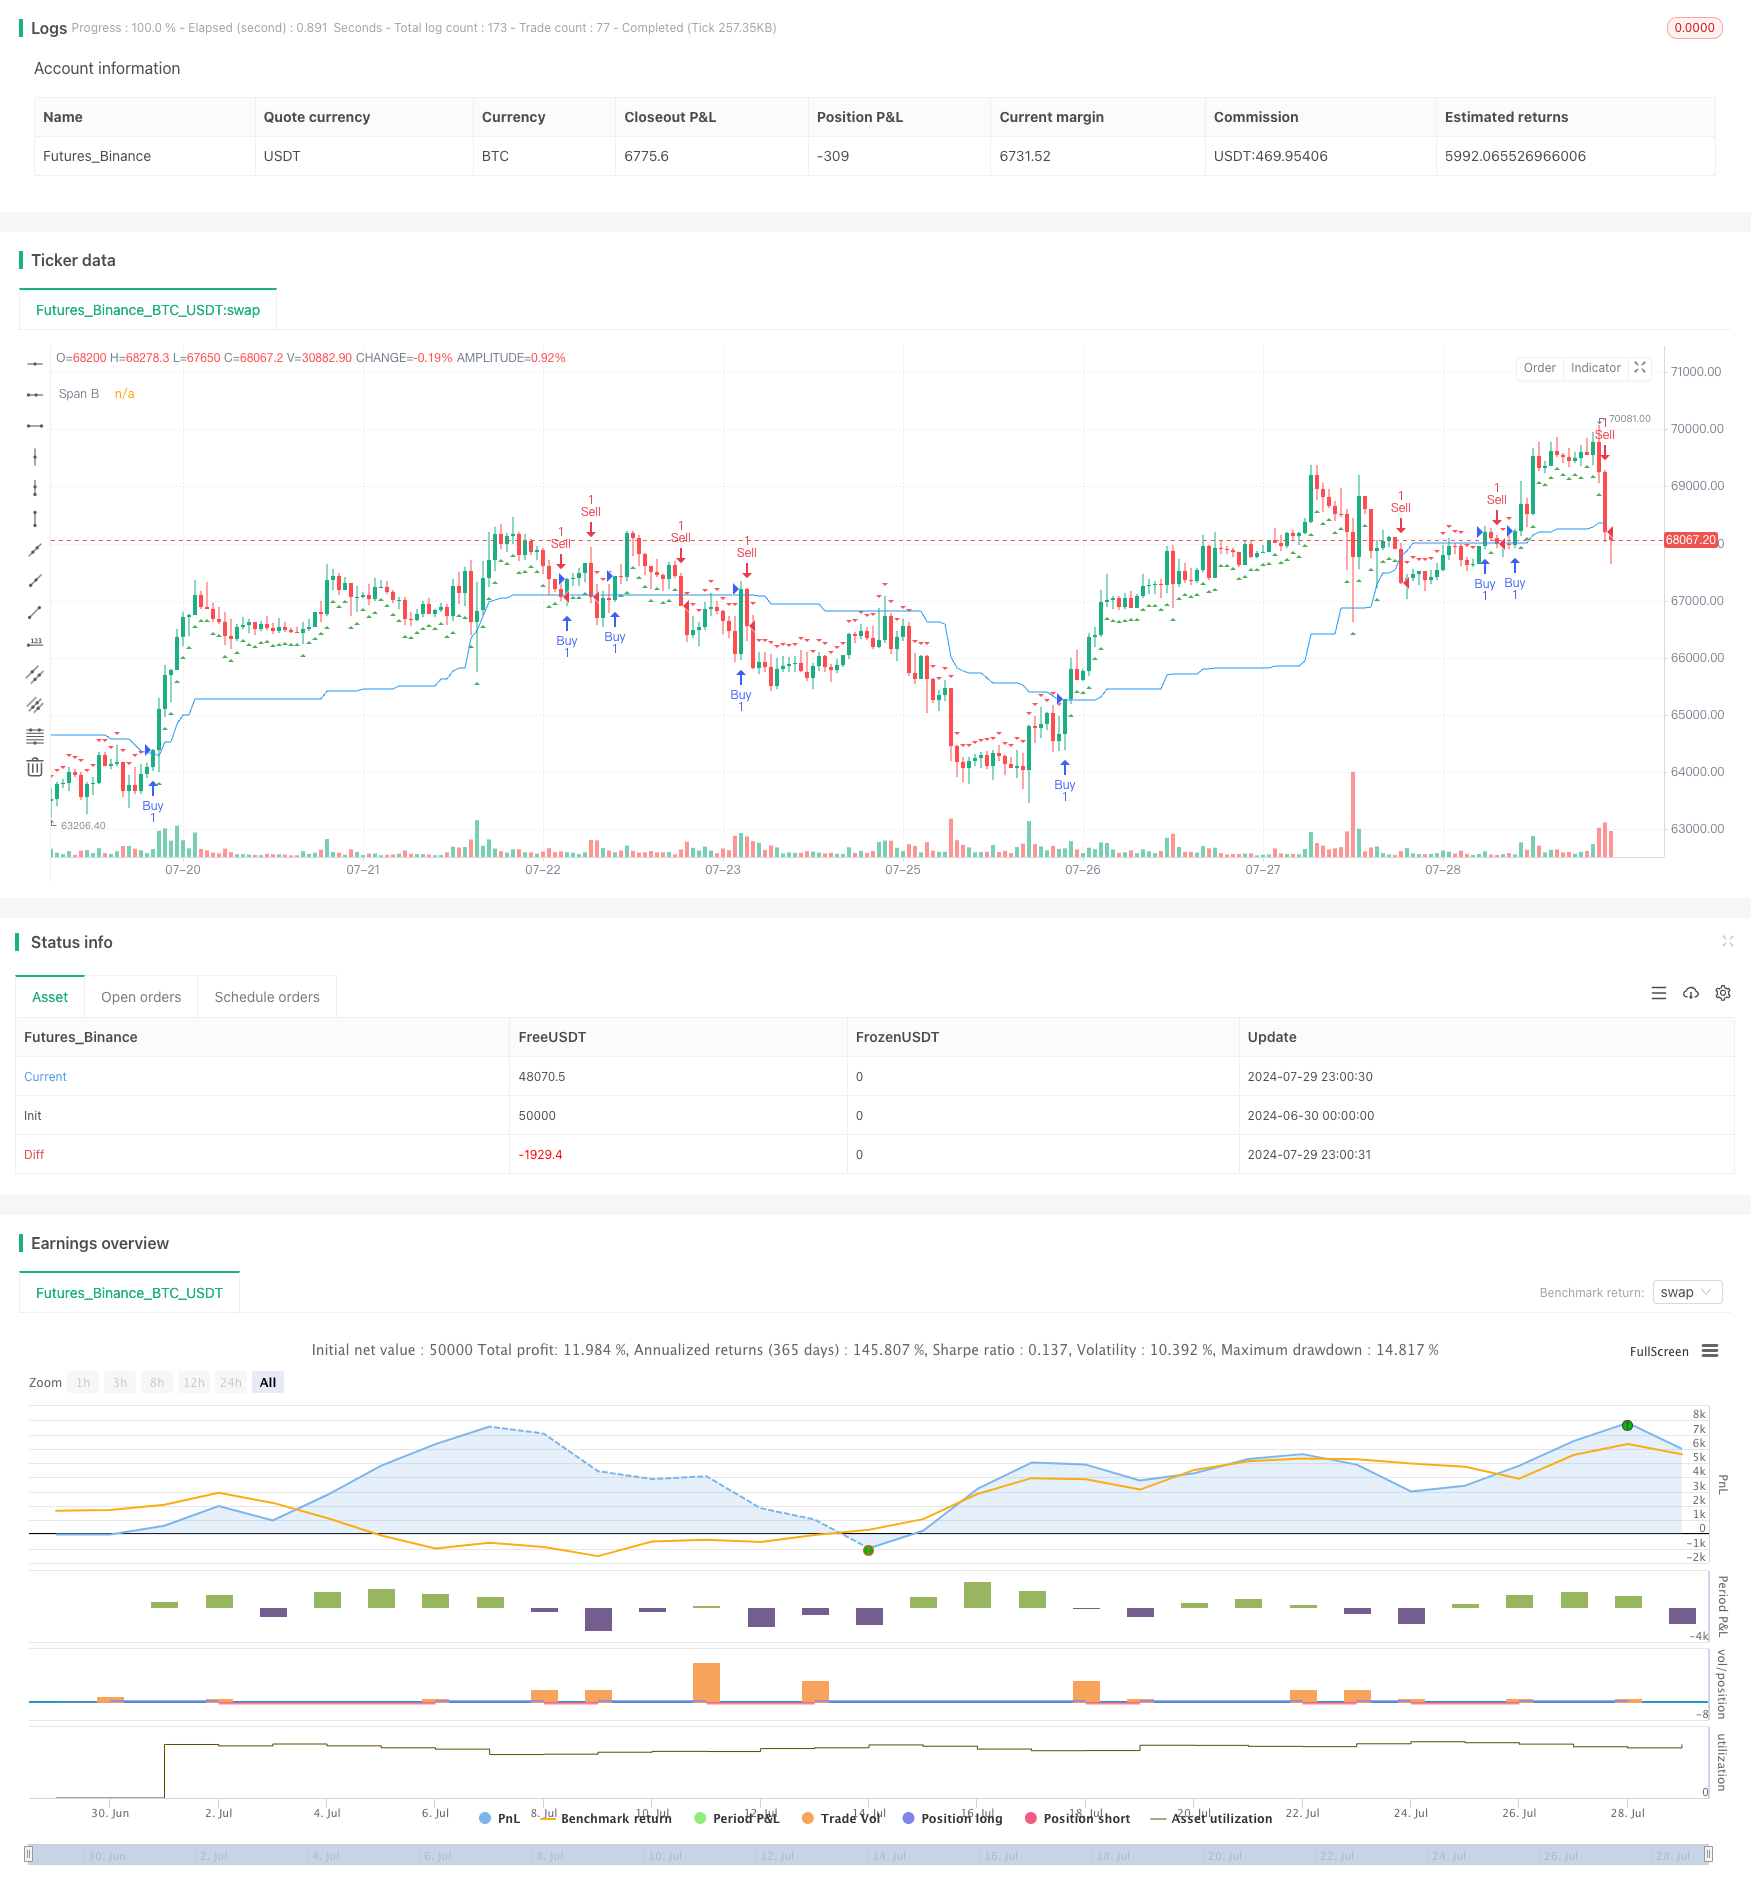
This strategy is based on the Ichimoku Kinko Hyo technical indicator, specifically utilizing its Span B line for trading decisions. The core idea is to buy when the price is above the Span B line and sell when it falls below. This approach leverages the Ichimoku's strengths in identifying market trends and support/resistance levels.
The strategy uses a 52-period calculation for the Span B line, aiming to capture medium to long-term market equilibrium. By observing the price's position relative to the Span B line, traders can determine whether the market is in an uptrend or downtrend and make trading decisions accordingly.
Strategy Principles
The core logic of the strategy is as follows:
Span B Calculation: The Span B line is calculated using the average of the highest high and lowest low over the past 52 periods. This setting is designed to reflect longer-term market equilibrium.
Buy Signal: A buy signal is generated when the closing price crosses above the Span B line. This suggests that the market may be entering an uptrend.
Sell Signal: A sell signal is generated when the closing price crosses below the Span B line. This may indicate the beginning of a downtrend.
Trade Execution: The strategy opens a long position when a buy signal is detected and a short position when a sell signal is detected.
Visualization: The strategy plots the Span B line on the chart and marks buy signals with green triangles and sell signals with red triangles, allowing traders to visually assess market conditions and trading opportunities.
Strategy Advantages
Trend Following: This strategy is inherently trend-following, helping to capture major market moves. By following the price's position relative to the Span B line, traders can enter trends early and exit when trends reverse.
Simplicity: Compared to the full Ichimoku system, this strategy focuses only on the Span B line, greatly simplifying the decision-making process. This simplification not only reduces strategy complexity but also minimizes the risk of overfitting.
Flexibility: The strategy's parameters (such as the calculation period for Span B) can be adjusted for different markets and timeframes. This flexibility allows the strategy to adapt to various trading instruments and market environments.
Objectivity: Based on clear mathematical calculations and rules, the strategy eliminates the impact of subjective judgment, helping to maintain consistency and discipline in trading.
Support and Resistance Identification: The Span B line serves not only to generate trading signals but also as a dynamic support and resistance level. This provides traders with additional insights into market structure.
Strategy Risks
False Breakouts: In ranging markets, price may frequently cross the Span B line, leading to excessive false signals. This can result in frequent trading, increasing transaction costs and reducing overall strategy performance.
Lag: As the Span B line is calculated based on a 52-period lookback, it may be slow to react in rapidly changing markets. This lag can cause missed entry or exit opportunities.
Lack of Confirmation: Relying solely on the Span B line may not be comprehensive enough. The absence of confirmation from other technical indicators or fundamental analysis may increase the risk of misjudgment.
Market Condition Sensitivity: The strategy may perform well in strong trend markets but could struggle in choppy markets or during sudden event-driven price moves.
Over-reliance on a Single Indicator: Using only the Span B line for decision-making may ignore other important market information, increasing the strategy's vulnerability.
Strategy Optimization Directions
Signal Filtering: Introduce additional conditions to filter trading signals, such as volume confirmation or other technical indicators. This can be achieved by adding indicators like RSI or MACD to improve signal reliability.
Dynamic Parameter Adjustment: Implement dynamic adjustment of the Span B calculation period to adapt to different market volatility conditions. Consider using adaptive algorithms to automatically adjust parameters based on market volatility.
Multi-Timeframe Analysis: Incorporate longer and shorter timeframes to gain a more comprehensive market perspective. For example, use the strategy on daily charts while referencing weekly trends as an additional filter.
Stop Loss and Take Profit Optimization: Introduce dynamic stop loss and take profit mechanisms, such as ATR (Average True Range) based stop losses or trailing stops to protect profits.
Market State Classification: Develop a market state classification system to apply different trading rules in various market environments (e.g., trending markets, ranging markets).
Machine Learning Integration: Utilize machine learning algorithms to optimize parameter selection and signal generation processes, enhancing the strategy's adaptability and performance.
Conclusion
The Ichimoku Kinko Hyo Trend Following and Support Resistance Strategy based on the Span B line offers traders a simple yet effective method to capture market trends and identify key support and resistance levels. By observing the price's position relative to the Span B line, traders can make clear buy and sell decisions.
The strategy's strengths lie in its simplicity, objectivity, and sensitivity to trends, making it particularly suitable for beginners and experienced traders seeking to simplify their trading systems. However, like all trading strategies, it faces risks such as false breakouts, lag, and over-reliance on a single indicator.
To enhance the strategy's robustness and adaptability, traders are advised to consider introducing additional filtering conditions, optimizing parameter settings, incorporating multi-timeframe analysis, and implementing dynamic risk management mechanisms. Through these optimizations, the strategy can better adapt to different market environments, improve profitability, and reduce risk.
Ultimately, successful application of this strategy requires traders to deeply understand the principles of Ichimoku Kinko Hyo, continuously monitor and evaluate strategy performance, and flexibly adjust according to market changes. Through ongoing learning and optimization, traders can transform this simple yet powerful tool into a reliable trading system.
Source Pine Script
/*backtest
start: 2024-06-30 00:00:00
end: 2024-07-30 00:00:00
period: 1h
basePeriod: 15m
exchanges: [{"eid":"Futures_Binance","currency":"BTC_USDT"}]
*/

//@version=5
strategy("Ichimoku-based Strategy", overlay=true)

// Ichimoku Parameters
conversionPeriods = input(9, "Conversion Line Periods")
basePeriods = input(26, "Base Line Periods")
laggingSpan2Periods = input(52, "Lagging Span 2 Periods")
displacement = input(26, "Displacement")

// Components to calculate Ichimoku Kinko Hyo
donchian(len) => math.avg(ta.lowest(len), ta.highest(len))
conversionLine = donchian(conversionPeriods)
baseLine = donchian(basePeriods)
leadLine1 = math.avg(conversionLine, baseLine)
leadLine2 = donchian(laggingSpan2Periods)

// Get the current closing price
currentClose = close

// Generate buy and sell signals
buySignal = currentClose > leadLine2
sellSignal = currentClose < leadLine2

// Execute Trade
if (buySignal)
    strategy.entry("Buy", strategy.long)
if (sellSignal)
    strategy.entry("Sell", strategy.short)

// Plot buy and sell signals
plotshape(buySignal, title="Buy Signal", location=location.belowbar, color=color.green, style=shape.triangleup, size=size.small)
plotshape(sellSignal, title="Sell Signal", location=location.abovebar, color=color.red, style=shape.triangledown, size=size.small)

// Display the main lines of the Ichimoku Kinko Hyo
plot(leadLine2, color=color.blue, title="Span B")
Published by ChaoZhang on the FMZ strategy square · last modified 2024-07-31. Collected in the Quant Trading Vault. Unvalidated research: re-test with your own data and costs before trusting it.
Build this with AgenKit
A spec is not a trading system. Paste this into your coding agent and AgenKit runs a specialist team — architecture, test-first build, risk gates, review — with paper trading on by default.
/agenkit build a production-grade trading bot with a backtest engine, risk controls and paper trading by default from strategies/Ichimoku-Kinko-Hyo-Trend-Following-and-Support-Resistance-Strategy.md- npx agenkit install engineering-kit in your project
- Paste the command into your agent and approve each phase
- Get tests, backtest, risk controls and a paper-trading switch
Understand it first
Before you run this, read the lesson behind the idea and how to backtest it honestly. Specs like this one are the survivors of an unknown number of trials; deflate their results accordingly.
Related specs
- Triple Supertrend Ichimoku Cloud Quantitative Trading StrategyPine Script · Trend following · 1d
- A Quantitative Ichimoku Cloud Trading StrategyPine Script · Trend following · 1h
- Ichimoku Balance Line trend following StrategyPine Script · Trend following · 1d
- Ichimoku Cloud Trend Following StrategyPine Script · Trend following · 1h
- Ichimoku Cloud with Dual Moving Average Crossover StrategyPine Script · Trend following · 1d
- Ichimoku Cloud Local Trend Identification StrategyPine Script · Trend following · 1d