Strategy vault / Trend following
Ichimoku Kumo Twist Gold Absorbing Strategy
The Ichimoku Kumo Twist Gold-Absorbing Strategy is a quantitative trading strategy that combines the Ichimoku market technical indicator and range filtering. It utilizes the Ichimoku indicator to determine market…
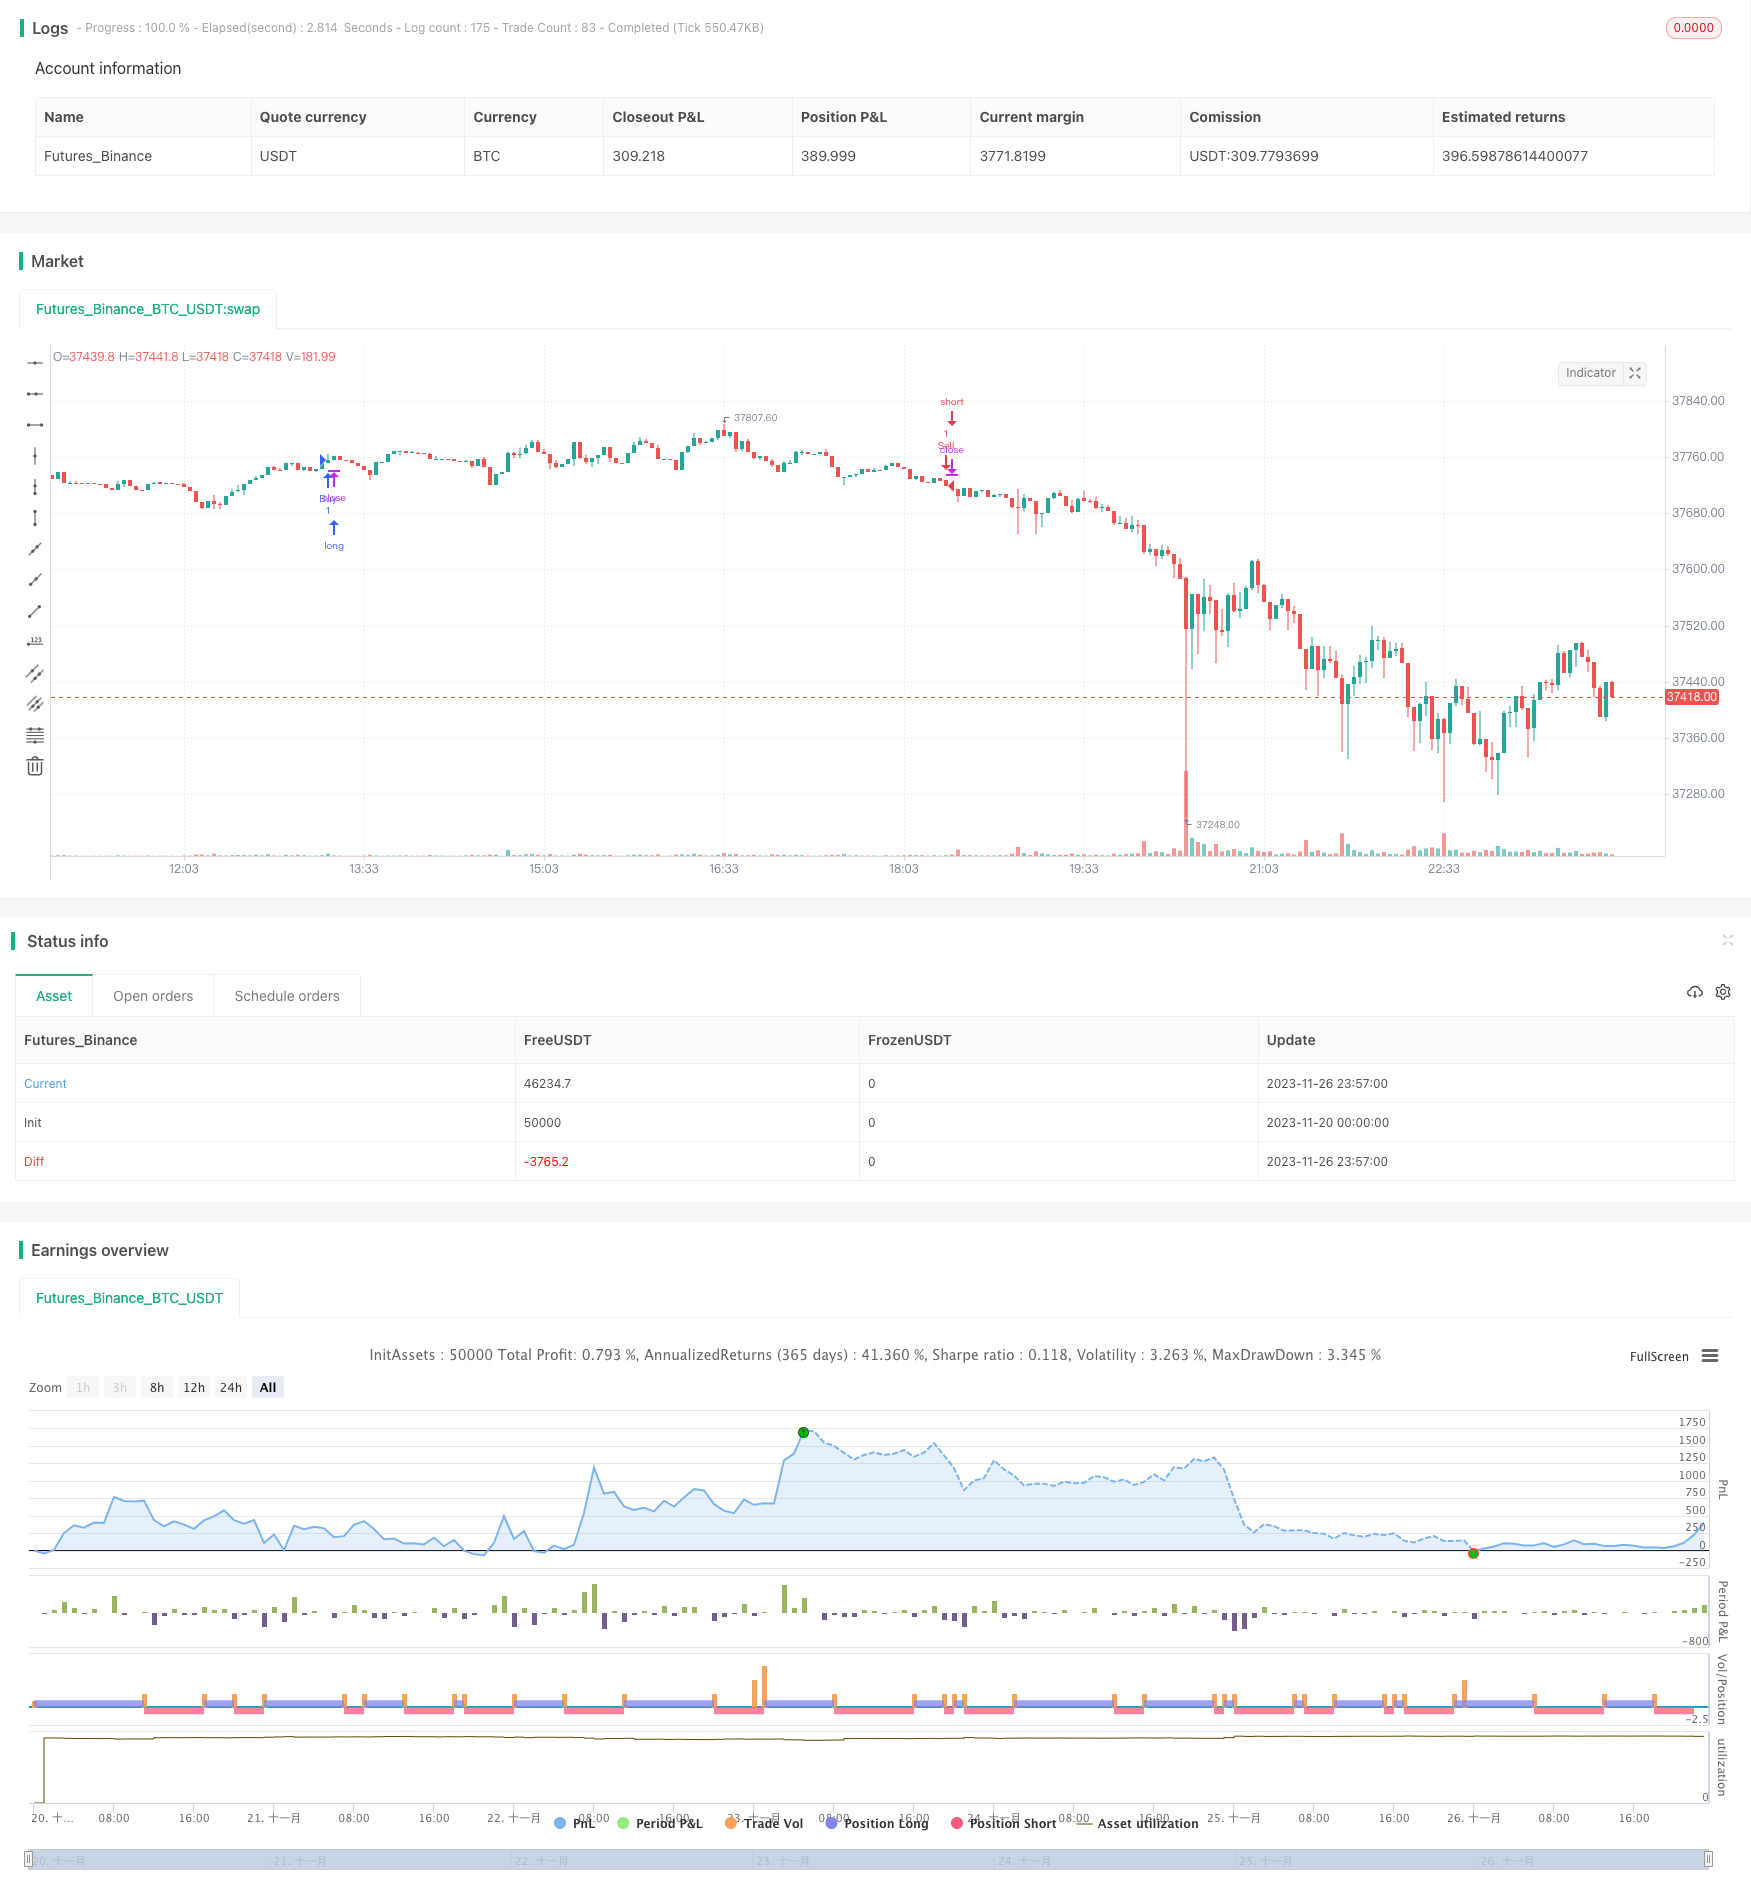
Overview
The Ichimoku Kumo Twist Gold-Absorbing Strategy is a quantitative trading strategy that combines the Ichimoku market technical indicator and range filtering. It utilizes the Ichimoku indicator to determine market trends and important support and resistance levels, together with candlestick patterns to generate trading signals. Meanwhile, range filtering helps to control the trading frequency and risk.
Strategy Principle
The strategy is primarily based on the Ichimoku indicator and candlestick patterns to judge market trends. The Ichimoku contains the conversion line, base line and cloud lines, their crossover relationships indicate market trends. The cloud lines also act as support and resistance levels. The strategy sets up different parameter combinations to adjust the sensitivity of the Ichimoku lines. In addition, the strategy identifies patterns and generates buy signals when the conversion line crosses above the base line, and sell signals when crossing below.
Furthermore, the strategy has date range filters set up, so that it only trades within specified date ranges. This controls the trading frequency. Also, the stop loss setting helps to reduce risk by stopping the loss when price runs in an unfavorable direction.
Advantage Analysis
- Utilize Ichimoku indicator to judge market trends, parameters adjustable for sensitivity
- Clear trading signals from candlestick pattern recognition
- Date range filter controls trading frequency
- Stop loss setting for timely stop loss to reduce risk
Risk Analysis
- Ichimoku lagging may miss fast changing trends
- Date range filter may miss some trading chances
- Improper stop loss setting may expand losses
Methods like adjusting Ichimoku parameters, optimizing date range, amending stop loss points can improve and control risks.
Optimization Directions
- Test different parameter combinations to find optimal Ichimoku configuration
- Combine with other indicators to avoid Ichimoku lagging issues
- Backtest to optimize date range settings
- Set conditional dynamic trailing stop loss
Summary
The Ichimoku Kumo Twist Gold-Absorbing Strategy integrates the Ichimoku indicator, candlestick pattern recognition, range filtering to determine market trends. It can grasp trend directions quite clearly. Through means like parameter tuning, risk control etc, good strategy performance can be achieved. But the Ichimoku lagging problem should be noted, and continuous optimization adjustments made.
Parameters
| Name | Default | What it controls |
|---|---|---|
| v_input_1 | 0 | Scaling: Linear | Log |
| v_input_2 | 0 | Presets: Cpt 20 60 120 30 | Cpt 10 30 60 30 | Std 18 52 104 26 | Std 9 26 52 26 |
| v_input_3 | true | Drop first N candles |
| v_input_4 | false | Show Clouds |
| v_input_5 | true | Stop Loss |
| v_input_6 | 10 | From Month |
| v_input_7 | 3 | From Day |
| v_input_8 | 2017 | From Year |
| v_input_9 | true | To Month |
| v_input_10 | true | To Day |
| v_input_11 | 9999 | To Year |
Source Pine Script
/*backtest
start: 2023-11-20 00:00:00
end: 2023-11-27 00:00:00
period: 3m
basePeriod: 1m
exchanges: [{"eid":"Futures_Binance","currency":"BTC_USDT"}]
*/

//@version=3
strategy(title="Ichimoku Kumo Twist Strategy (Presets)", shorttitle="Kumo Twist Strategy", overlay=true)

xlowest_(src, len) =>
    x = src
    for i = 1 to len - 1
        v = src[i]
        if (na(v))
            break
        x := min(x, v)
    x

xlowest(src, len) =>
    na(src[len]) ? xlowest_(src, len) : lowest(src, len)

xhighest_(src, len) =>
    x = src
    for i = 1 to len - 1
        v = src[i]
        if (na(v))
            break
        x := max(x, v)
    x

xhighest(src, len) =>
    na(src[len]) ? xhighest_(src, len) : highest(src, len)

dropn(src, n) =>
    na(src[n]) ? na : src

ichiConversionPeriods(presets) =>
    if presets == "Cpt 20 60 120 30"
        20
    else
        if presets == "Cpt 10 30 60 30"
            10
        else
            if presets == "Std 18 52 104 26"
                18
            else
                9

ichiBasePeriods(presets) =>
    if presets == "Cpt 20 60 120 30"
        60
    else
        if presets == "Cpt 10 30 60 30"
            30
        else
            if presets == "Std 18 52 104 26"
                52
            else
                26

ichiLaggingSpan2Periods(presets) =>
    if presets == "Cpt 20 60 120 30"
        120
    else
        if presets == "Cpt 10 30 60 30"
            60
        else
            if presets == "Std 18 52 104 26"
                104
            else
                52

ichiDisplacement(presets) =>
    if presets == "Cpt 20 60 120 30"
        30
    else
        if presets == "Cpt 10 30 60 30"
            30
        else
            if presets == "Std 18 52 104 26"
                26
            else
                26

scaling = input(title="Scaling", options=["Linear", "Log"], defval="Linear")
presets = input(title="Presets", options=["Cpt 20 60 120 30", "Cpt 10 30 60 30", "Std 18 52 104 26", "Std 9 26 52 26"], defval="Cpt 20 60 120 30")
dropCandles = input(1, minval=0, title="Drop first N candles")
showClouds = input(false, "Show Clouds")
stoploss = input(true, title="Stop Loss")

conversionPeriods = ichiConversionPeriods(presets)
basePeriods = ichiBasePeriods(presets)
laggingSpan2Periods = ichiLaggingSpan2Periods(presets)
displacement = ichiDisplacement(presets)
logScaling = scaling == "Log"

lows = dropn(low, dropCandles)
highs = dropn(high, dropCandles)

lowsp = logScaling ? log(lows) : lows
highsp = logScaling ? log(highs) : highs

donchian(len) =>
    avg(xlowest(lowsp, len), xhighest(highsp, len))

conversionLine = donchian(conversionPeriods)
baseLine = donchian(basePeriods)
leadLine1 = avg(conversionLine, baseLine)
leadLine2 = donchian(laggingSpan2Periods)

// === BACKTEST RANGE ===
FromMonth = input(defval = 10, title = "From Month", minval = 1)
FromDay   = input(defval = 3, title = "From Day", minval = 1)
FromYear  = input(defval = 2017, title = "From Year", minval = 2014)
ToMonth   = input(defval = 1, title = "To Month", minval = 1)
ToDay     = input(defval = 1, title = "To Day", minval = 1)
ToYear    = input(defval = 9999, title = "To Year", minval = 2014)

golong = crossover(leadLine1, leadLine2)
goshort = crossunder(leadLine1, leadLine2)

strategy.entry("Buy", strategy.long, when=(golong and (time > timestamp(FromYear, FromMonth, FromDay, 00, 00)) and (time < timestamp(ToYear, ToMonth, ToDay, 23, 59))))
strategy.entry("Sell", strategy.short, when=(goshort and (time > timestamp(FromYear, FromMonth, FromDay, 00, 00)) and (time < timestamp(ToYear, ToMonth, ToDay, 23, 59))))

conversionLinep = logScaling ? exp(conversionLine) : conversionLine
baseLinep = logScaling ? exp(baseLine) : baseLine
leadLine1p = logScaling ? exp(leadLine1) : leadLine1
leadLine2p = logScaling ? exp(leadLine2) : leadLine2

plot(showClouds ? conversionLinep : na, color=#0496ff, title="Conversion Line")
plot(showClouds ? baseLinep : na, color=#991515, title="Base Line")

p1 = plot(showClouds ? leadLine1p : na, offset = displacement, color=green, title="Lead 1")
p2 = plot(showClouds ? leadLine2p : na, offset = displacement, color=red, title="Lead 2")
fill(p1, p2, color = showClouds ? (leadLine1p > leadLine2p ? green : red) : na)
Published by ChaoZhang on the FMZ strategy square · last modified 2023-11-28. Collected in the Quant Trading Vault. Unvalidated research: re-test with your own data and costs before trusting it.
Build this with AgenKit
A spec is not a trading system. Paste this into your coding agent and AgenKit runs a specialist team — architecture, test-first build, risk gates, review — with paper trading on by default.
/agenkit build a production-grade trading bot with a backtest engine, risk controls and paper trading by default from strategies/Ichimoku-Kumo-Twist-Gold-Absorbing-Strategy.md- npx agenkit install engineering-kit in your project
- Paste the command into your agent and approve each phase
- Get tests, backtest, risk controls and a paper-trading switch
Understand it first
Before you run this, read the lesson behind the idea and how to backtest it honestly. Specs like this one are the survivors of an unknown number of trials; deflate their results accordingly.
Related specs
- Triple Supertrend Ichimoku Cloud Quantitative Trading StrategyPine Script · Trend following · 1d
- A Quantitative Ichimoku Cloud Trading StrategyPine Script · Trend following · 1h
- Ichimoku Balance Line trend following StrategyPine Script · Trend following · 1d
- Ichimoku Cloud Trend Following StrategyPine Script · Trend following · 1h
- Ichimoku Kinko Hyo Trend Following and Support Resistance StrategyPine Script · Trend following · 1h
- Ichimoku Cloud with Dual Moving Average Crossover StrategyPine Script · Trend following · 1d