Strategy vault / Mean reversion
Ichimoku Trading Strategy With Money Management
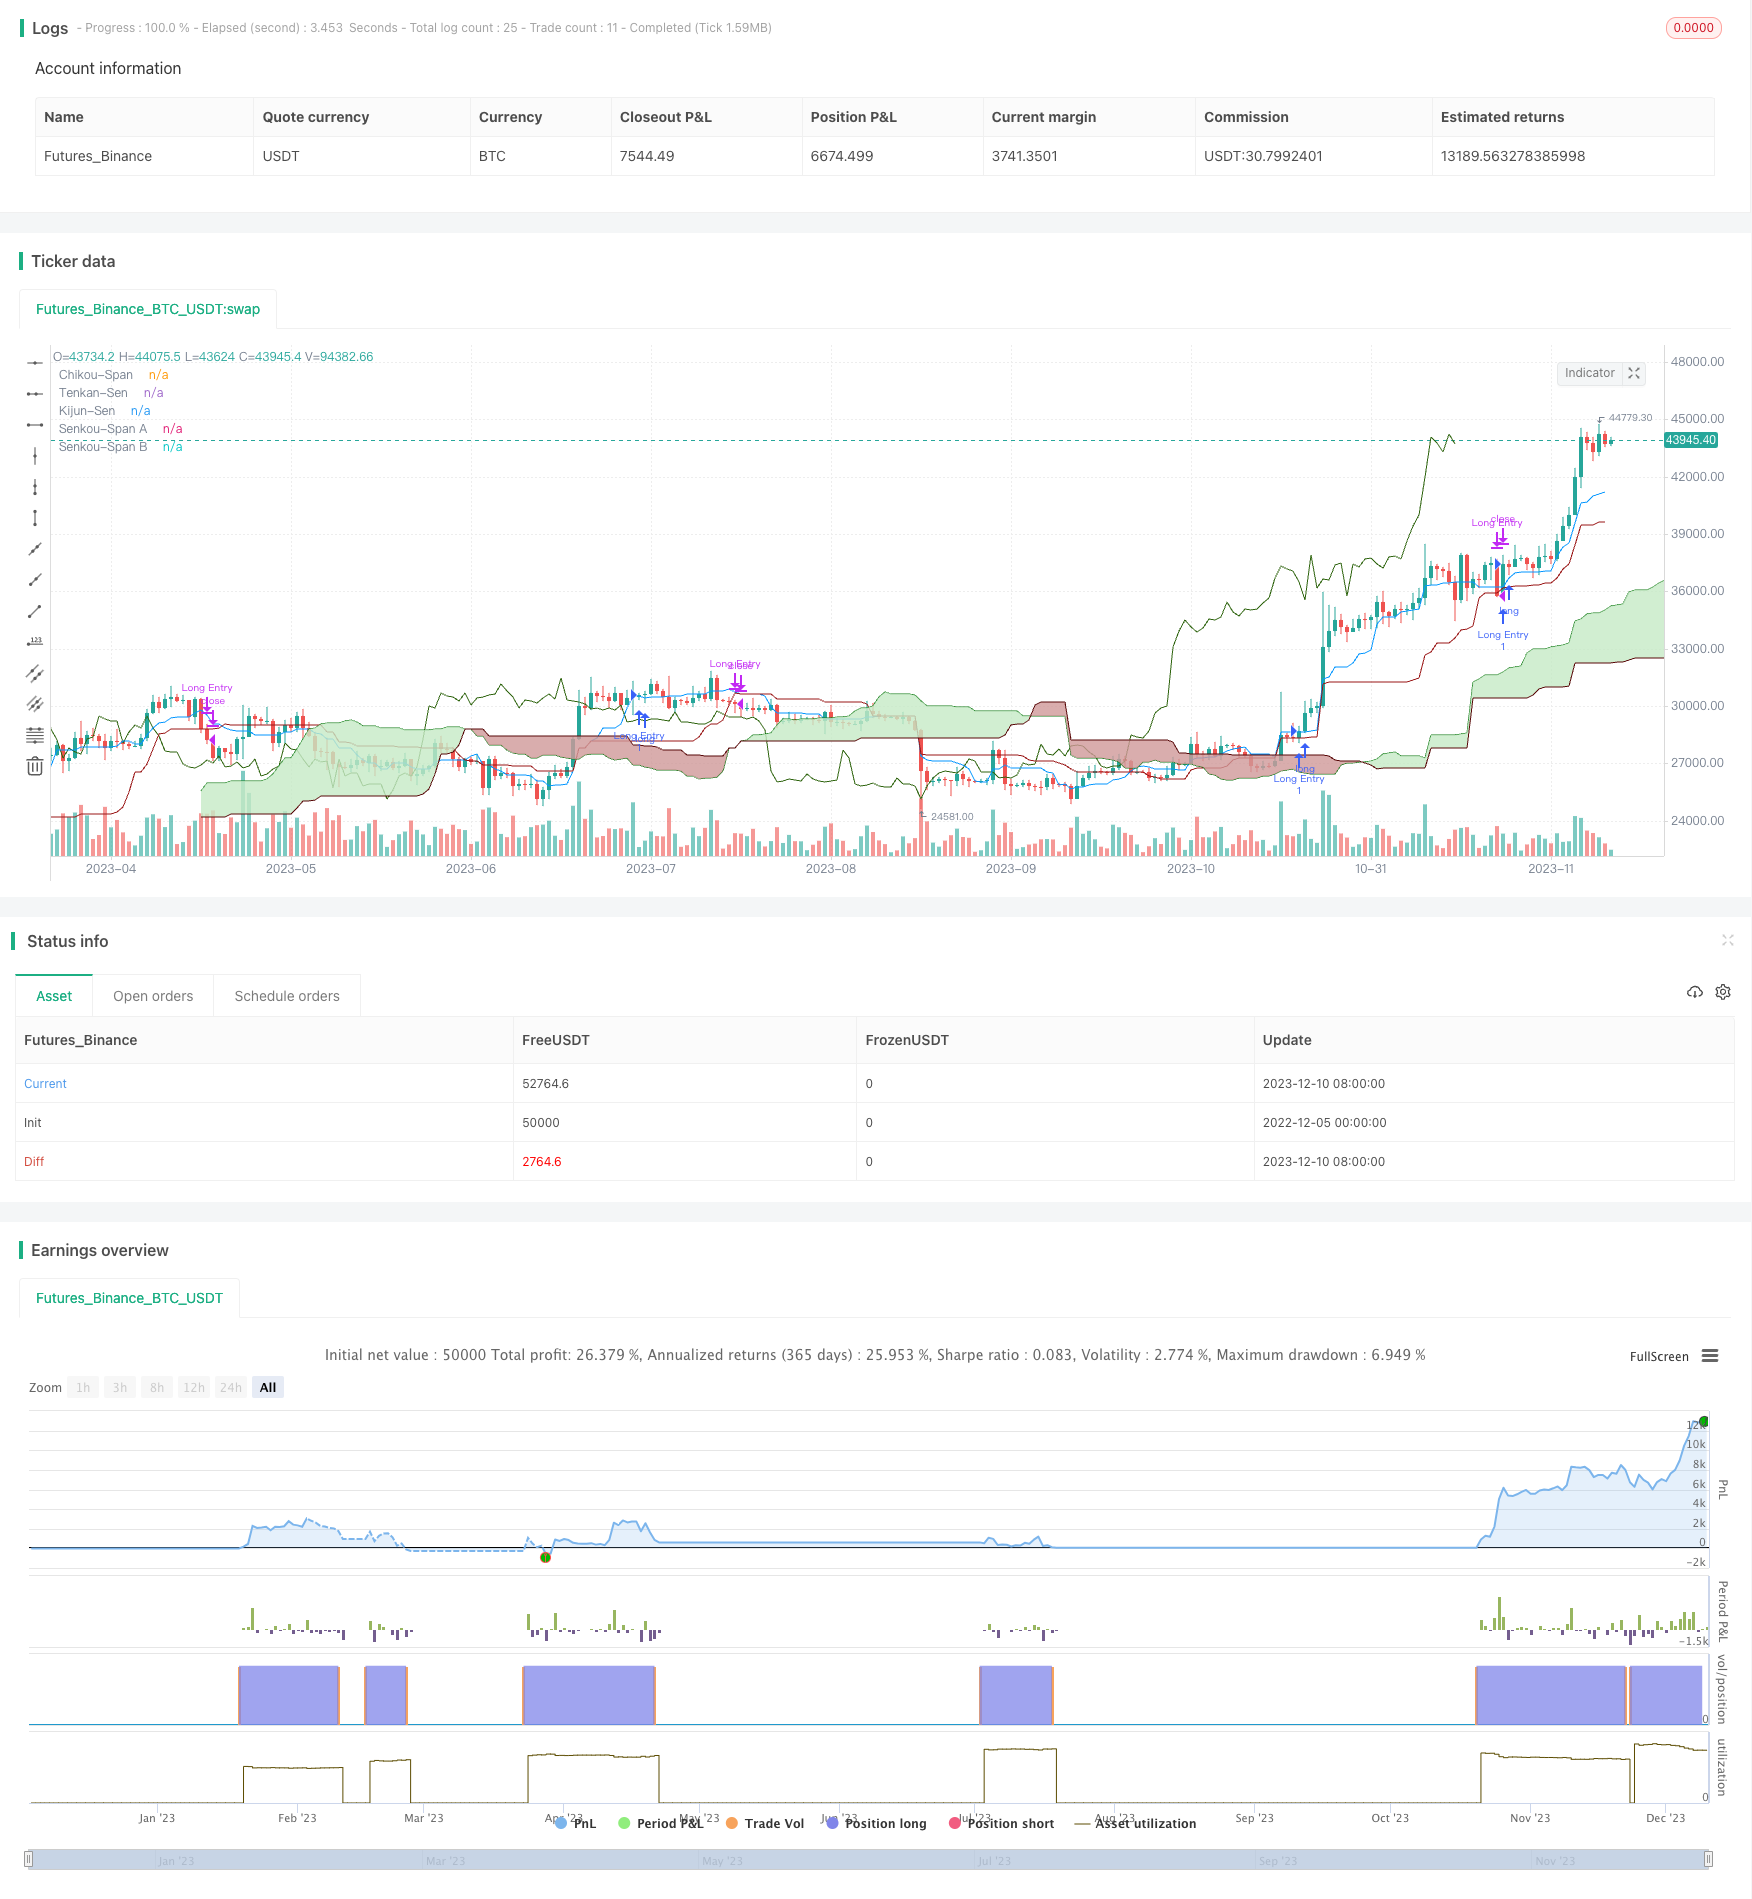
This is an Ichimoku Kinko Hyo indicator based long-only stock trading strategy. The strategy utilizes the basic principles of Ichimoku to determine entries and exits.
Overview
This is an Ichimoku Kinko Hyo indicator based long-only stock trading strategy. The strategy utilizes the basic principles of Ichimoku to determine entries and exits.
Strategy Logic
The strategy first calculates the components of Ichimoku, including Tenkan-Sen, Kijun-Sen, Senkou Span A, and Senkou Span B.
Long entry if the following conditions are met:
- Tenkan cross above Kijun, indicating short term MA cross above long term MA, which is a golden cross signal
- Price above Kumo cloud, indicating the price finds support and starts to rise
- Future Kumo is red, indicating future trend is up
- Price distance from Tenkan < 2 x ATR, indicating price is not overextended for chase strategy
- Price distance from Kijun < 3 x ATR, indicating price is not overextended for chase strategy
- Tenkan and Kijun above Kumo cloud, indicating Ichimoku trend is up
Exit if the following conditions are met:
- Tenkan cross below Kijun, indicating dead cross
- Price penetration Kumo cloud, indicating loss of support
- Profit > 30%, implementing profit taking strategy
- Loss > 3%, implementing stop loss strategy
Advantage Analysis
- Utilize Ichimoku to determine price trend with high accuracy
- Incorporate ATR to control chasing, avoiding overbought and oversold
- Filter signals with multiple confirmations, avoiding false signals
- Add-on strategy could accelerate profit
Risk Analysis
- Ichimoku signals could lag, requiring confirmations from other indicators
- Wrong ATR parameters could lead to overbought and oversold
- Add-on strategy could increase loss risk
- Parameters need to be tuned manually for different stocks
Optimization Directions
- Incorporate other indicators like MACD, KDJ for signal confirmation
- Increase profit taking level, decrease stop loss level
- Auto tune ATR parameters based on historical data
- Research parameter differences for various sectors, build parameter pool
Summary
This is a very practical stock trading strategy, utilizing Ichimoku for trend and ATR for risk control, profiting from chase strategy with stop loss. The advantages are obvious. Further optimizations on parameters and combining indicators would make it even better for live trading.
Parameters
| Name | Default | What it controls |
|---|---|---|
| v_input_int_1 | 9 | Tenkan-Sen Period |
| v_input_int_2 | 26 | Kijun-Sen Period |
| v_input_int_3 | 52 | Senkou-Span B Period |
| v_input_int_4 | 26 | Chikou-Span Offset |
| v_input_int_5 | 26 | Senkou-Span Offset |
| v_input_int_6 | true | Start Date |
| v_input_int_7 | true | Start Month |
| v_input_int_8 | 1980 | Start Year |
| v_input_int_9 | true | En Date |
| v_input_int_10 | true | End Month |
| v_input_int_11 | 2100 | End Year |
Source Pine Script
/*backtest
start: 2022-12-05 00:00:00
end: 2023-12-11 00:00:00
period: 1d
basePeriod: 1h
exchanges: [{"eid":"Futures_Binance","currency":"BTC_USDT"}]
*/

// Author Obarut
//@version=5
strategy("İchimoku Strategy With Money Management",overlay=true)

//Inputs
ts_period = input.int(9, minval=1, title="Tenkan-Sen Period")
ks_period = input.int(26, minval=1, title="Kijun-Sen Period")
ssb_period = input.int(52, minval=1, title="Senkou-Span B Period")
cs_offset = input.int(26, minval=1, title="Chikou-Span Offset")
ss_offset = input.int(26, minval=1, title="Senkou-Span Offset")


// Back Testing Period

fromday = input.int(defval=1,title="Start Date",minval=1,maxval=31)
frommonth = input.int(defval=1,title="Start Month",minval=1,maxval=12)
fromyear = input.int(defval=1980,title="Start Year",minval=1800, maxval=2100)
today = input.int(defval=1,title="En Date",minval=1,maxval=31)
tomonth = input.int(defval=1,title="End Month",minval=1,maxval=12)
toyear =input.int(defval=2100,title="End Year",minval=1800,maxval=2200)


start=timestamp(fromyear,frommonth,fromday,00,00)
finish=timestamp(toyear,tomonth,today,00,00)
timewindow= time>=start and time<=finish

middle(len) => math.avg(ta.lowest(len), ta.highest(len))

// Ichimoku Components

tenkan = middle(ts_period)
kijun = middle(ks_period)
senkouA = math.avg(tenkan, kijun)
senkouB = middle(ssb_period)


atr = ta.atr(14)
ss_above = math.max(senkouA[ss_offset-1], senkouB[ss_offset-1])
ss_below = math.min(senkouA[ss_offset-1], senkouB[ss_offset-1])

// Price Distance From Tenkan

distance = close - tenkan

// Price Distance from Kijun

distancek = close - kijun

// Entry/Exit Signals

tk_cross_kijun_bull = tenkan >= kijun
tk_cross_kijun_bear = tenkan <= kijun
cs_cross_bull = ta.mom(close, cs_offset-1) > 0
cs_cross_bear = ta.mom(close, cs_offset-1) < 0
price_above_kumo = close > ss_above
pbsenkA = close < ss_above
pasenkB = close > ss_below
price_below_kumo = close < ss_above
future_kumo_bull = senkouA > senkouB
future_kumo_bear = senkouA < senkouB
// Price Distance From Tenken
disbull = distance < 2*atr
//Price Distance From Kijun
disbullk = distancek < 3*atr
//Price Above Tenkan Condition
patk = close > tenkan
// Kijun Above Senkou Span Condition
kjasenkA = kijun > ss_above
// Price Below Kijun Condition
pbkijun = close < kijun

//Bullish Condition

bullish= tk_cross_kijun_bull and cs_cross_bull and price_above_kumo and future_kumo_bull and patk and disbull and disbullk
     and (tenkan>ss_above) and (kijun>ss_above)

if(bullish and timewindow )
    strategy.entry("Long Entry", strategy.long)

// Bearish Condition

bearish=tk_cross_kijun_bear and pbsenkA and cs_cross_bear
      or pbkijun or price_below_kumo

lastentryprice = strategy.opentrades.entry_price(strategy.opentrades - 1)

// Take Profit or Stop Loss in Bearish

if(bearish and timewindow or (close>1.30*lastentryprice and close<kijun ) or (close< 0.93*lastentryprice))
    strategy.close("Long Entry")


if(time>finish)
    strategy.close_all("time up")


plot(tenkan, color=#0496ff, title="Tenkan-Sen")
plot(kijun, color=#991515, title="Kijun-Sen")
plot(close, offset=-cs_offset+1, color=#2e640e, title="Chikou-Span")
sa=plot(senkouA, offset=ss_offset-1, color=color.rgb(17, 122, 21), title="Senkou-Span A")
sb=plot(senkouB, offset=ss_offset-1, color=color.rgb(88, 8, 8), title="Senkou-Span B")
fill(sa, sb, color = senkouA > senkouB ? color.rgb(198, 234, 198) : color.rgb(208, 153, 153), title="Cloud color")Published by ChaoZhang on the FMZ strategy square · last modified 2023-12-12. Collected in the Quant Trading Vault. Unvalidated research: re-test with your own data and costs before trusting it.
Build this with AgenKit
A spec is not a trading system. Paste this into your coding agent and AgenKit runs a specialist team — architecture, test-first build, risk gates, review — with paper trading on by default.
/agenkit build a production-grade trading bot with a backtest engine, risk controls and paper trading by default from strategies/Ichimoku-Trading-Strategy-With-Money-Management.md- npx agenkit install engineering-kit in your project
- Paste the command into your agent and approve each phase
- Get tests, backtest, risk controls and a paper-trading switch
Understand it first
Before you run this, read the lesson behind the idea and how to backtest it honestly. Specs like this one are the survivors of an unknown number of trials; deflate their results accordingly.
Related specs
- Dynamic Adaptive Multi Timeframe Trend Following and Range Reversal Hybrid StrategyPine Script · Mean reversion · 2d
- Dynamic MACD and Ichimoku Cloud Trading StrategyPine Script · Mean reversion · 1h
- Multi Indicator Scoring Trading StrategyPine Script · Mean reversion · 1d
- Kijun Loopback StrategyPine Script · Mean reversion · 1h
- ATR and EMA based Dynamic Take Profit and Stop Loss Adaptive StrategyPine Script · Mean reversion · 1h
- Advanced Quantitative Trend Following and Cloud Reversal Composite Trading StrategyPine Script · Mean reversion · 1d