Strategy vault / Trend following
Ichimoku Trend Following Strategy
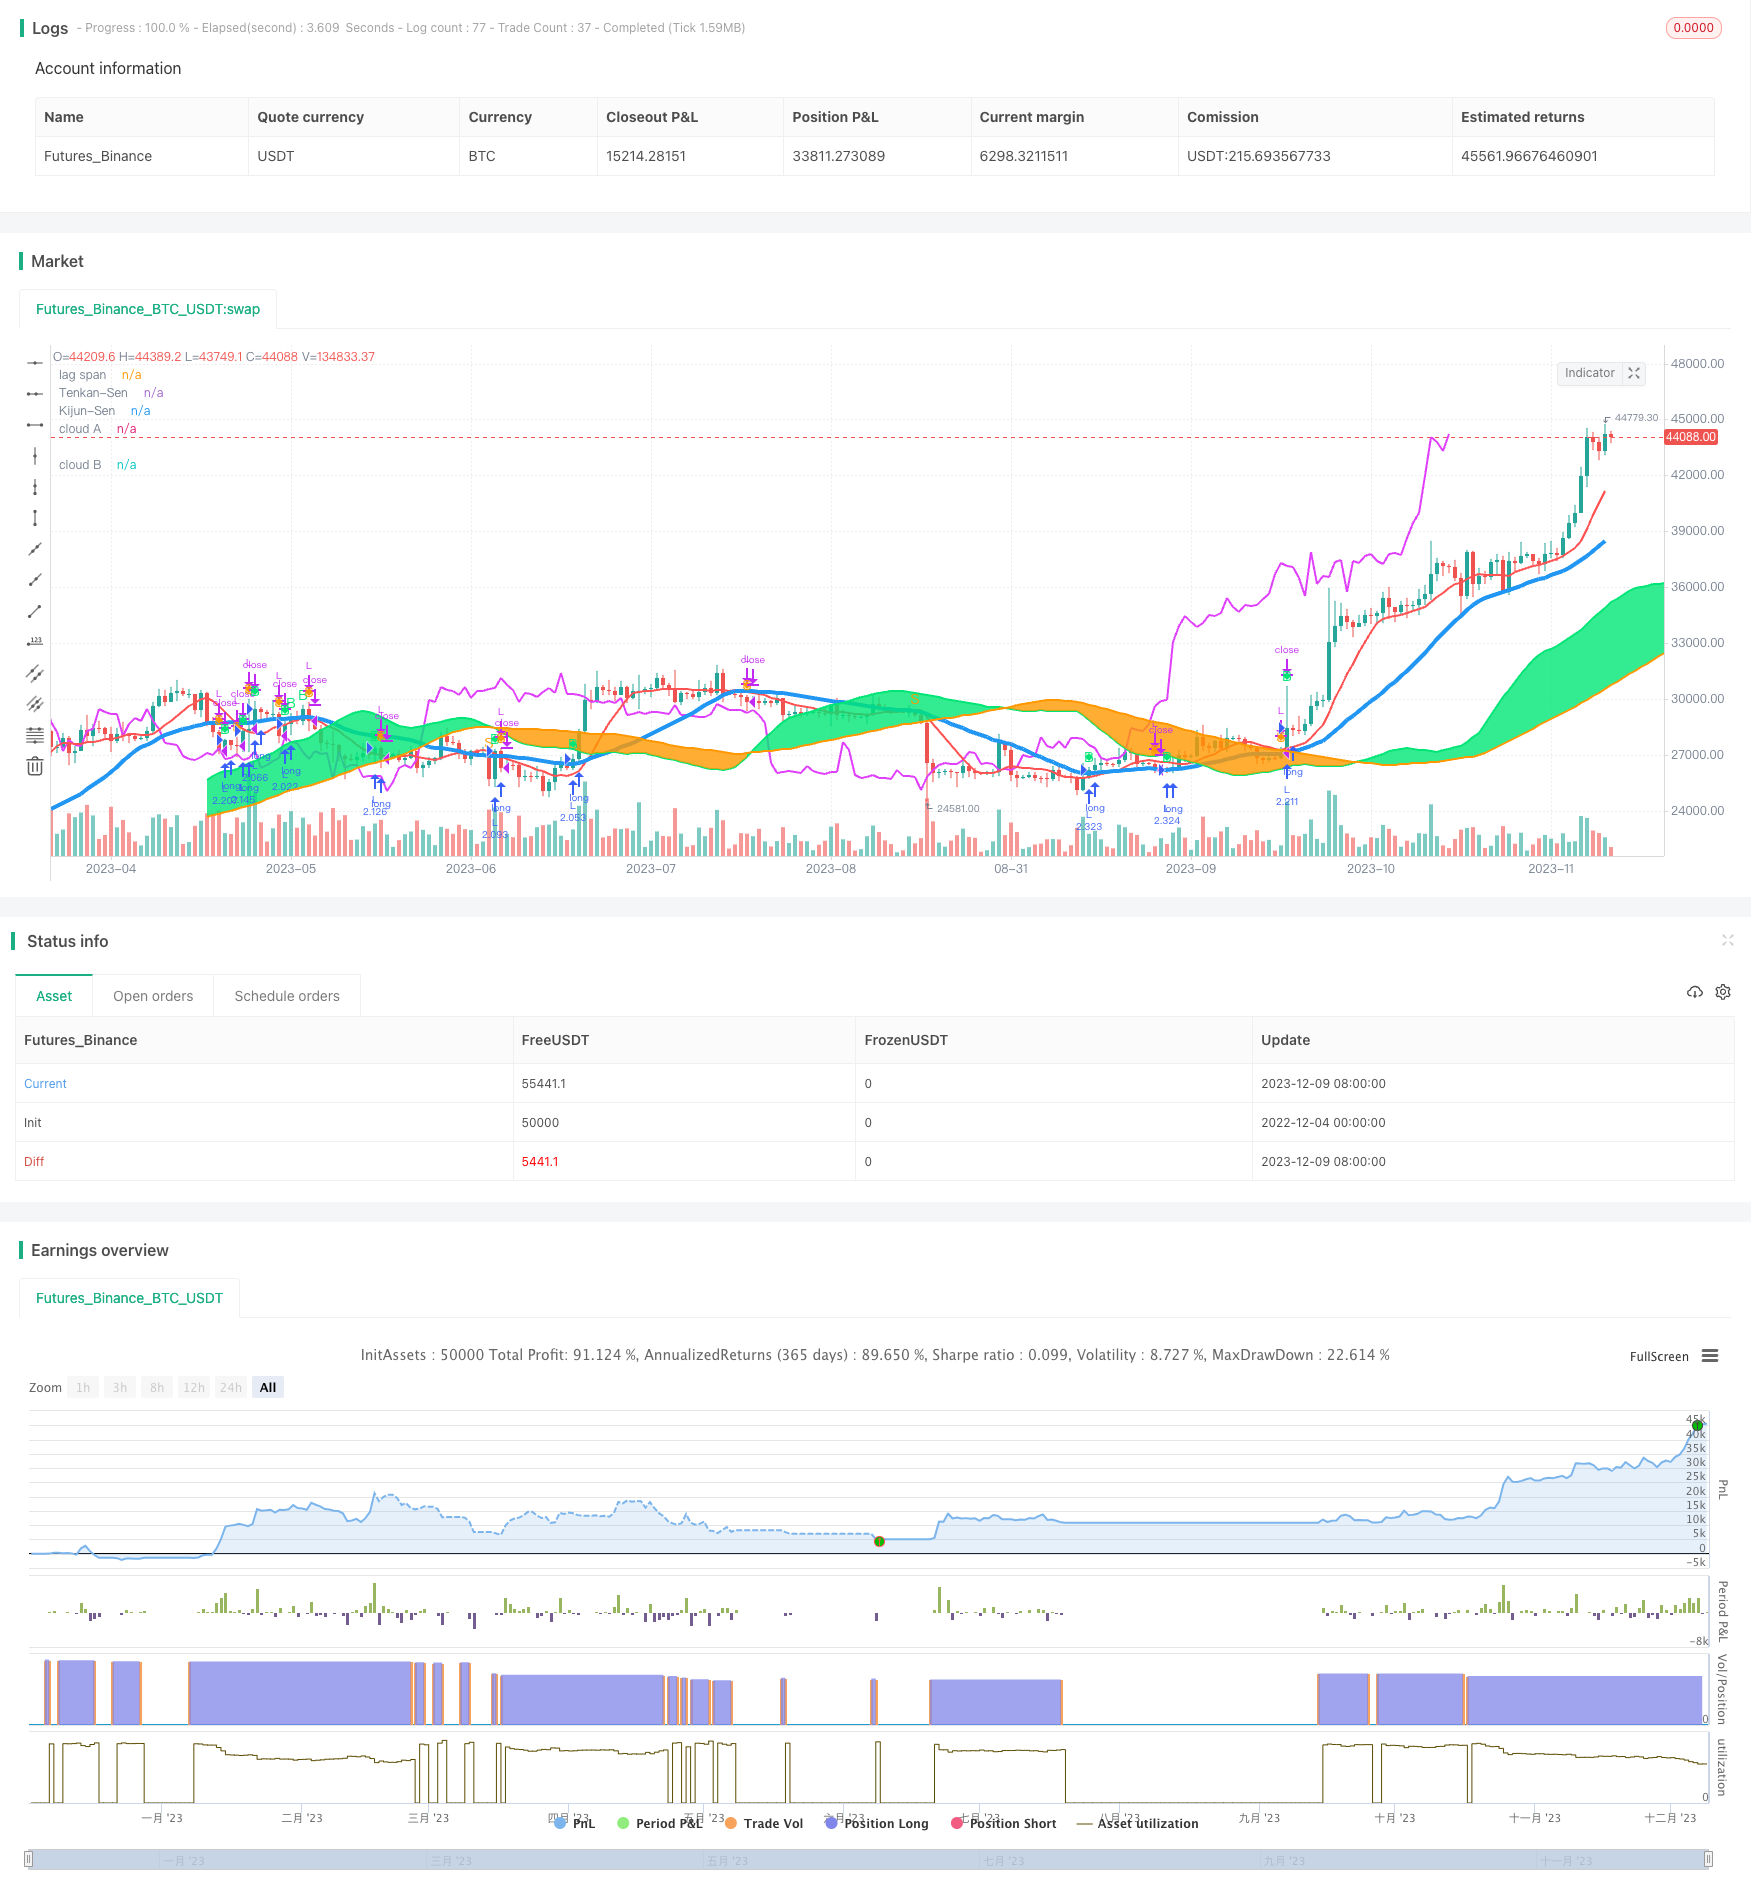
This strategy is designed based on the Ichimoku indicator for trend following and equilibrium breakout trading, aiming to capture medium-to-long term price trends for steady profits.
Overview
This strategy is designed based on the Ichimoku indicator for trend following and equilibrium breakout trading, aiming to capture medium-to-long term price trends for steady profits.
Strategy Logic
The strategy utilizes the five lines of Ichimoku - Tenkan-sen, Kijun-sen, Senkou Span A, Senkou Span B and Chikou Span to determine price trend and support/resistance levels. The specific entry rules are:
- When the close crosses over Kijun-sen and Kijun-sen is not flat, a buy signal is triggered.
- When the close crosses under Kijun-sen and Kijun-sen is not flat, a sell signal is triggered.
- When the close is above the cloud, the liquidity is good for taking positions.
- When the close is below the cloud, the liquidity is low and taking positions should be avoided.
- When Chikou Span crosses over the close, a buy signal is triggered.
- When Chikou Span crosses under the close, a sell signal is triggered.
The above trading signals are combined to determine the final entry timing.
Advantage Analysis
The advantages of this strategy include:
- Using Ichimoku to determine trend can filter out market noise and capture medium-to-long term trends.
- Incorporating cloud condition avoids taking positions in poor liquidity.
- Chikou Span acts as confirmation to avoid false breakout.
- The rules are simple and clear for implementation.
Risk Analysis
The risks of this strategy involve:
- Inappropriate parameter settings may lead to missing trading opportunities.
- Trend judgment may lag when trend mutates, unable to cut loss in time.
- Higher loss risk for long positions.
These risks can be addressed by optimizing parameters, combining with other indicators to determine trend change, and strict stop loss.
Optimization Directions
The strategy can be further optimized from the following aspects:
- Optimize Ichimoku parameters to find the best combination.
- Add price & volume filters to avoid trend deviation.
- Incorporate volatility indicators to identify reversal points.
- Add machine learning models to determine trend status.
Summary
This strategy leverages Ichimoku to determine price trend and liquidity conditions for trend following, which can effectively filter out noise and capture medium-to-long term trends with smaller drawdowns. Further optimizations on parameter tuning, adding auxiliary filters, and identifying trend reversal signals can improve the strategy's Profit Factor.
Parameters
| Name | Default | What it controls |
|---|---|---|
| v_input_1 | true | From Month |
| v_input_2 | true | From Day |
| v_input_3 | 2017 | From Year |
| v_input_4 | true | To Month |
| v_input_5 | true | To Day |
| v_input_6 | 9999 | To Year |
| v_input_7 | 6 | KijunSen Lag |
Source Pine Script
/*backtest
start: 2022-12-04 00:00:00
end: 2023-12-10 00:00:00
period: 1d
basePeriod: 1h
exchanges: [{"eid":"Futures_Binance","currency":"BTC_USDT"}]
*/

//@version=3
strategy("My Ichimoku Strat", overlay=true,default_qty_type=strategy.percent_of_equity, default_qty_value=100, initial_capital=1000, currency=currency.EUR)
// === BACKTEST RANGE ===
FromMonth = input(defval = 1, title = "From Month", minval = 1)
FromDay   = input(defval = 1, title = "From Day", minval = 1)
FromYear  = input(defval = 2017, title = "From Year", minval = 2014)
ToMonth   = input(defval = 1, title = "To Month", minval = 1)
ToDay     = input(defval = 1, title = "To Day", minval = 1)
ToYear    = input(defval = 9999, title = "To Year", minval = 2014)

// === SERIES SETUP ===
//**** Inputs *******
KijunSenLag = input(6,title="KijunSen Lag",minval=1)

//Kijun-sen
//Support resistance line, buy signal when price crosses it
KijunSen = sma((high+low)/2,26)
buy2 = crossover(close,KijunSen) and (rising(KijunSen,KijunSenLag) or falling(KijunSen,KijunSenLag))
sell2= crossunder(close,KijunSen) and (rising(KijunSen,KijunSenLag) or falling(KijunSen,KijunSenLag))


//Tenkan-Sen
TenkanSen = sma((high+low)/2,9)

//Senkou Span A
SenkouSpanA = (KijunSen + TenkanSen)/2

//Senkou Span B
SenkouSpanB = sma((high+low)/2,52)

//Cloud conditions : ignore buy if price is under the cloud
// Huge cloud means safe support and resistance. Little cloud means danger.
buy3 = close > SenkouSpanA and close > SenkouSpanB
sell3 = close < SenkouSpanA and close < SenkouSpanB


//Chikou Span
//Buy signal : crossover(ChikouSpan,close)
//Sell Signal : crossunder(ChikouSpan,close)
ChikouSpan = close
buy1=crossover(ChikouSpan,close[26])
sell1=crossunder(ChikouSpan,close[26])

plotshape(buy1,style=shape.diamond,color=lime,size=size.small)
plotshape(sell1,style=shape.diamond,color=orange,size=size.small)

//Alerts

buyCompteur = -1
buyCompteur := nz(buyCompteur[1],-1)
buyCompteur := buy2 or buy3 ? 1 : buyCompteur
buyCompteur := buyCompteur > 0 ? buyCompteur + 1 : buyCompteur
buyCompteur := sell2 or sell3 ? -1 : buyCompteur

sellCompteur = -1
sellCompteur := nz(sellCompteur[1],-1)
sellCompteur := sell2 or sell3 ? 1 : sellCompteur
sellCompteur := sellCompteur > 0 ? sellCompteur + 1 : sellCompteur
sellCompteur := buy2 or buy3 ? -1 : sellCompteur

sell= sell2 and sell3 or (sell1 and buyCompteur <= 8)
buy=buy2 and buy3 or (buy1 and sellCompteur <=8)
plotchar(buy,char='B',size=size.small,color=lime)
plotchar(sell,char='S',size=size.small,color=orange)

//plots
plot(KijunSen,title="Kijun-Sen",color=blue,linewidth=4)
plot(TenkanSen,title="Tenkan-Sen",color=red,linewidth=2)
cloudA = plot(SenkouSpanA,title="cloud A", color=lime,offset=26,linewidth=2)
cloudB = plot(SenkouSpanB,title="cloud B", color=orange,offset=26,linewidth=2)
plot(ChikouSpan,title="lag span",color=fuchsia, linewidth=2,offset=-26)
//plot()
fill(cloudA,cloudB,color=SenkouSpanA>SenkouSpanB?lime:orange)
//plot(close,color=silver,linewidth=4)

// === ALERTS ===
strategy.entry("L", strategy.long, when=(buy and (time > timestamp(FromYear, FromMonth, FromDay, 00, 00)) and (time < timestamp(ToYear, ToMonth, ToDay, 23, 59))))
strategy.close("L", when=(sell and (time < timestamp(ToYear, ToMonth, ToDay, 23, 59))))Published by ChaoZhang on the FMZ strategy square · last modified 2023-12-11. Collected in the Quant Trading Vault. Unvalidated research: re-test with your own data and costs before trusting it.
Build this with AgenKit
A spec is not a trading system. Paste this into your coding agent and AgenKit runs a specialist team — architecture, test-first build, risk gates, review — with paper trading on by default.
/agenkit build a production-grade trading bot with a backtest engine, risk controls and paper trading by default from strategies/Ichimoku-Trend-Following-Strategy.md- npx agenkit install engineering-kit in your project
- Paste the command into your agent and approve each phase
- Get tests, backtest, risk controls and a paper-trading switch
Understand it first
Before you run this, read the lesson behind the idea and how to backtest it honestly. Specs like this one are the survivors of an unknown number of trials; deflate their results accordingly.
Related specs
- EMA SMA Trend Following with Swing Trading Strategy Combined Volume Filter and Percentage Take Profit Stop Loss SystemPine Script · Trend following · 1d
- Fixed Range Volume Profile And Anchored VWAP Trend Identification Strategy With Dynamic Stop LossPine Script · Trend following · 1h
- Multi Factor Trend Price Action Strategy with Dynamic Risk Management SystemPine Script · Trend following · 2h
- Trend Detection Strategy Based on Gaussian Channel and Stochastic RSI FilterPine Script · Trend following · 1h
- Triple Supertrend Ichimoku Cloud Quantitative Trading StrategyPine Script · Trend following · 1d
- Ichimoku Kinko Hyo Cross StrategyPine Script · Trend following · 1h