Strategy vault / Market making
Institutional Market Maker Tracking Strategy with Dynamic Cost Averaging and Liquidity Flow Analysis
This strategy is a trading system based on market maker behavior and institutional-level liquidity analysis. It identifies high-probability trading opportunities by tracking market liquidity indicators, order book…
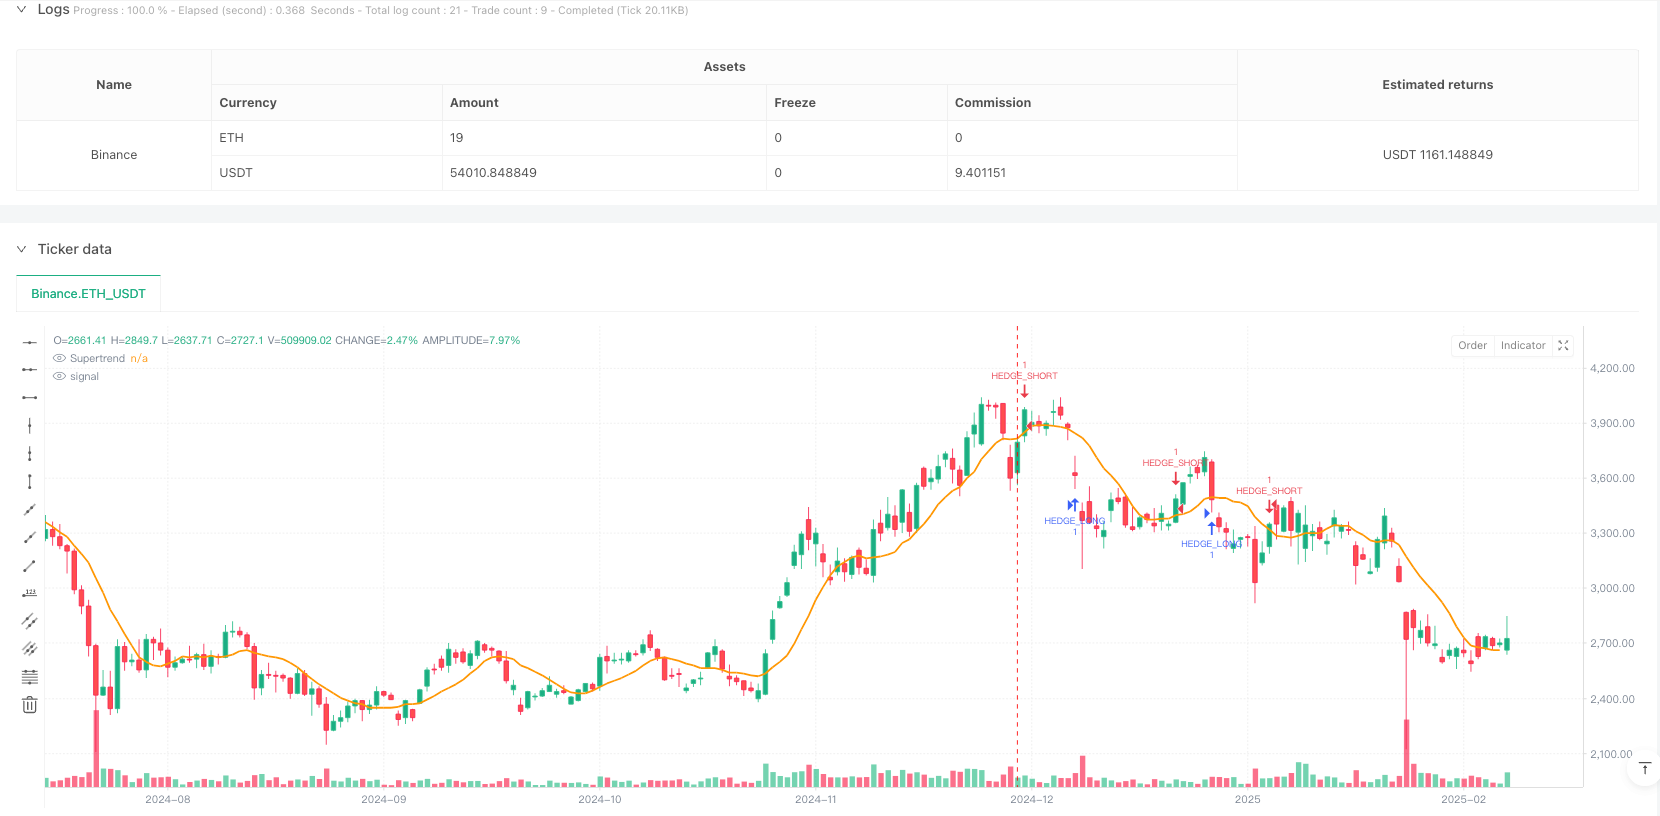
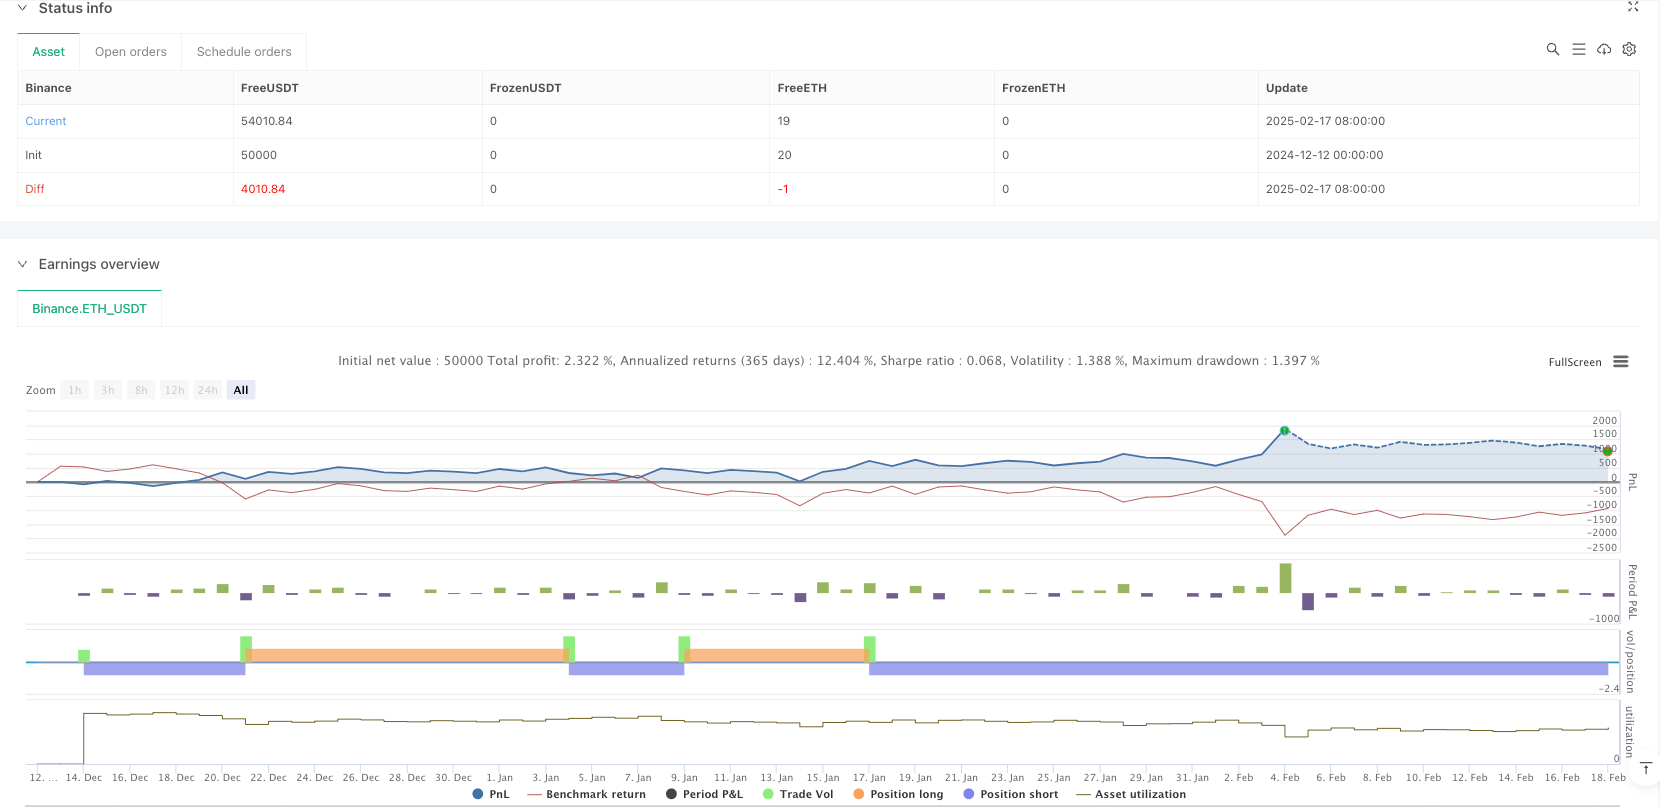
Overview
This strategy is a trading system based on market maker behavior and institutional-level liquidity analysis. It identifies high-probability trading opportunities by tracking market liquidity indicators, order book imbalances, and market maker footprints. The strategy combines Dynamic Cost Averaging (DCAA) with a hedge flow system to minimize risks and maximize returns. The system completely abandons traditional technical indicators in favor of institutional-level market microstructure analysis.
Strategy Principles
The core of the strategy is tracking market maker behavior through multi-dimensional data:
- Using VWAP (Volume Weighted Average Price) to confirm institutional absorption/distribution positions
- Analyzing CVD (Cumulative Volume Delta) to detect actual strength comparison between bulls and bears
- Combining order book data to identify liquidity traps and stop-loss hunting zones
- Implementing dynamic cost averaging method to establish staged position building at key support levels
- Utilizing a hedging system for risk management during extreme market volatility
Strategy Advantages
- Entirely based on market microstructure, avoiding the lag of technical indicators
- Ability to predict large price movements in advance through market maker behavior analysis
- Dynamic cost averaging system enables gradual position building during downtrends, reducing overall position cost
- Hedging system provides additional risk protection, especially during periods of extreme market volatility
- Strategy can adapt to market conditions in real-time, not relying on static support/resistance levels
Strategy Risks
- Requires high-quality real-time market data, sensitive to data latency
- May struggle to accurately judge market maker intentions during extremely low liquidity periods
- Over-reliance on market maker behavior analysis may lead to false signals under certain market conditions
- Dynamic cost averaging system may accumulate significant losses in continuously declining markets
- Hedging strategy costs may erode profits in ranging markets
Optimization Directions
- Introduce machine learning algorithms to improve market maker behavior identification accuracy
- Optimize capital allocation ratios in the dynamic cost averaging system
- Add more market microstructure indicators to enhance signal reliability
- Develop adaptive hedge ratio adjustment mechanisms
- Establish more comprehensive risk control systems, especially under extreme market conditions
Summary
This is an institutional-grade trading strategy built on market microstructure foundations. Through deep analysis of market maker behavior, combined with dynamic cost averaging and hedging systems, the strategy maintains stability across different market environments. While implementation faces some technical and operational challenges, its core concepts and methodology have solid market microstructure foundations, showing potential for long-term stable profitability.
Source Pine Script
/*backtest
start: 2024-12-12 00:00:00
end: 2025-02-18 08:00:00
period: 1d
basePeriod: 1d
exchanges: [{"eid":"Binance","currency":"ETH_USDT"}]
*/

//@version=6
strategy("EDGE Market Maker Strategy – DCAA & HedgeFlow", overlay=true)

// ✅ Import Indicators
vwapLine = ta.vwap
superTrend = ta.sma(close, 10)  // Replace with actual Supertrend formula if needed
volData = volume // Volume from current timeframe
cvdData = ta.cum(close - close[1]) // Approximation of CVD (Cumulative Volume Delta)
orderBlockHigh = ta.highest(high, 20) // Approximate Order Block Detection
orderBlockLow = ta.lowest(low, 20)

// ✅ Market Maker Buy Conditions
longCondition = ta.crossover(close, vwapLine) and cvdData > cvdData[1] and volData > volData[1]
if longCondition
    strategy.entry("BUY", strategy.long)

// ✅ Market Maker Sell Conditions
shortCondition = ta.crossunder(close, vwapLine) and cvdData < cvdData[1] and volData > volData[1]
if shortCondition
    strategy.entry("SELL", strategy.short)

// ✅ Order Block Confirmation (For Stronger Signals)
longOB = longCondition and close > orderBlockHigh
shortOB = shortCondition and close < orderBlockLow

if longOB
    label.new(bar_index, high, "BUY (Order Block)", color=color.green, textcolor=color.white, style=label.style_label_down)

if shortOB
    label.new(bar_index, low, "SELL (Order Block)", color=color.red, textcolor=color.white, style=label.style_label_up)

// ✅ DCAA Levels – Adaptive Re-Entry Strategy
dcaaBuy1 = close * 0.97  // First re-entry for long position (3% drop)
dcaaBuy2 = close * 0.94  // Second re-entry for long position (6% drop)
dcaaSell1 = close * 1.03 // First re-entry for short position (3% rise)
dcaaSell2 = close * 1.06 // Second re-entry for short position (6% rise)

if longCondition
    strategy.entry("DCAA_BUY_1", strategy.long, limit=dcaaBuy1)
    strategy.entry("DCAA_BUY_2", strategy.long, limit=dcaaBuy2)

if shortCondition
    strategy.entry("DCAA_SELL_1", strategy.short, limit=dcaaSell1)
    strategy.entry("DCAA_SELL_2", strategy.short, limit=dcaaSell2)

// ✅ HedgeFlow System – Dynamic Hedge Adjustments
hedgeLong = ta.crossunder(close, superTrend) and cvdData < cvdData[1] and volData > volData[1]
hedgeShort = ta.crossover(close, superTrend) and cvdData > cvdData[1] and volData > volData[1]

if hedgeLong
    strategy.entry("HEDGE_LONG", strategy.long)

if hedgeShort
    strategy.entry("HEDGE_SHORT", strategy.short)

// ✅ Take Profit & Stop Loss
tpLong = close * 1.05
tpShort = close * 0.95
slLong = close * 0.97
slShort = close * 1.03

strategy.exit("TP_Long", from_entry="BUY", limit=tpLong, stop=slLong)
strategy.exit("TP_Short", from_entry="SELL", limit=tpShort, stop=slShort)

// ✅ Plot VWAP & Supertrend for Reference
plot(vwapLine, title="VWAP", color=color.blue, linewidth=2)
plot(superTrend, title="Supertrend", color=color.orange, linewidth=2)Published by ianzeng123 on the FMZ strategy square · last modified 2025-02-27. Collected in the Quant Trading Vault. Unvalidated research: re-test with your own data and costs before trusting it.
Build this with AgenKit
A spec is not a trading system. Paste this into your coding agent and AgenKit runs a specialist team — architecture, test-first build, risk gates, review — with paper trading on by default.
/agenkit build a market making bot with inventory skew limits and order deduplication from strategies/Institutional-Market-Maker-Tracking-Strategy-with-Dynamic-Cost-Averaging-and-Liquidity-Flow-Analysis.md- npx agenkit install engineering-kit in your project
- Paste the command into your agent and approve each phase
- Get tests, backtest, risk controls and a paper-trading switch
Understand it first
Before you run this, read the lesson behind the idea and how to backtest it honestly. Specs like this one are the survivors of an unknown number of trials; deflate their results accordingly.
Related specs
- Trend Following Strategy Based on Support Resistance and Momentum Indicators Across Multiple TimeframesPine Script · Momentum · 1d
- Multi Indicator High Frequency Range Trading StrategyPine Script · Market making · 1d
- Cross Timeframe SuperTrend Breakout StrategyPine Script · Breakout · 1h
- Dynamic Spread Market Making StrategyPine Script · Market making
- Super Trend V StrategyPine Script · Trend following · 1d
- Trend Confirmation Tracking StrategyPine Script · Trend following · 1h