Strategy vault / Mean reversion
Intraday Hammer Reversal Pattern Long Strategy
This strategy uses the intraday hammer reversal pattern in combination with a subsequent green candle to find potential upside opportunities. When a hammer reversal pattern appears and the next candle is a green…
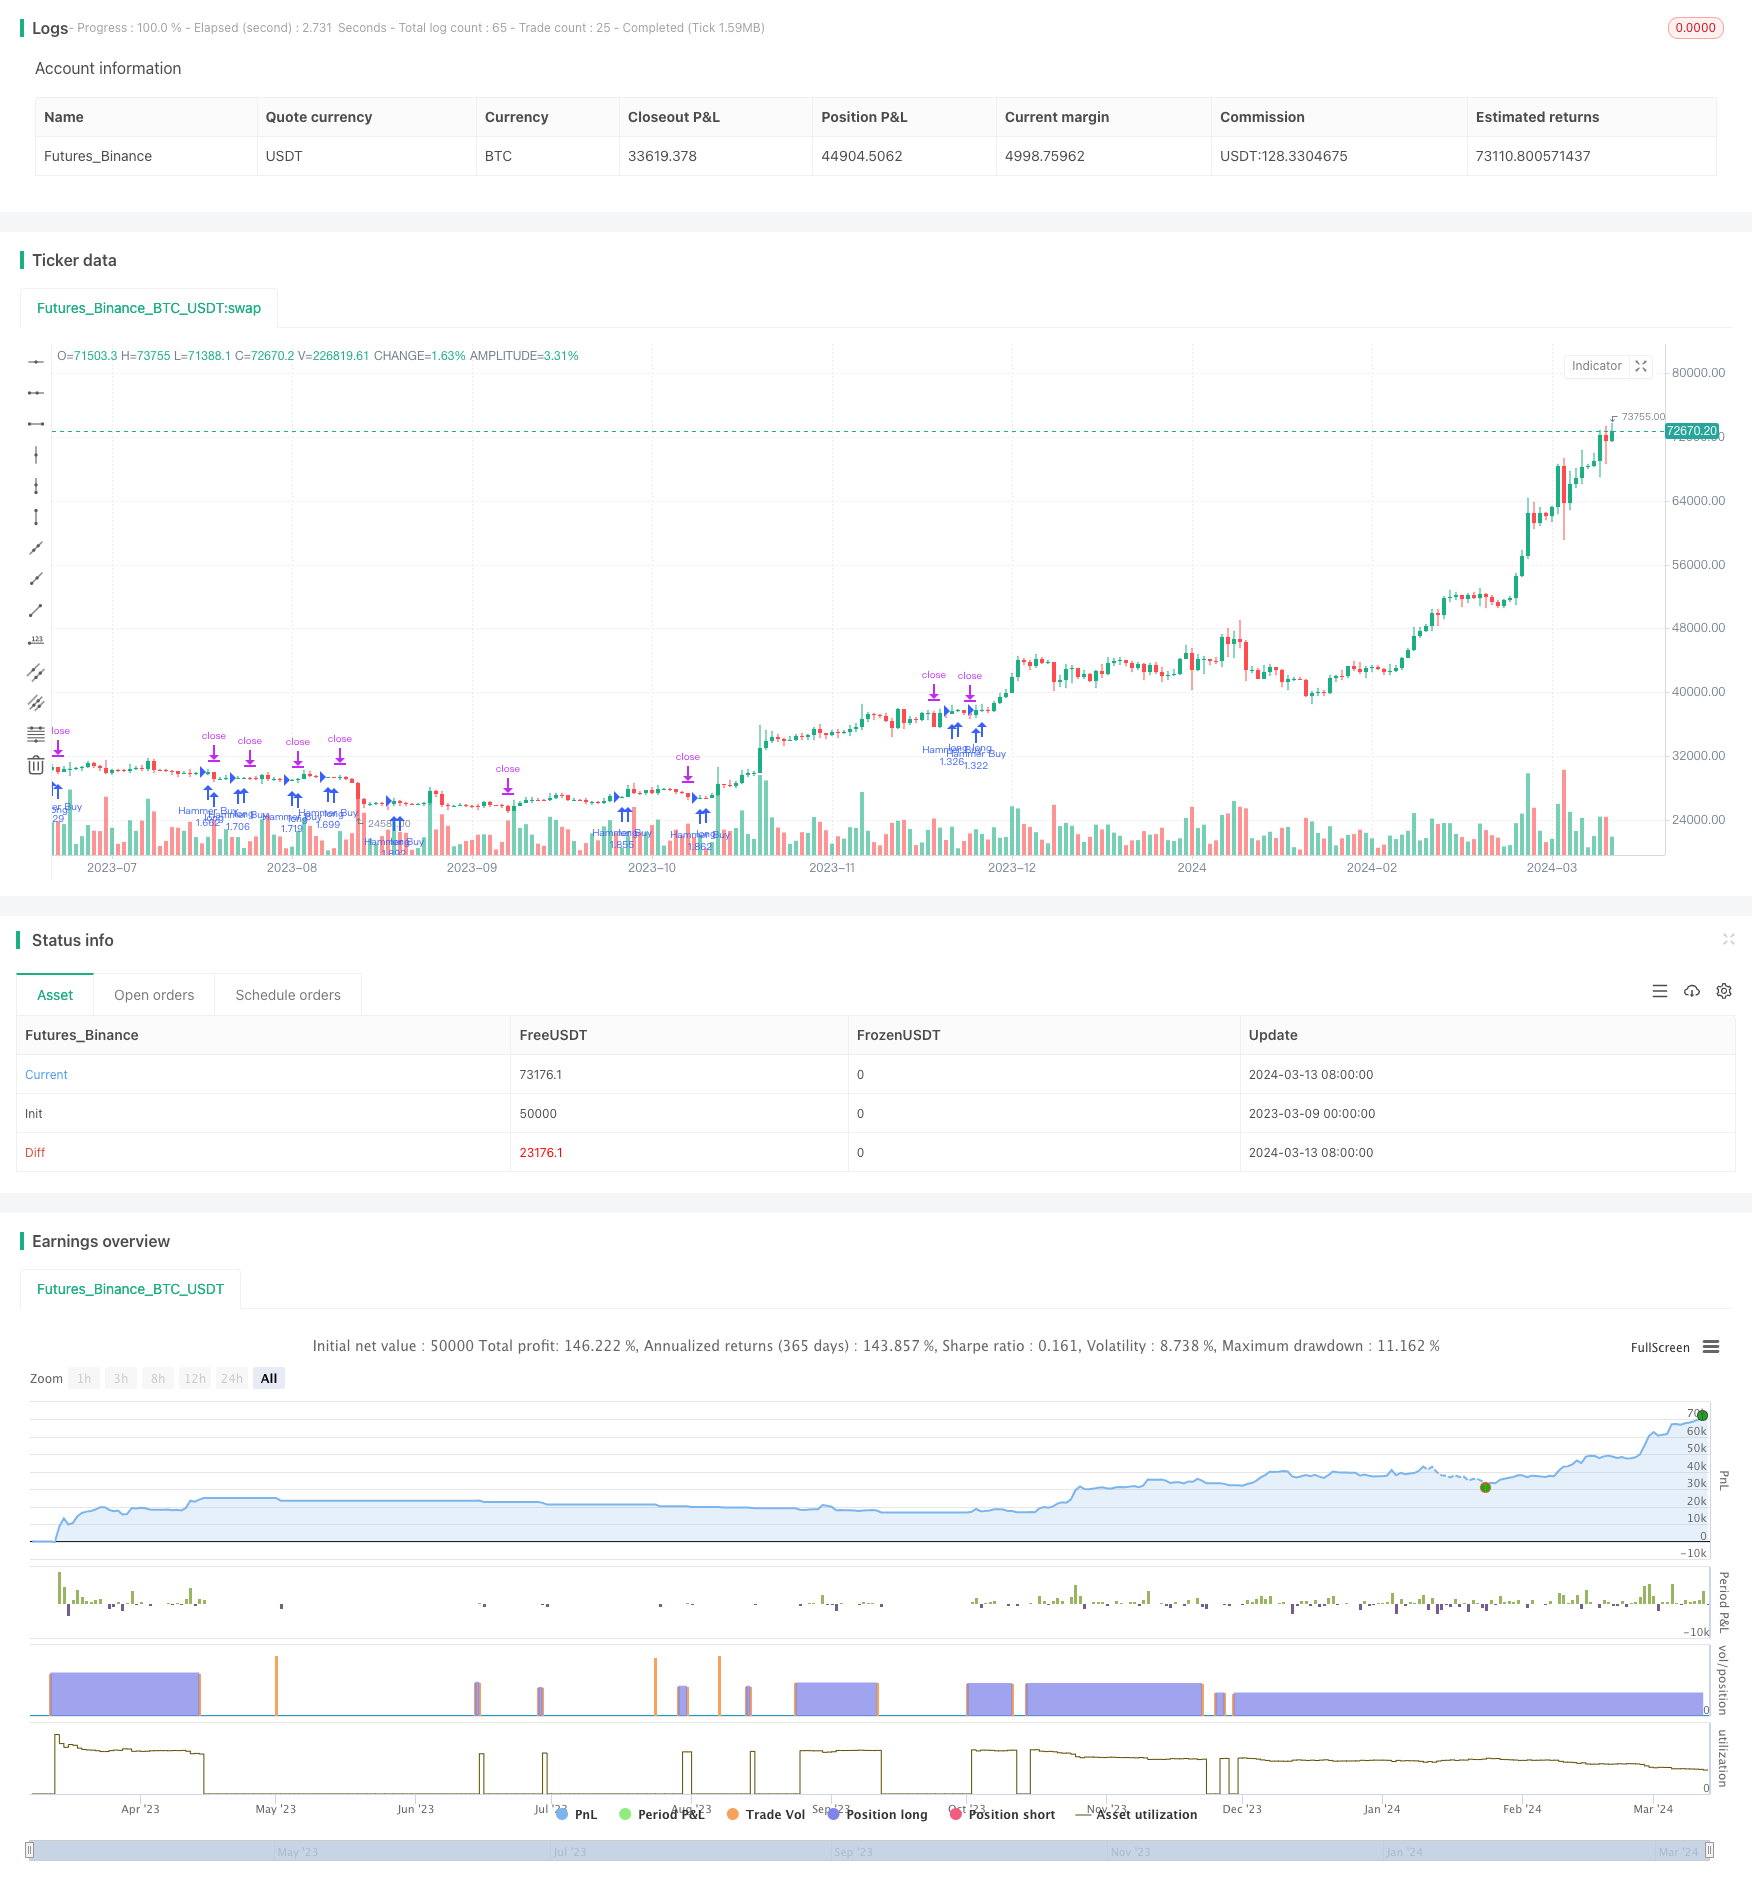
Overview
This strategy uses the intraday hammer reversal pattern in combination with a subsequent green candle to find potential upside opportunities. When a hammer reversal pattern appears and the next candle is a green upward candle, the strategy opens a long position. The stop loss is set at the low of the hammer candle, and the take profit is set at 1.5 times the entry price.
Strategy Principles
The hammer pattern is a common technical pattern that often appears at the end of a downtrend, signaling the arrival of a trend reversal. A typical hammer pattern has the following characteristics:
- The overall candle body is relatively small, usually less than 30% of the entire candle's high-low range.
- The lower shadow is long, at least twice the length of the candle body.
- The upper shadow is very short or nonexistent, at most not exceeding 1% of the candle's opening price.
When the hammer pattern is confirmed, if the next candle is a green upward candle and the low is higher than the low of the hammer candle, a bullish signal is formed and a long position is entered. The stop loss is set at the low of the hammer candle to control risk, and the take profit is set at 1.5 times the entry price to capture potential profits.
Advantage Analysis
- The hammer pattern is a common reversal pattern and has a high win rate when used in combination with trend context.
- Strict restrictions on the hammer pattern and subsequent bullish candle shape improve signal quality.
- Setting the stop loss at the low of the hammer candle makes risk controllable.
- Setting the take profit at 1.5R provides a decent risk-reward ratio.
Risk Analysis
- Even if the pattern and subsequent price action satisfy the strategy conditions, there is still a risk of the market repeating or continuing to fall.
- With the stop loss set close to the low of the hammer candle, a single loss is relatively large once triggered.
- Volatility is high in the early stages of a trend reversal, exposing the strategy to high price volatility risk.
Optimization Directions
- Consider introducing more technical indicators, such as RSI and MACD, to improve signal validity in combination with indicator status.
- The definitions of the hammer pattern and subsequent bullish candle can be further optimized, such as introducing more quantitative criteria.
- Take profit and stop loss settings can be further optimized, such as using dynamic take profit or trailing stop strategies.
- Consider market trend conditions, as hammer patterns found in uptrends may have higher win rates.
Summary
The intraday hammer reversal pattern long strategy makes full use of the reversal characteristics of the hammer pattern, combined with confirmation from a subsequent green candle, to form a bullish signal based on two consecutive candle patterns. At the same time, the strategy uses a fixed risk-reward ratio to control risk exposure and maintain a high risk-reward ratio. However, the strategy's definition of patterns is relatively simple and lacks verification from other technical indicators, which may face a high signal failure rate in practical applications. In addition, because the stop loss is set relatively close, the strategy also faces the problem of high single losses. In the future, the strategy can be further optimized and improved in terms of signal confirmation and risk control to enhance overall stability and profitability.
Source Pine Script
/*backtest
start: 2023-03-09 00:00:00
end: 2024-03-14 00:00:00
period: 1d
basePeriod: 1h
exchanges: [{"eid":"Futures_Binance","currency":"BTC_USDT"}]
*/

//@version=5
strategy("Hammer Pattern and Follow-Up Green Candle Strategy", overlay=true)

// Detecting a Hammer candle
isHammer() =>
    bodySize = math.abs(close[1] - open[1])
    lowerWickSize = open[1] - low[1]
    upperWickSize = high[1] - open[1] // For a red candle, the upper wick is from the open to the high
    bodyIsSmall = bodySize <= (high[1] - low[1]) * 0.3 // Body is less than 30% of the entire candle range
    lowerWickIsLong = lowerWickSize >= bodySize * 2 // Lower wick is at least twice the body length
    noUpperWick = upperWickSize == 0 or high[1] <= open[1] * 1.01 // No upper wick or very small
    close[1] < open[1] and bodyIsSmall and lowerWickIsLong and noUpperWick

// Check if the current candle is green with no or small tail
isGreenWithNoSmallTail() =>
    close > open

// Entry condition
entryCondition = isHammer() and isGreenWithNoSmallTail() and low >low[1]

// Calculate stop loss and take profit levels
stopLossLevel = low[1]
profitTargetLevel = close * 1.5
//Calculate position bodySize
positionSize = 50000 / close

// Execute strategy
if (entryCondition)
    strategy.entry("Hammer Buy", strategy.long,qty=positionSize)
    strategy.exit("Take Profit / Stop Loss", "Hammer Buy", stop=stopLossLevel, limit=profitTargetLevel)
Published by ChaoZhang on the FMZ strategy square · last modified 2024-03-15. Collected in the Quant Trading Vault. Unvalidated research: re-test with your own data and costs before trusting it.
Build this with AgenKit
A spec is not a trading system. Paste this into your coding agent and AgenKit runs a specialist team — architecture, test-first build, risk gates, review — with paper trading on by default.
/agenkit build a production-grade trading bot with a backtest engine, risk controls and paper trading by default from strategies/Intraday-Hammer-Reversal-Pattern-Long-Strategy.md- npx agenkit install engineering-kit in your project
- Paste the command into your agent and approve each phase
- Get tests, backtest, risk controls and a paper-trading switch
Understand it first
Before you run this, read the lesson behind the idea and how to backtest it honestly. Specs like this one are the survivors of an unknown number of trials; deflate their results accordingly.
Related specs
- ATR and EMA based Dynamic Take Profit and Stop Loss Adaptive StrategyPine Script · Mean reversion · 1h
- Advanced 15 Minute Chart Trading Signal StrategyPine Script · Mean reversion · 3h
- BONK Multi Factor Trading StrategyPine Script · Mean reversion · 1d
- Bitcoin Futures Position Trading StrategyPine Script · Mean reversion · 1h
- Chaikin Oscillator StrategyPine Script · Mean reversion · 3h
- Customizable Non Repainting HTF MACD MFI Scalable Bot StrategyPine Script · Mean reversion · 1d