Strategy vault / Multi-timeframe
Inverse Fisher RSI Moving Average Multi Timeframe Strategy
The Inverse Fisher RSI Moving Average Multi Timeframe Strategy is a quantitative trading strategy that tries to identify potential market reversal points by calculating the moving average of the inversely adjusted…
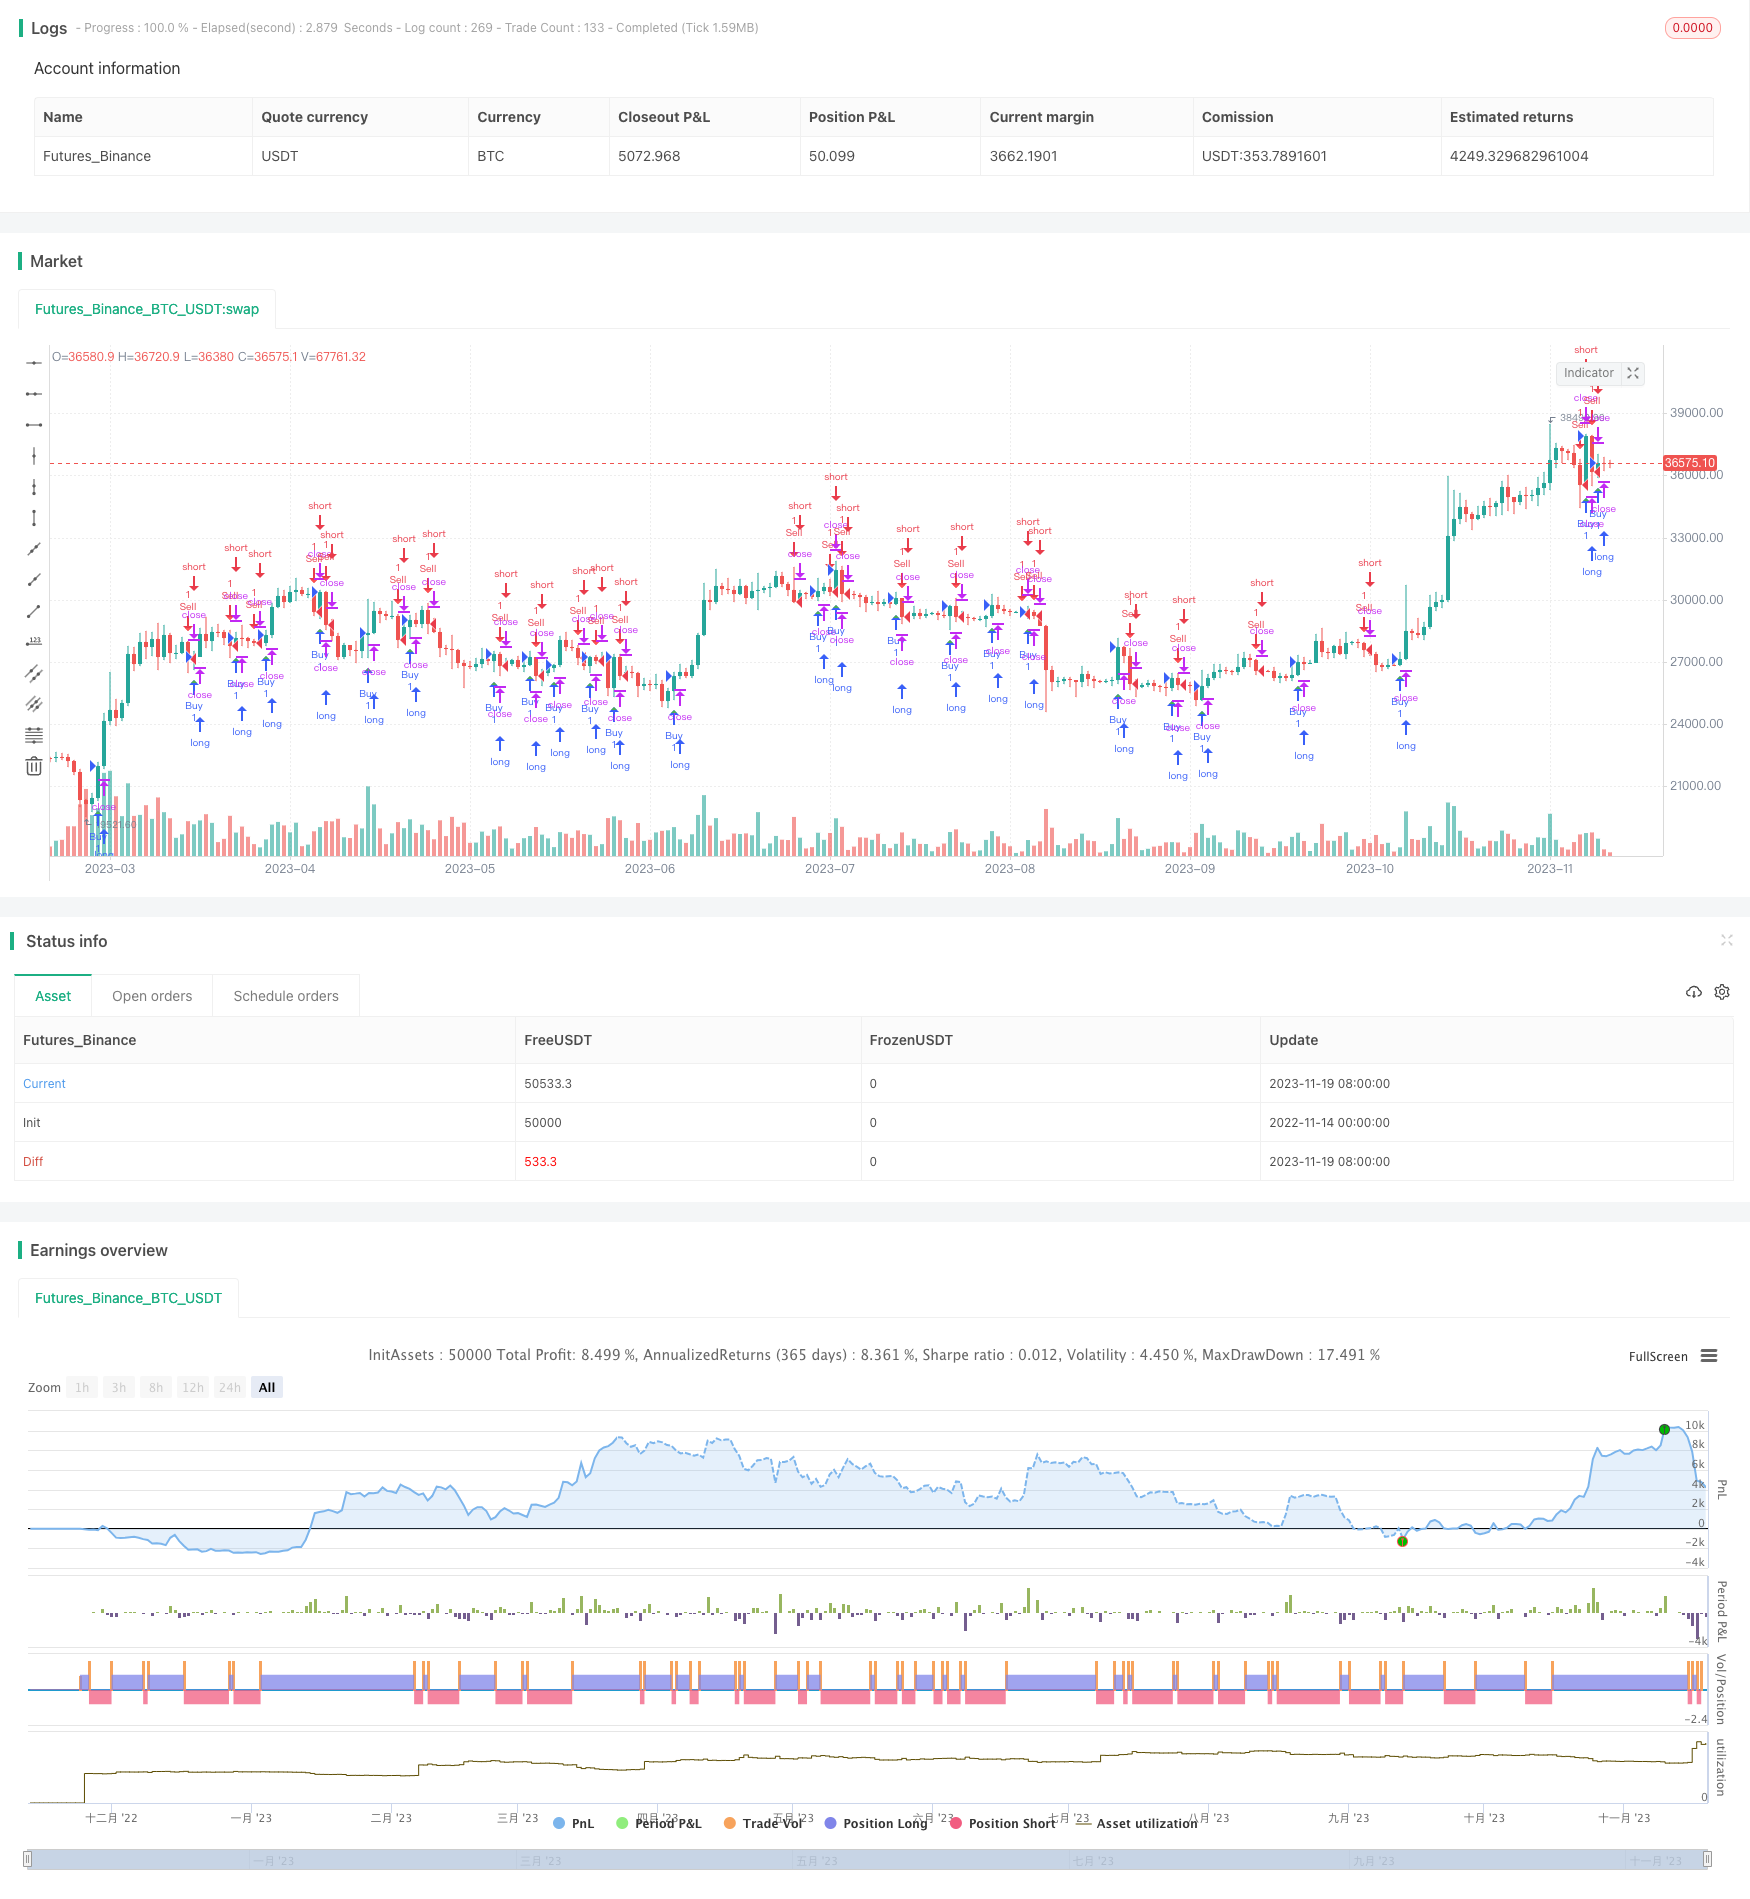
Overview
The Inverse Fisher RSI Moving Average Multi Timeframe Strategy is a quantitative trading strategy that tries to identify potential market reversal points by calculating the moving average of the inversely adjusted RSI indicator on higher timeframes.
Strategy Logic
The strategy first calculates the regular RSI indicator, where the RSI_pm parameter represents the RSI calculation period. The original RSI is then inversely adjusted through a mathematical function IF(input)=>(exp(2input)-1)/(exp(2input)+1). The adjusted RSI is passed to the variable IF_RSI.
To filter out too much noise, the strategy further calculates the moving average of IF_RSI over the period RSI_ps, obtaining the final indicator wma_RSI used to determine buy and sell signals. This indicator is further mapped to a 0-100 range.
Finally, the strategy plots this indicator on a higher timeframe and sets threshold lines at 0.8 and -0.8. A buy signal is generated when the indicator line breaks above 0.8 from below. A sell signal is generated when the indicator line breaks below -0.8 from above.
Advantages
The strategy processes the RSI trend through double smoothing, which can effectively filter out too much noise and lock in relatively clear reversal signals. Double smoothing is applied respectively to the original RSI indicator and the absolutely adjusted RSI indicator. This method can enhance the mean reversion characteristic of the indicator and produce relatively reliable trading signals.
In addition, the multi-timeframe analysis method adopted by the strategy identifies breakouts of the indicator on a higher level timeframe, which can capture long-term reversal opportunities and avoid interference from excessive short-term market noise.
Risks
The strategy relies on moving average indicators to determine buy and sell points, which has some lag. In long-term bull markets, the upside space of adjusted indicators may be limited, failing to fully capture trend opportunities.
On the other hand, the adjustments may also miss rebound opportunities after short-term corrections. If the indicator parameters are not properly optimized, certain strategy risks may be faced.
Optimization
Try appropriately adjusting the indicator parameters to better adapt them to market conditions. For example, different RSI calculation cycles and smoothing period parameters can be tested to find the optimal parameter combination.
It is also worth considering combining other auxiliary indicators to verify signals and improve strategy stability. For example, volume indicators, Bollinger Bands etc. can be added to judge the strength of trend signals.
Conclusion
The Inverse Fisher RSI Moving Average Multi Timeframe Strategy has an overall robust logic, but still needs optimization to adapt to wider market situations. It is worth further testing and improving to make it a reliable quantitative trading strategy.
Parameters
| Name | Default | What it controls |
|---|---|---|
| v_input_1 | 5 | RSI Main Period |
| v_input_2 | true | RSI Smooth Period |
| v_input_3 | 1440 | Timeframe |
Source Pine Script
/*backtest
start: 2022-11-14 00:00:00
end: 2023-11-20 00:00:00
period: 1d
basePeriod: 1h
exchanges: [{"eid":"Futures_Binance","currency":"BTC_USDT"}]
*/

//@version=4
strategy(title = "Inverse Fisher RSI-MTF2", shorttitle="INRSIM2",overlay=true)
//Inputs
RSI_pm = input(5, title="RSI Main Period",minval=2)
RSI_ps = input(1, title="RSI Smooth Period",minval=0)

//Functions
IF(input)=>(exp(2*input)-1)/(exp(2*input)+1)

//RSI Calculation
raw_RSI=0.1*(rsi(close,RSI_pm)-50)
wma_RSI=wma(raw_RSI,RSI_ps)*100
IF_RSI = IF(wma_RSI)

resCustom = input(title="Timeframe", defval="1440" )
v=request.security(syminfo.tickerid, resCustom,IF_RSI)
a=v>0.8
b=v<-0.8

z=0.8
buy = crossover(v,z)
sell=crossunder(v,b)

plotshape(sell, title="sell", style=shape.triangledown,location=location.abovebar, color=red, transp=0, size=size.small)
plotshape(buy,  title="buy", style=shape.triangleup,location=location.belowbar, color=green, transp=0, size=size.small)


//Strategy
golong =  crossover(v,z)
goshort =  crossunder(v,b)

strategy.entry("Buy",strategy.long,when = golong)
strategy.entry("Sell",strategy.short,when = goshort)
Published by ChaoZhang on the FMZ strategy square · last modified 2023-11-21. Collected in the Quant Trading Vault. Unvalidated research: re-test with your own data and costs before trusting it.
Build this with AgenKit
A spec is not a trading system. Paste this into your coding agent and AgenKit runs a specialist team — architecture, test-first build, risk gates, review — with paper trading on by default.
/agenkit build a production-grade trading bot with a backtest engine, risk controls and paper trading by default from strategies/Inverse-Fisher-RSI-Moving-Average-Multi-Timeframe-Strategy.md- npx agenkit install engineering-kit in your project
- Paste the command into your agent and approve each phase
- Get tests, backtest, risk controls and a paper-trading switch
Understand it first
Before you run this, read the lesson behind the idea and how to backtest it honestly. Specs like this one are the survivors of an unknown number of trials; deflate their results accordingly.
Related specs
- EMA RSI and MACD Based Multi Timeframe Trading StrategyPine Script · Multi-timeframe · 1h
- Low Pyramid Risk Tracking StrategyPine Script · Multi-timeframe · 1d
- Multi Timeframe RSI SRSI Trading StrategyPine Script · Multi-timeframe · 1d
- Multi timeframe RSI and Moving Average Trading StrategyPine Script · Multi-timeframe · 1h
- Aggregated Multi timeframe MACD RSI CCI StochRSI MA Linear Trading StrategyPine Script · Multi-timeframe · 1m
- Multi Timeframe Adaptive Market Regime Quantitative Trading StrategyPine Script · Multi-timeframe · 1m