Joanne on Crypto Dual Moving Average with MACD Scalping Strategy
The core idea of this strategy is to combine dual moving averages and MACD indicator to determine trend direction for trend following trading. When the fast MA crosses above the slow MA, it signals an uptrend…
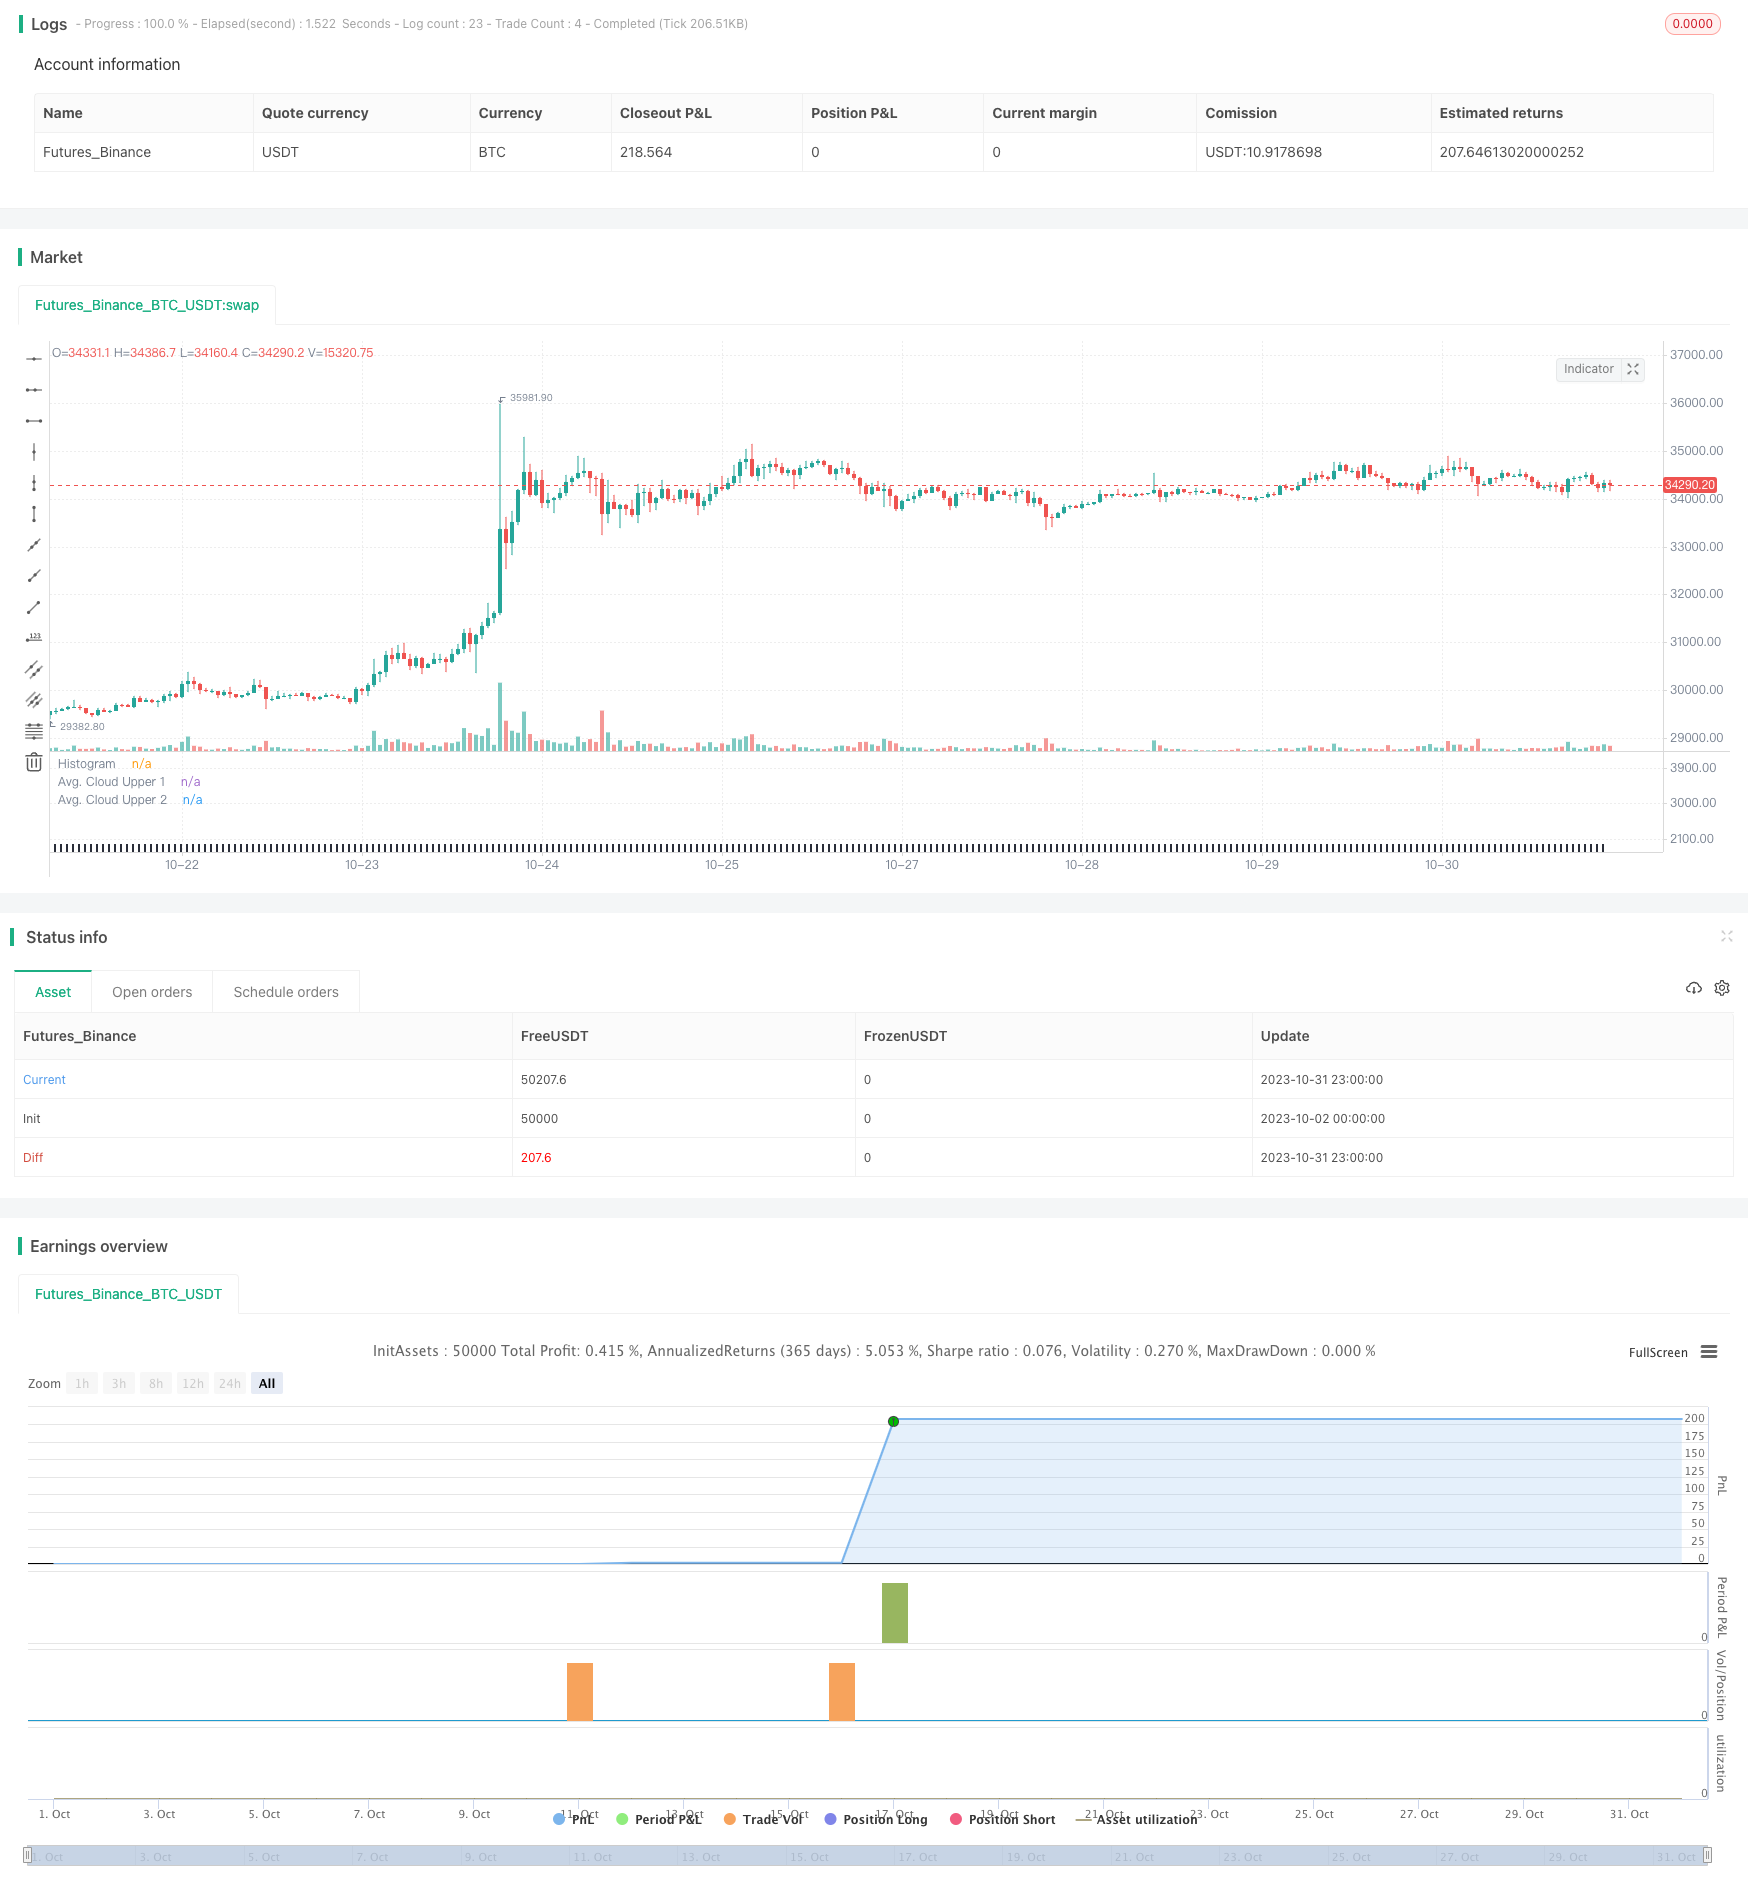
Overview
The core idea of this strategy is to combine dual moving averages and MACD indicator to determine trend direction for trend following trading. When the fast MA crosses above the slow MA, it signals an uptrend opportunity. When the fast MA crosses below the slow MA, it signals a downtrend opportunity. The MACD histogram is used to determine specific entry and exit points by going long when it crosses above 0 and going short when it crosses below 0.
Strategy Logic
Calculate the fast EMA (12-day), slow EMA (26-day), and signal EMA (9-day) of MACD.
Calculate the MACD histogram (fast EMA - slow EMA) and MACD signal line (9-day EMA of MACD histogram).
Calculate the 50-day and 200-day MAs as trends.
MACD histogram crossing above 0 is the bullish signal and crossing below 0 is the bearish signal.
Fast EMA crossing above slow EMA combined with short MA crossing above long MA gives bullish signals.
Fast EMA crossing below slow EMA combined with short MA crossing below long MA gives bearish signals.
Limit number of trades after each MA crossover using Max trades after EMA cross parameter.
Use stop loss and take profit to exit trades.
Advantages
Dual MAs determine overall trend to avoid counter-trend trades.
MACD identifies entry and exit points to capture trend shifts.
Combination provides good timing for entries in the direction of trend.
Limits number of trades after crossover to avoid chasing trends.
Stop loss and take profit controls risk.
Parameters can be optimized for better performance.
Risks
Wrong trend determination leads to counter-trend loss. Widen MA difference requirement to firmly establish trend.
MACD signals lag price action resulting in premature or late entries. Adjust MACD parameters or add filters.
Improper stop loss and take profit levels lead to excessive stops or insufficient profits. Requires parameter optimization for each instrument.
Parameter optimization is difficult. Different parameters combinations needed for different products and timeframes. Requires extensive upfront testing.
Enhancement Opportunities
Test other indicators like KD to determine trend.
Add other indicators to filter MACD signals, like Bollinger Bands, ATR stops.
Optimize stop loss and take profit for each product.
Utilize walkforward and random optimization to find better parameters.
Add mechanisms to reduce trade frequency, like MACD zone around 0.
Automate parameter and combination optimization across multiple products.
Summary
This strategy combines the strengths of dual MAs for trend direction and MACD for entry timing to create a robust trend following system. Additional performance gains are possible through parameter optimization and combining indicators. Overall, it has strong risk management and profit potential to be considered for live trading. But parameter testing is still required for each product to ensure robustness.
Parameters
| Name | Default | What it controls |
|---|---|---|
| v_input_1 | 50 | EMA Trend 1 |
| v_input_2 | 200 | EMA Trend 2 |
| v_input_3 | 12 | MACD Fast Length |
| v_input_4 | 26 | MACD Slow Length |
| v_input_int_1 | 9 | MACD Signal Smoothing |
| v_input_5_close | 0 | MACD Source: close | high | low | open | hl2 | hlc3 | hlcc4 | ohlc4 |
| v_input_string_1 | 0 | Tick Highlight: Moving average | Fixed value |
| v_input_string_2 | 0 | Tick Source: Highest bar | Average | Last bar |
| v_input_int_2 | 72 | Upticks Avg. Length |
| v_input_int_3 | 72 | Downticks Avg. Length |
| v_input_float_1 | 2 | Ticks Avg. Multiplier |
| v_input_int_4 | 3 | Max trades after EMA cross |
| v_input_6 | 30 | Fixed Uptick Value |
| v_input_7 | -30 | Fixed Downtick Value |
| v_input_float_2 | 0.005 | Limit Price Difference |
| v_input_float_3 | 0.005 | Take Profit |
| v_input_float_4 | 0.004 | Stop Loss |
| v_input_float_5 | 100 | Min EMA difference |
Source Pine Script
/*backtest
start: 2023-10-02 00:00:00
end: 2023-11-01 00:00:00
period: 1h
basePeriod: 15m
exchanges: [{"eid":"Futures_Binance","currency":"BTC_USDT"}]
*/

//@version=5
strategy(title="ComiCo - Joel on Crypto - MACD Scalping", shorttitle="ComiCo - Joel on Crypto - MACD Scalping")
// Getting inputs
slow_length1 = input(title="EMA Trend 1", defval=50)
slow_length2 = input(title="EMA Trend 2 ", defval=200)
fast_length = input(title="MACD Fast Length", defval=12)
slow_length = input(title="MACD Slow Length", defval=26)
signal_length = input.int(title="MACD Signal Smoothing",  minval = 1, maxval = 50, defval = 9)
src = input(title="MACD Source", defval=close)

i_switch = input.string(title="Tick Highlight", defval="Moving average" ,options=["Moving average","Fixed value" ])
i_switch2 = input.string(title="Tick Source", defval="Highest bar" ,options=["Highest bar","Average","Last bar"])

signal_lengthup = input.int(title="Upticks Avg. Length",  minval = 1, maxval = 5000, defval = 72)
signal_lengthdown = input.int(title="Downticks Avg. Length",  minval = 1, maxval = 5000, defval = 72)

signal_lengthMA = input.float(title="Ticks Avg. Multiplier",  minval = 0, maxval = 5000, defval = 2, step = 0.1)

sma_source = "EMA"
sma_signal = "EMA"
// Plot colors

col_grow_above = #26A69A
col_fall_above =#B2DFDB
col_grow_below = #FFCDD2
col_fall_below = #FF5252
// Calculating

fast_ma = sma_source == "SMA" ? ta.sma(src, fast_length) : ta.ema(src, fast_length)
slow_ma = sma_source == "SMA" ? ta.sma(src, slow_length) : ta.ema(src, slow_length)

time_macd=timeframe.period=="1"?"1": timeframe.period=="3"?"1": timeframe.period=="5"?"1": timeframe.period=="15"?"3":timeframe.period=="30"?"5":timeframe.period=="60"?"15":timeframe.period=="120"?"30":timeframe.period=="240"?"60":timeframe.period=="D"?"240":timeframe.period=="W"?"D":timeframe.period=="M"?"W":timeframe.period=="12M"?"M":timeframe.period


macd = fast_ma - slow_ma
macd1=request.security(syminfo.tickerid, time_macd, macd)
signal = sma_signal == "SMA" ? ta.sma(macd1, signal_length) : ta.ema(macd1, signal_length)

ema50=ta.ema(close,slow_length1)
ema200=ta.ema(close ,slow_length2)

var TradeCounter = 0
MaxCount = input.int(title = "Max trades after EMA cross", minval = 0, maxval = 1000, defval = 3)
bull = ema50>ema200
if bull != bull[1]
    TradeCounter := 0


hist = request.security(syminfo.tickerid, time_macd, macd1 - signal)


f() => [hist[4],hist[3],hist[2],hist[1], hist]
ss=request.security(syminfo.tickerid, time_macd, hist, barmerge.gaps_on,barmerge.lookahead_off)


[ss5,ss4,ss3,ss2,ss1]=request.security(syminfo.tickerid, time_macd, f(), barmerge.gaps_on,barmerge.lookahead_off)


a = array.from(ss5,ss4,ss3,ss2,ss1)

s3=i_switch2=="Highest bar"?(ss>0? array.max(a, 0) : array.min(a, 0)):i_switch2=="Average"?array.avg(a):i_switch2=="Last bar"?ss1:0

saa=timeframe.period == '1'? ss:s3

saa2=timeframe.period == '1'? ss:s3*signal_lengthMA


colorss=(s3>=0 ? (s3[1] < s3 ? col_grow_above : col_fall_above) : (s3[1] < s3 ? col_grow_below : col_fall_below))


saadown = saa2
saaup = saa2

saadown:=saa>=0? saa2:saadown[1]

saaup:=saa<0? saa2:saaup[1]


verr=ta.ema(saadown,signal_lengthup)
dowww=ta.ema(saaup,signal_lengthdown)

ss22=plot(verr, title="Avg. Cloud Upper 1", color=color.new(color.white, 100))
ss33=plot(dowww, title="Avg. Cloud Lower 1", color=color.new(color.white, 100))

fill(ss22, ss33, color.new(color.white, 93), title="Avg. Cloud Background")

fixeduptick = input(title="Fixed Uptick Value", defval=30)
fixeddowntick = input(title="Fixed Downtick Value", defval=-30)
minl = i_switch=="Fixed value"? fixeduptick  :  verr
maxl = i_switch=="Fixed value"? fixeddowntick : dowww

plot(minl, title="Avg. Cloud Upper 2", color=color.new(color.white, 81))
plot(maxl, title="Avg. Cloud Lower 2", color=color.new(color.white, 81))


colors2= s3<=minl and s3>=maxl ? #2a2e39 : colorss

coro2=s3>0? ema50>ema200 ? #2a2e39 :  colors2 : ema50<ema200 ? #2a2e39: colors2
plot(saa, title="Histogram", style=plot.style_columns, color=coro2)

LimitDiff = input.float(title="Limit Price Difference",  minval = 0, maxval = 0.1, defval = 0.005, step = 0.0005)
TP = input.float(title="Take Profit",  minval = 0, maxval = 0.1, defval = 0.005, step = 0.0005)
SL = input.float(title="Stop Loss",  minval = 0, maxval = 0.1, defval = 0.004, step = 0.0005)

minEMAdiff = input.float(title = "Min EMA difference", defval = 100, step = 10)

if #2a2e39 != coro2
    a22 = 0
    if ema50<ema200 and TradeCounter < MaxCount and math.abs(ema50-ema200) > minEMAdiff
        LimitPrice = close * (1 + LimitDiff)
        strategy.entry("enter short", strategy.short, limit = LimitPrice)
        strategy.exit("exit short", "enter short", limit = LimitPrice * (1 - TP), stop = LimitPrice * (1 + SL))
        TradeCounter := TradeCounter + 1
    if ema50>ema200 and TradeCounter < MaxCount and math.abs(ema50-ema200) > minEMAdiff
        LimitPrice = close * (1 - LimitDiff)
        strategy.entry("enter long", strategy.long, limit = LimitPrice)
        strategy.exit("exit long", "enter long", limit = LimitPrice * (1 + TP), stop = LimitPrice * (1 - SL))
        TradeCounter := TradeCounter + 1

//alertcondition(#2a2e39 != coro2 , title='MACD Tick Alert', message='Joel on Crypto - MACD Tick Alert')
Published by ChaoZhang on the FMZ strategy square · last modified 2023-11-02. Collected in the Quant Trading Vault. Unvalidated research: re-test with your own data and costs before trusting it.
Build this with AgenKit
A spec is not a trading system. Paste this into your coding agent and AgenKit runs a specialist team — architecture, test-first build, risk gates, review — with paper trading on by default.
/agenkit build a production-grade trading bot with a backtest engine, risk controls and paper trading by default from strategies/Joanne-on-Crypto-Dual-Moving-Average-with-MACD-Scalping-Strategy.md- npx agenkit install engineering-kit in your project
- Paste the command into your agent and approve each phase
- Get tests, backtest, risk controls and a paper-trading switch
Understand it first
Before you run this, read the lesson behind the idea and how to backtest it honestly. Specs like this one are the survivors of an unknown number of trials; deflate their results accordingly.
Related specs
- Vitalik ScalpePine Script · Scalping
- 20Bitcoin and Gold 5 Minute Scalping Strategy 20Pine Script · Scalping · 1h
- Bollinger Awesome Alert R1Pine Script · Scalping · 1h
- MACD Willy StrategyPine Script · Scalping · 1h
- Super ScalperPine Script · Scalping · 1m
- Advanced Multi Trend Confirmation EMA Supply Demand Zone Dynamic Scalping StrategyPine Script · Scalping · 1d