Strategy vault / Trend following
Kalman Filter Based Trend Tracking Strategy
The core of this strategy is to use Kalman filter technology to smooth the price moving average, and generate trading signals when the tangent angle of the smoothed moving average exceeds a certain threshold within a…
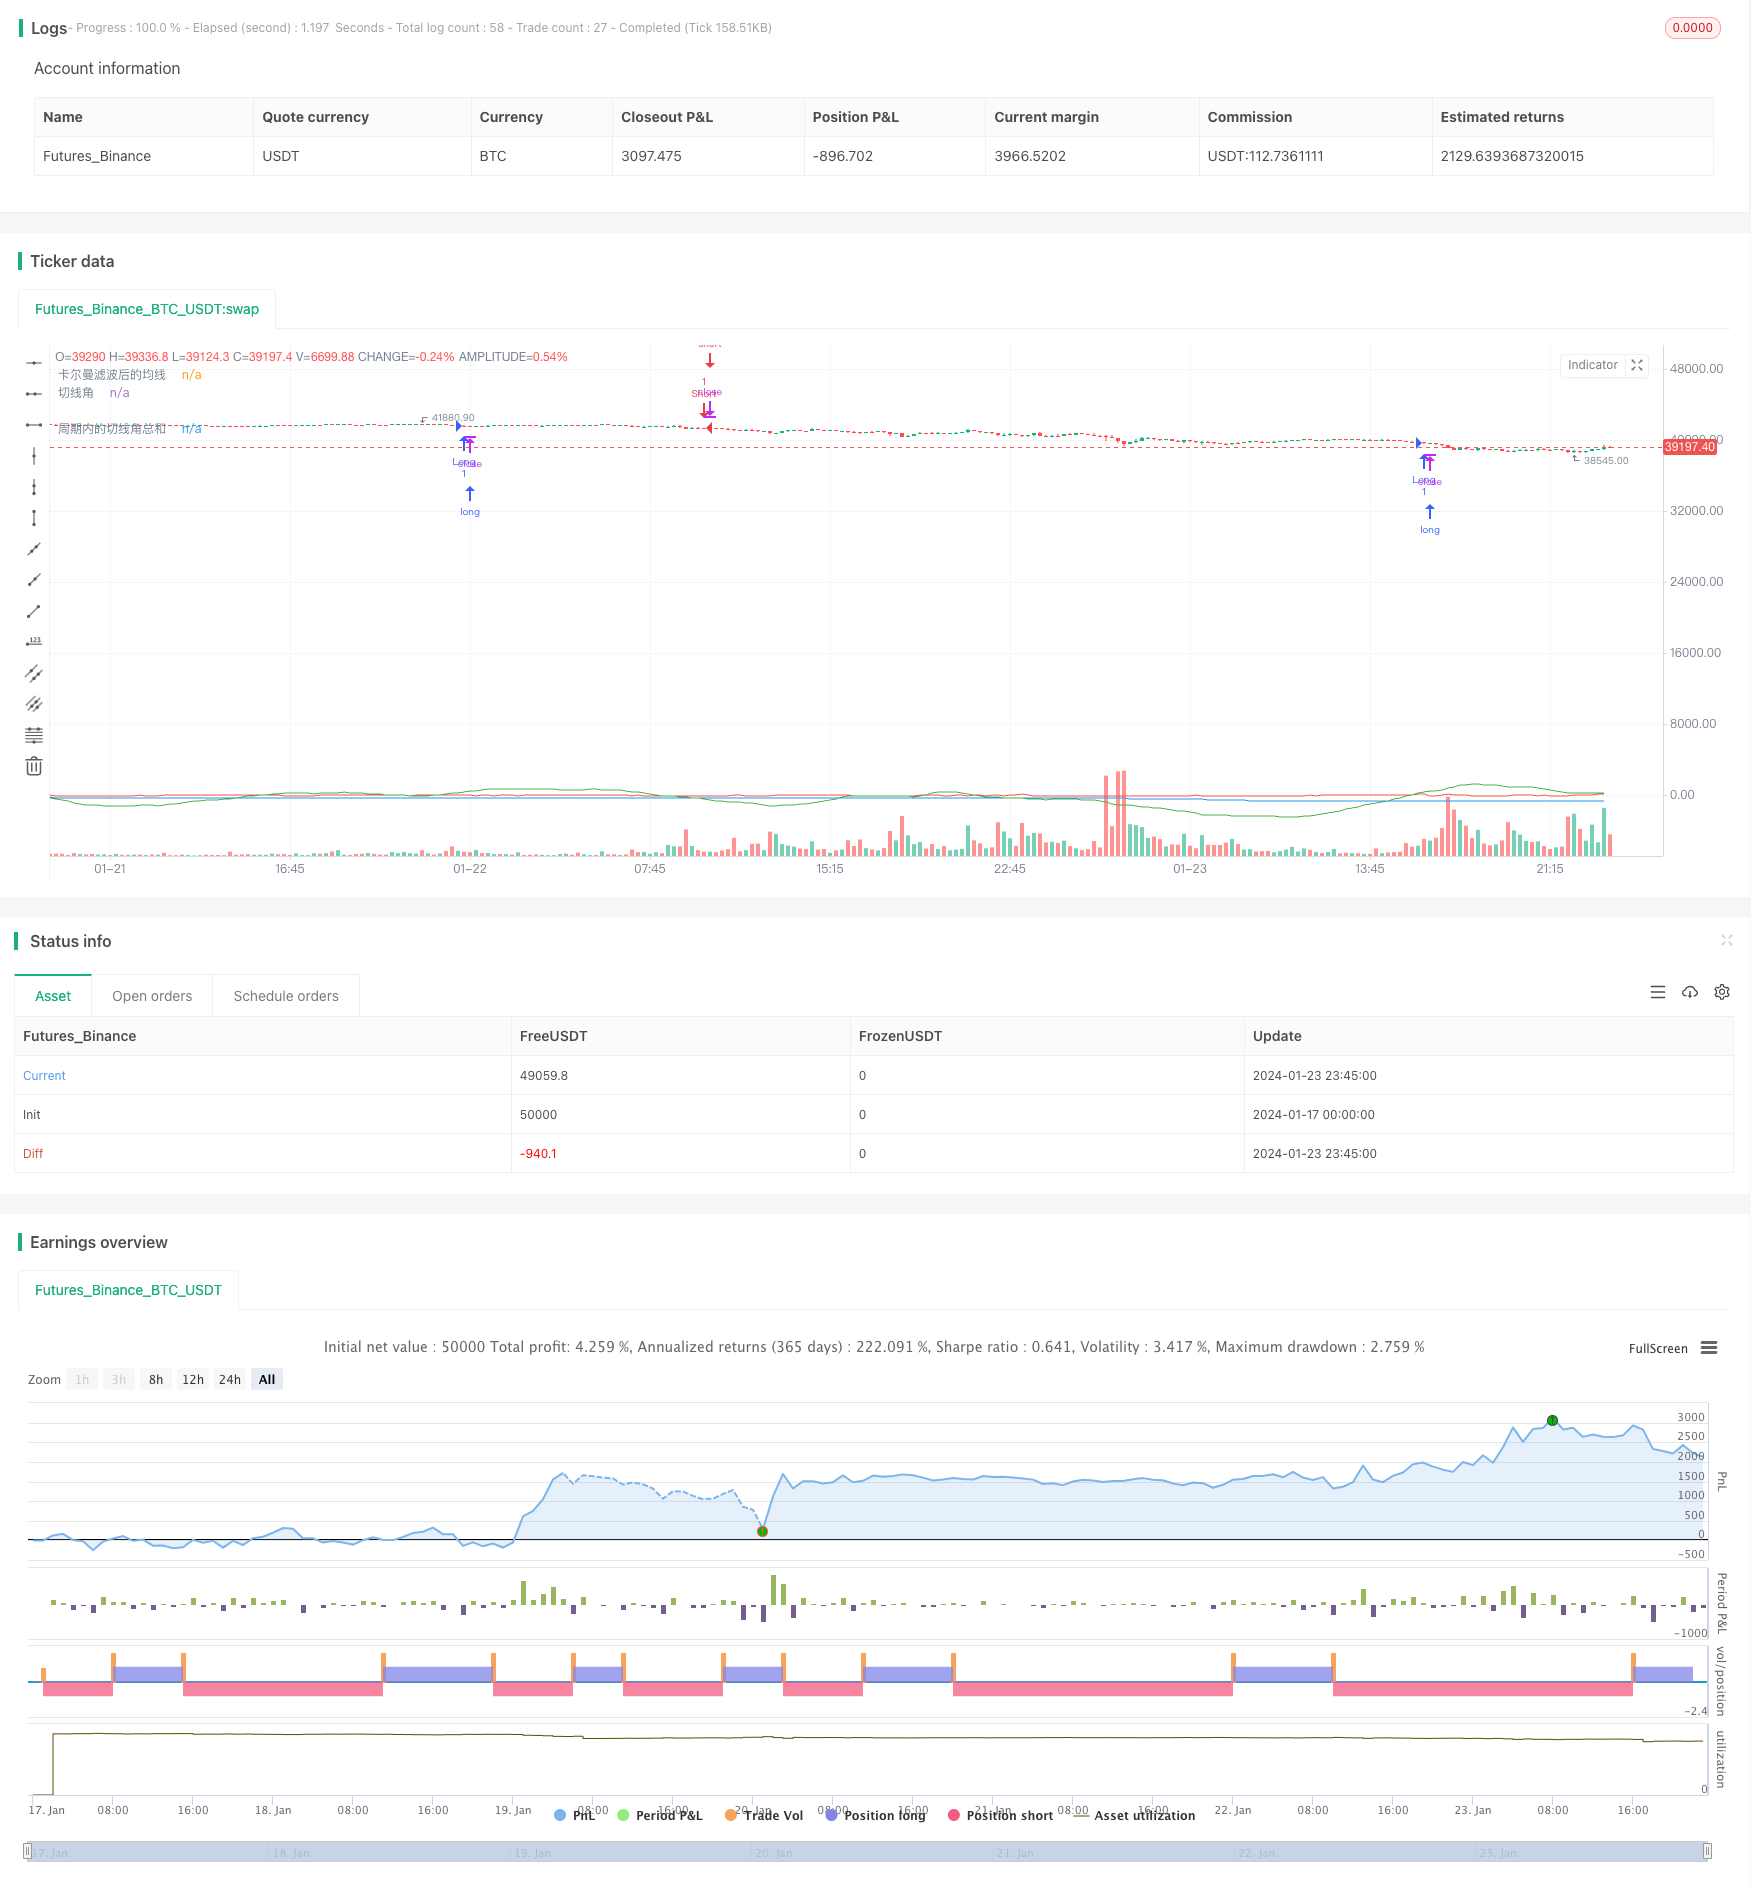
Overview
The core of this strategy is to use Kalman filter technology to smooth the price moving average, and generate trading signals when the tangent angle of the smoothed moving average exceeds a certain threshold within a specified period. The strategy aims to track medium and long term trends by using Kalman filter technology to reduce the impact of noise, so as to obtain clearer and more reliable trend signals.
Strategy Principle
The core logic of this strategy mainly includes the following steps:
Calculate the simple moving average (SMA) of the 1-minute price as the original moving average;
Kalman filter the original moving average to output a smoothed moving average;
Calculate the tangent angle of the smoothed moving average;
Define the parameter period and statistically sum the tangent angles within the period;
Generate a buy signal when the sum of tangent angles within the period is greater than 360 degrees; generate a sell signal when less than -360 degrees.
With this design, when the price shows an upward or downward trend, the tangent angle of the moving average will gradually accumulate. When it accumulates to a certain extent, trading signals will be generated. Therefore, it can effectively track medium and long term trends.
Among them, the Kalman filter is the key. The Kalman filter is a recursive algorithm that predicts the value of process noise and measurement noise while predicting the current state, and uses these noise values to correct the prediction of the current state to obtain a more accurate and reliable state estimation.
In this strategy, the SMA of the price can be seen as the measurement of the state. Affected by market noise, the Kalman filter will recursively estimate the true trend of prices, greatly reduce the impact of noise, make the subsequent moving average calculation more reliable, and thus produce more stable and accurate trading signals.
Advantage Analysis
Compared with simple moving average and other technical indicator strategies, the biggest advantage of this strategy is that it uses Kalman filter to reduce the impact of noise, making trading signals clearer and more reliable. The specific advantages are mainly reflected in the following aspects:
Reduce false signals. Kalman filtering effectively filters out a lot of false signals caused by random fluctuations by adaptively estimating and eliminating noise, making the trading signals generated more reliable.
Better tracking effect. The smoothed moving average shape is smoother and better reflects the medium and long term trend of prices, thus achieving better trend tracking effect.
Flexible adjustable parameters. Adjustable parameters include the length of moving average, parameters of Kalman filter and statistical cycle, which can flexibly adapt to different market environments.
Controllable risk. This strategy focuses more on medium and long term trends rather than short term fluctuations, achieving good risk-return balance.
Easy to implement and expand. The core algorithm of this strategy is quite concise and easy to implement and test. It also provides room for expansion, such as introducing machine learning algorithms to automatically optimize parameters.
Risk Analysis
The main risks of this strategy also include:
Trend reversal risk. This strategy focuses on trend tracking. In case of a sharp trend reversal, it will lead to greater losses. This can be mitigated by appropriately shortening the statistical cycle to reduce per trade loss.
Parameter optimization risk. Inappropriate parameter settings may lead to frequent trading or signal lagging. It requires sufficient testing and optimization. It can be combined with machine learning algorithms for automatic optimization.
Over-optimization risk. Excessive optimization on historical data may also lead to ineffective parameters. Out-of-sample validity needs to be controlled.
Increased complexity risk. Introducing Kalman filter and tangent angle algorithms increases code complexity. Correct implementation needs to be ensured.
Optimization Directions
Considering the above risks, the optimization directions of this strategy include:
Introduce stop loss and position sizing. Appropriate stop loss can effectively control the risk of single trade loss; dynamic position sizing can also adjust positions to hedge risks according to market conditions.
Automatic parameter optimization. Machine learning optimization algorithms can achieve automatic parameter optimization to avoid over-optimization risks.
Integrate other indicators. Some other indicators can be integrated into the strategy to form indicator combinations to enhance strategy stability.
Increase efficiency evaluation. Introduce more risk-adjusted metrics to evaluate the efficiency and stability of strategies for a more comprehensive and accurate conclusion.
Expand to more products. If effective, it can be considered to expand to more products. In the medium and long term, it accumulates richer samples and facilitates cross-product parameter optimization.
Conclusion
In general, this strategy is a relatively simple and practical trend tracking strategy. Compared with traditional moving average strategies, the introduction of the Kalman filter algorithm is its biggest innovation point, which also enables the strategy to produce clearer and more reliable trading signals. With further optimization, this strategy is expected to achieve better results. Overall, this strategy provides a new idea for quantitative trading strategies and is worth further research and application.
Source Pine Script
/*backtest
start: 2024-01-17 00:00:00
end: 2024-01-24 00:00:00
period: 15m
basePeriod: 5m
exchanges: [{"eid":"Futures_Binance","currency":"BTC_USDT"}]
*/

//@version=5
//@library=math
strategy("Strategy 360° (Test)", overlay=true)

// Definition1Minute Moving Average
ma1 = request.security(syminfo.tickerid, "1", ta.sma(close, 1)) // Used here math.sma() Function
//plot(ma1, color=color.yellow, title="Original Moving Average")

// Define the Kalman filter function, referenced here[1](https://www.tradingview.com/pine-script-docs/en/v5/language/Methods.html)and[2](https://www.tradingview.com/pine-script-docs/en/v5/language/Operators.html)Code of
kalman(x, g) =>
    kf = 0.0
    dk = x - nz(kf[1], x) // The nz() function is used here
    smooth = nz(kf[1], x) + dk * math.sqrt(g * 2) // Used here math.sqrt() Function
    velo = 0.0
    velo := nz(velo[1], 0) + g * dk // The nz() function is used here
    kf := smooth + velo
    kf

// Define the moving average after Kalman filtering
ma2 = kalman(ma1, 0.01)
plot(ma2, color=color.blue, title="Moving average after Kalman filtering")

// Define Tangent Angle
angle = math.todegrees(math.atan(ma2 - ma2[1])) // Used here math.degrees() and math.atan() Function

// Define cumulative tangent angles
cum_angle = 0.0
cum_angle := nz(cum_angle[1], 0) + angle // The nz() function is used here

// Definition30Minute Cycle
period = 30 // You can modify this parameter according to your needs

// Define the sum of tangent angles within the period
sum_angle = 0.0
sum_angle := math.sum(angle, period) // Used here math.sum() Function, change the sum of tangent angles within the period to simply 5 Add tangent angles

// Define buy and sell conditions
buy = sum_angle > 360// Used here math.radians() Function
sell = sum_angle < -360

// Perform buy and sell operations
strategy.entry("Long", strategy.long, when=buy)
strategy.close("Short", when=buy)
strategy.entry("Short", strategy.short, when=sell)
strategy.close("Long", when=sell)

// Draw chart
plot(sum_angle, color=color.green, title="Sum of tangent angles within the period")
plot(angle, color=color.red, title="Tangent angle") // This is the code I added for you to display the real-time calculated tangent angle
Published by ChaoZhang on the FMZ strategy square · last modified 2024-01-25. Collected in the Quant Trading Vault. Unvalidated research: re-test with your own data and costs before trusting it.
Build this with AgenKit
A spec is not a trading system. Paste this into your coding agent and AgenKit runs a specialist team — architecture, test-first build, risk gates, review — with paper trading on by default.
/agenkit build a production-grade trading bot with a backtest engine, risk controls and paper trading by default from strategies/Kalman-Filter-Based-Trend-Tracking-Strategy.md- npx agenkit install engineering-kit in your project
- Paste the command into your agent and approve each phase
- Get tests, backtest, risk controls and a paper-trading switch
Understand it first
Before you run this, read the lesson behind the idea and how to backtest it honestly. Specs like this one are the survivors of an unknown number of trials; deflate their results accordingly.
Related specs
- ADX MA and EMA Long Only Trend Tracking StrategyPine Script · Trend following · 1d
- ATR and Moving Average Crossover Hybrid StrategyPine Script · Trend following · 1h
- Adaptive FVG Detection and MA Trend Trading Strategy with Dynamic ResistancePine Script · Trend following · 1d
- Adaptive Risk Management Strategy Based on Dynamic ATR and Moving Average CrossoverPine Script · Trend following · 2h
- Adaptive Trading Strategy Based on Stochastic RSI Dual Line CrossoverPine Script · Trend following · 4h
- Adaptive Volatility Based Trend Following Short Strategy with Time Delay and Stop Loss ProtectionPine Script · Trend following · 2m