Strategy vault / Trend following
KDJ Golden Cross Long Entry Strategy
The KDJ Golden Cross Long Entry Strategy is a quantitative trading strategy based on the KDJ indicator. This strategy mainly uses the golden cross of the J line and D line of the KDJ indicator to generate buy signals…
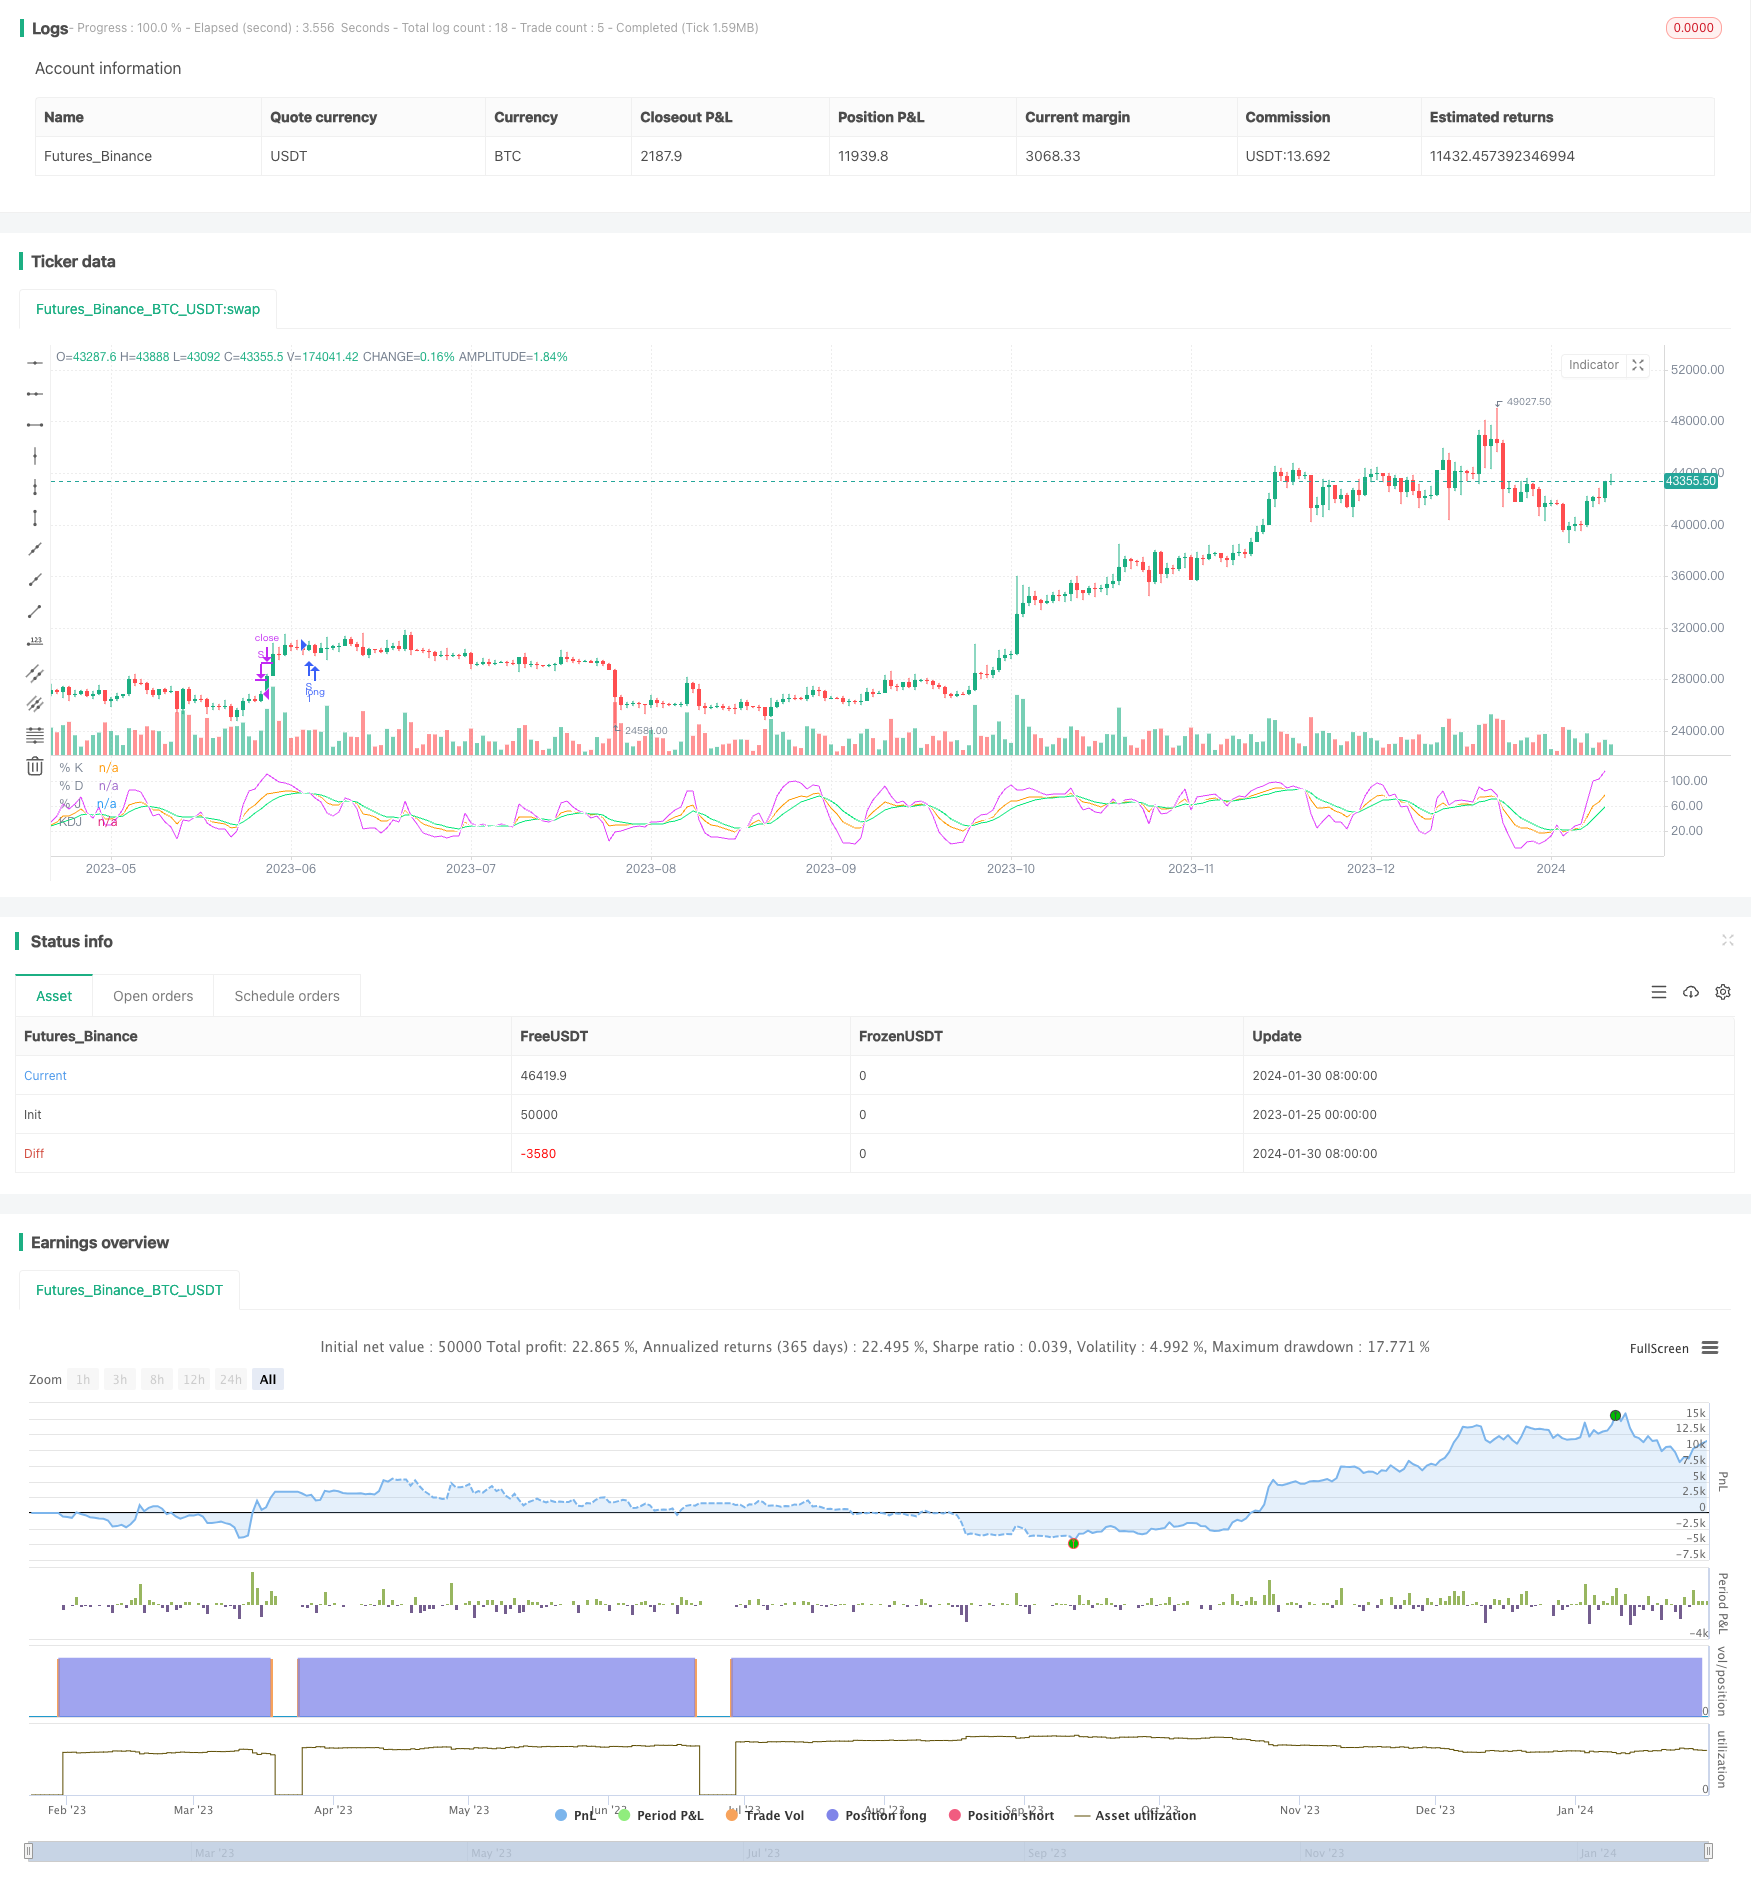
Overview
The KDJ Golden Cross Long Entry Strategy is a quantitative trading strategy based on the KDJ indicator. This strategy mainly uses the golden cross of the J line and D line of the KDJ indicator to generate buy signals and goes long when the J line crosses above the D line. The strategy is relatively simple and easy to implement, suitable for beginners of quantitative trading.
Strategy Logic
The main technical indicator used in this strategy is the KDJ indicator. KDJ indicator consists of the K line, D line and J line. Where:
K = (Current Close - Lowest Low over the past N days) ÷ (Highest High over the past N days - Lowest Low over the past N days) x 100;
D = M-day moving average of K;
J = 3K - 2D.
According to the KDJ indicator rules, when J line crosses above D line, it indicates that prices are reversing upward and long positions can be taken; when J line falls below D line, it signals that prices are reversing downward and short positions can be initiated.
This strategy utilizes the above rules and generates buy signals when the J line crosses above the D line, i.e. a golden cross forms, to go long. The exit signal is when J goes above 100 to close long positions.
Advantages
Using the KDJ indicator to determine entry timing which incorporates price up and down movements, thus more reliable.
The strategy has clear and simple signal rules which are easy to understand and implement, suitable for beginners.
Adopted stop profit and stop loss to effectively control risks.
Large room for parameter optimization and flexible implementation.
Risks
KDJ indicator tends to generate false signals leading to losses.
Market short-term adjustments after buying may trigger stop loss exiting and miss major trends.
Improper parameter settings may lead to overtrading or unclear signals.
Need to consider transaction costs' impact on overall profitability.
Main risk management methods: Optimize parameters properly, track indexes to enhance, appropriately expand stop loss range, etc.
Optimization Directions
Optimize parameters of KDJ to find best parameter combinations.
Add filtering conditions to avoid false signals. Can combine other indicators or formations for filtration.
Can choose different parameter settings based on market types (bull or bear markets).
Can appropriately expand stop loss range to reduce the probability of stop loss exits.
Can combine trading volume and other indicators for analysis to avoid being trapped.
Summary
The KDJ Golden Cross Long Entry Strategy is relatively simple and practical overall, easy for beginners to get started and implement. The strategy has certain trading advantages but also has some risks. It needs targeted optimization in order to fully realize the strategy value. Overall, the strategy deserves key research and application.
Parameters
| Name | Default | What it controls |
|---|---|---|
| v_input_1 | 9 | period |
| v_input_2 | 3 | signal |
| v_input_float_1 | 1.2 | Profit Margin |
| v_input_float_2 | 0.98 | Stop Loss Margin |
| v_input_int_1 | true | Start Date |
| v_input_int_2 | true | Start Month |
| v_input_int_3 | 2023 | Start Year |
| v_input_int_4 | true | End Date |
| v_input_int_5 | true | End Month |
| v_input_int_6 | 2024 | End Year |
Source Pine Script
/*backtest
start: 2023-01-25 00:00:00
end: 2024-01-31 00:00:00
period: 1d
basePeriod: 1h
exchanges: [{"eid":"Futures_Binance","currency":"BTC_USDT"}]
*/

//  ## !<------------------ Script -------------------------->
//@version=5
strategy('KDJ NVDA', shorttitle='KDJ')

ilong = input(9, title='period')
isig = input(3, title='signal')

bcwsma(s, l, m) =>
    _bcwsma = float(na)
    _s = s
    _l = l
    _m = m
    _bcwsma := (_m * _s + (_l - _m) * nz(_bcwsma[1])) / _l
    _bcwsma

// profit strategy add
profit_m = input.float(1.20,"Profit Margin",minval=1.0,maxval=1.99,step=0.05)
stop_m = input.float(0.98,"Stop Loss Margin",minval=0.0,maxval=1,step=0.05)

// Make input options that configure backtest date range
startDate = input.int(title="Start Date", defval=1, minval=1,maxval=31)
startMonth = input.int(title="Start Month", defval=1,minval=1,maxval=12)
startYear = input.int(title="Start Year", defval=2023,minval=2018,maxval=2024)
endDate = input.int(title="End Date", defval=1, minval=1,maxval=31)
endMonth = input.int(title="End Month", defval=1,minval=1,maxval=12)
endYear = input.int(title="End Year", defval=2024,minval=2018,maxval=2099)

// intialization of variables
// Look if the close time of the current bar
// falls inside the date range
inDateRange = (time >= timestamp(syminfo.timezone, startYear,startMonth, startDate, 0, 0)) and (time < timestamp(syminfo.timezone, endYear, endMonth, endDate, 0, 0))

c = close
h = ta.highest(high, ilong)
l = ta.lowest(low, ilong)
RSV = 100 * ((c - l) / (h - l))
pK = bcwsma(RSV, isig, 1)
pD = bcwsma(pK, isig, 1)
pJ = 3 * pK - 2 * pD
KDJ = math.avg(pD, pJ, pK)

go_long= ta.crossunder(pD,pJ)


if (inDateRange and go_long)
    strategy.entry("S",strategy.long,comment="C")
	// strategy.exit("S", limit=c*profit_m, stop=c*stop_m, comment="SL/SP")

if (inDateRange and pJ > 100)
	strategy.close("S", comment="TP")

// Plot options
// plot(pK, color= #1E88E5)
// plot(pD, color=#FF6F00)
// plot(ma, color=color.yellow)
// bgcolor(pJ>pD? color.green : color.red)

plot(pK, title='% K', color=color.new(color.orange, 0))
plot(pD, title='% D', color=color.new(color.lime, 0))
plot(pJ, title='% J', color=color.new(color.fuchsia, 0))
plot(KDJ, title='KDJ', color=color.new(color.white, 0))
// </PINE> </SCRIPT>
// ## This source code is subject to the terms of the ozilla Public License 2.0 at https://mozilla.org/MPL/2.0/
// ## !<------------------ End Script -------------------------->
Published by ChaoZhang on the FMZ strategy square · last modified 2024-02-01. Collected in the Quant Trading Vault. Unvalidated research: re-test with your own data and costs before trusting it.
Build this with AgenKit
A spec is not a trading system. Paste this into your coding agent and AgenKit runs a specialist team — architecture, test-first build, risk gates, review — with paper trading on by default.
/agenkit build a production-grade trading bot with a backtest engine, risk controls and paper trading by default from strategies/KDJ-Golden-Cross-Long-Entry-Strategy.md- npx agenkit install engineering-kit in your project
- Paste the command into your agent and approve each phase
- Get tests, backtest, risk controls and a paper-trading switch
Understand it first
Before you run this, read the lesson behind the idea and how to backtest it honestly. Specs like this one are the survivors of an unknown number of trials; deflate their results accordingly.
Related specs
- 200 EMA VWAP MFI Trend Following StrategyPine Script · Trend following · 1d
- 4 EMA Trend StrategyPine Script · Trend following · 1d
- ADX MA and EMA Long Only Trend Tracking StrategyPine Script · Trend following · 1d
- ATR Dynamic Profit Target and Stop Loss StrategyPine Script · Trend following · 1d
- ATR Dynamic Trend Following and EMA Crossover Trading StrategyPine Script · Trend following · 1d
- ATR and Moving Average Crossover Hybrid StrategyPine Script · Trend following · 1h