Strategy vault / Trend following
KDJ RSI Crossover Buy Sell Signals Strategy
This strategy combines the KDJ indicator and RSI indicator to determine the timing of buys and sells. It generates trading signals when the KDJ indicator and RSI indicator issue buy/sell signals.
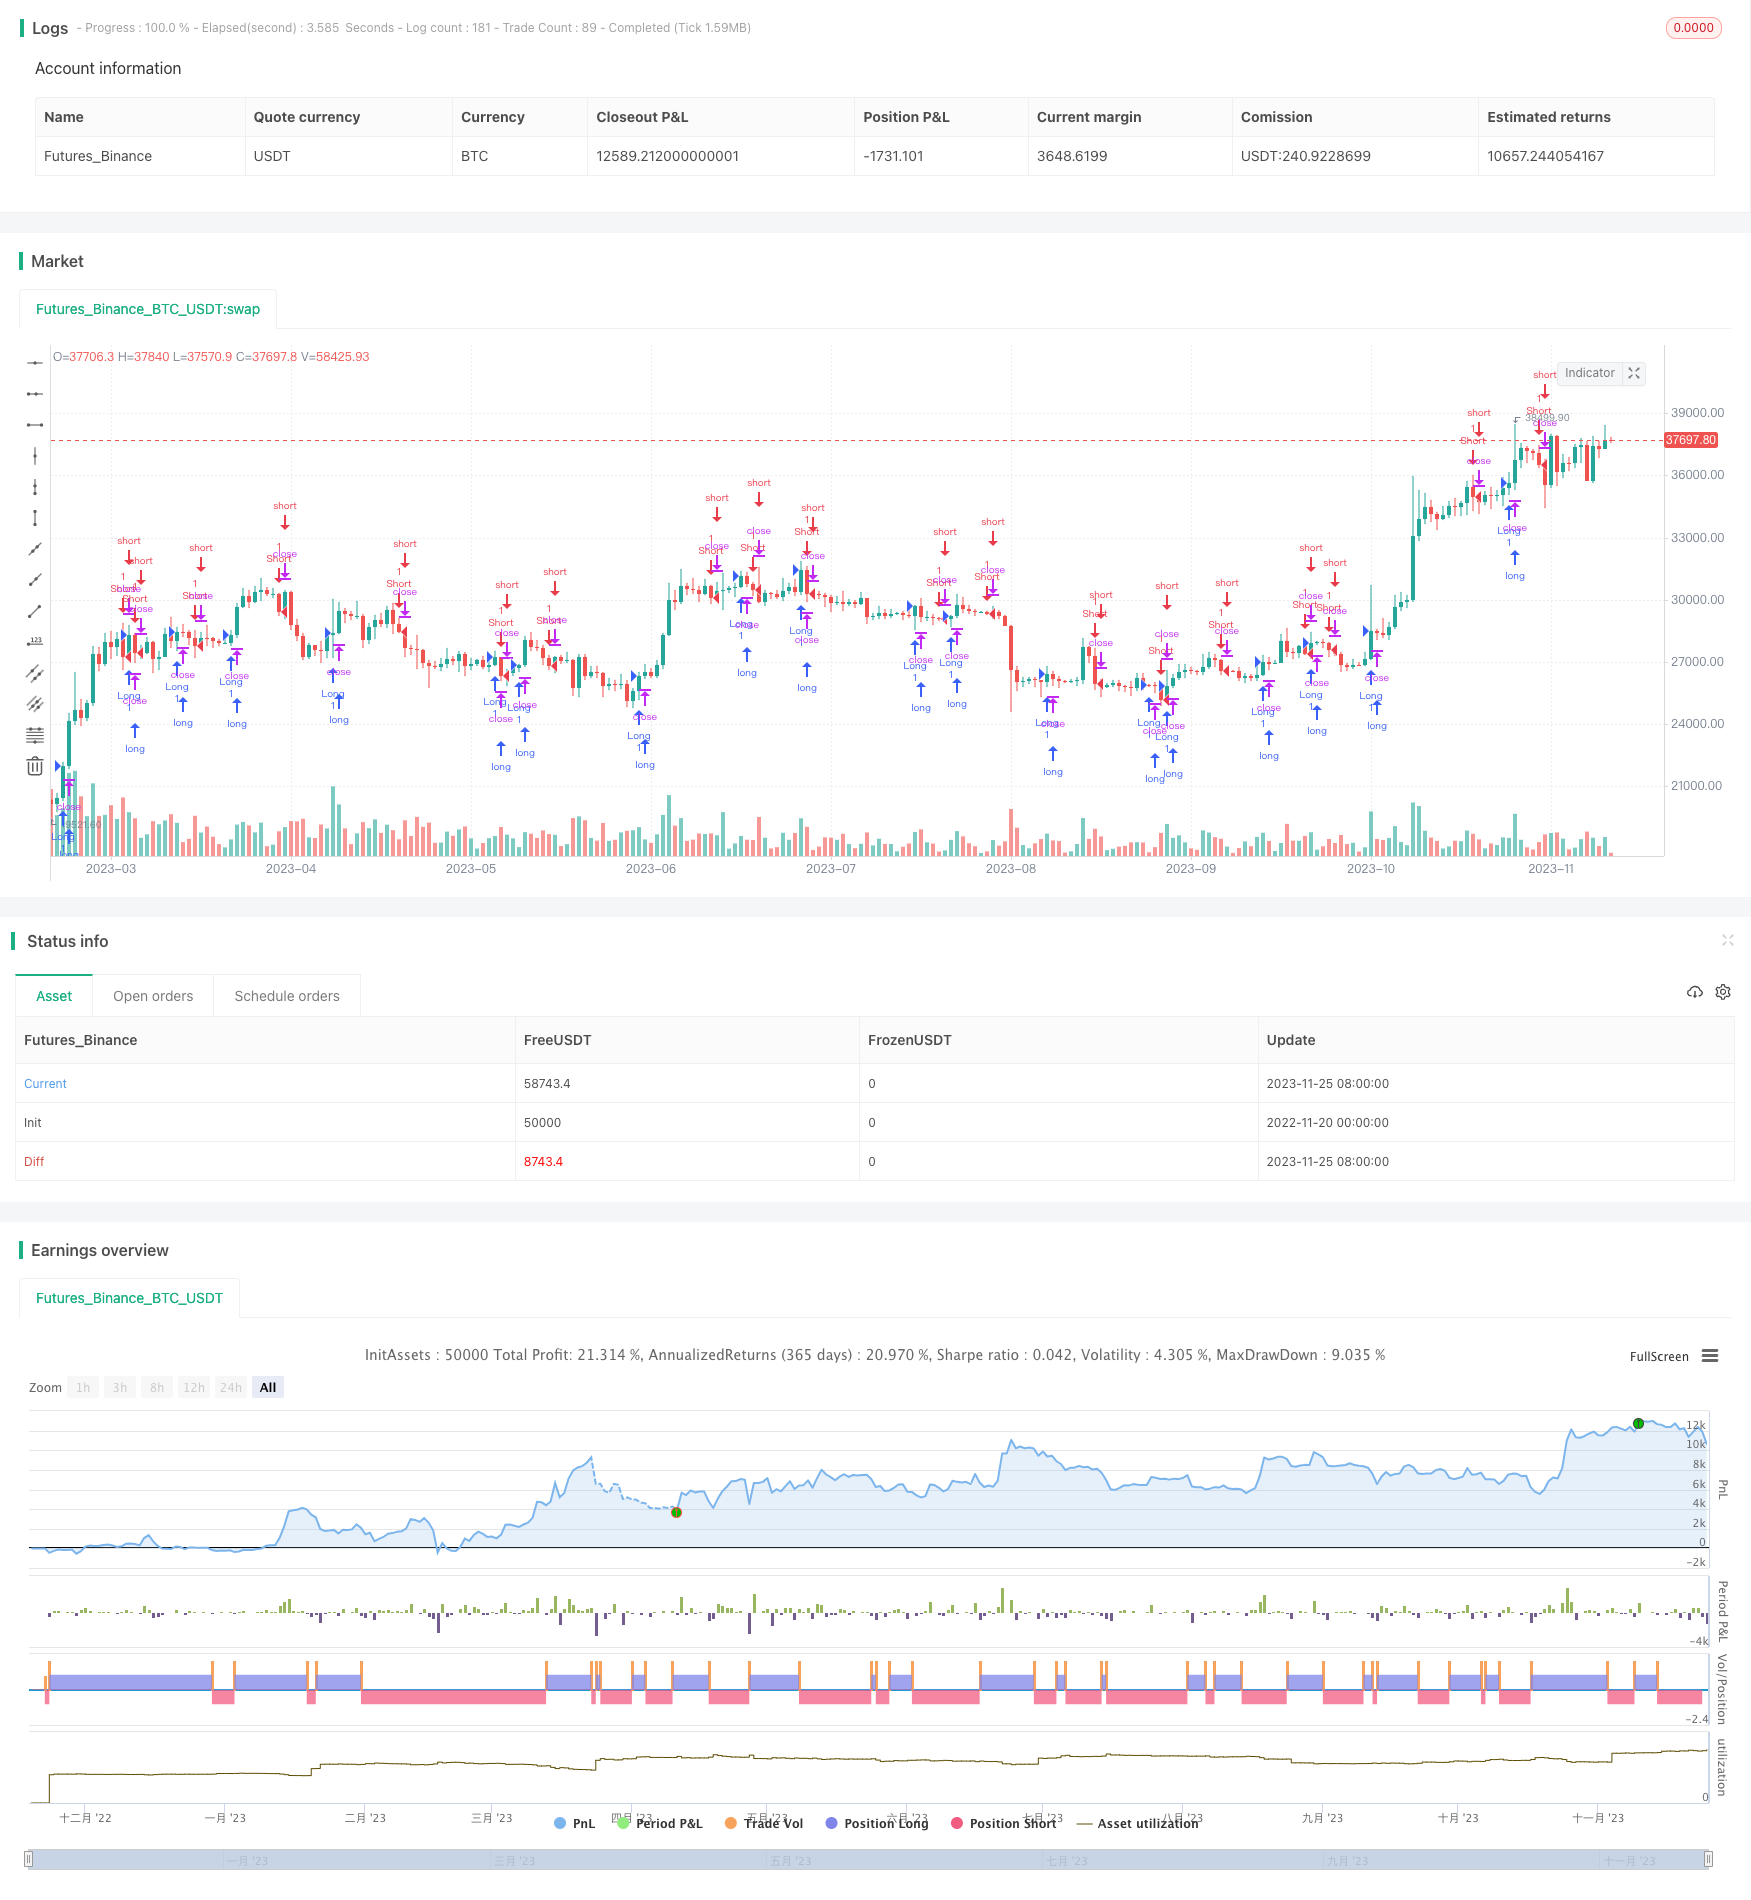
Overview
This strategy combines the KDJ indicator and RSI indicator to determine the timing of buys and sells. It generates trading signals when the KDJ indicator and RSI indicator issue buy/sell signals.
Strategy Principle
The strategy uses the crossover of the KDJ indicator and RSI indicator to judge the timing of buys and sells.
Specifically, when the J line of the KDJ crosses above the K line from the bottom up, it is considered a buy signal. And when the J line crosses below the K line from the top down, it is a sell signal. This means buying when the stock turns from oversold to overbought and selling when it turns from overbought to oversold.
At the same time, the strategy incorporates the RSI indicator to judge the strength of signals. RSI below 30 is oversold and RSI above 70 is overbought. When the KDJ issues a buy signal, if the RSI indicator also shows oversold, it enhances the reliability of the buy signal. Conversely, when the KDJ issues a sell signal, if the RSI also shows overbought, it enhances the reliability of the sell signal.
In summary, this strategy generates trading signals in the following situations:
Buy signals:
- KDJ's J line crosses above K line AND RSI(6) < RSI(12)
- KDJ's J line crosses above K line AND RSI(6) crosses above RSI(24)
- RSI(6) crosses above RSI(24) AND RSI(6) < 40
Sell signals:
- KDJ's J line crosses below K line AND RSI(6) > RSI(12)
- KDJ's J line crosses below K line AND RSI(6) crosses below RSI(24)
- RSI(6) crosses below RSI(24) AND RSI(6) > 60
Advantages
Combining the KDJ indicator and RSI indicator makes trading signals more reliable.
The KDJ indicator judges the overbought/oversold state, while the RSI indicator judges the strength. Combining both can better capture turning points.
Multiple buy/sell conditions avoid missing opportunities due to reasons from a single indicator.
The RSI parameters are set to 6, 12 and 24 periods, which are suitable for different cycle levels, making the strategy more versatile.
Risk Analysis
Both the KDJ and RSI indicators can give false signals, leading to unnecessary trades.
The multiple trade conditions increase the complexity of strategy operations and require careful verification.
The strategy needs to be tested and optimized in different markets, and parameters need adjustment.
Improvement Directions
Test adding other indicators like Bollinger Bands to strengthen trading signals.
Optimize parameters of KDJ and RSI to make them fit different cycle levels.
Increase the stop loss standards to control risks.
Add automatic stop loss mechanisms to stop loss when prices reverse.
Conclusion
This strategy combines the advantages of the KDJ indicator and RSI indicator by using the crossover of the two indicators to determine the timing of buys and sells, which improves the accuracy of trading signals. Using RSI indicators with different parameters also makes the strategy more versatile. This strategy effectively avoids the risk of false signals that may occur with a single indicator. By improving parameters, adding auxiliary indicators, stop loss mechanisms, etc., the performance of this strategy can be further enhanced.
Parameters
| Name | Default | What it controls |
|---|---|---|
| v_input_1 | 9 | KDJ length |
| v_input_2 | 3 | signal |
| v_input_3 | 6 | rsi_length_1 |
| v_input_4 | 12 | rsi_length_2 |
| v_input_5 | 24 | rsi_length_3 |
Source Pine Script
/*backtest
start: 2022-11-20 00:00:00
end: 2023-11-26 00:00:00
period: 1d
basePeriod: 1h
exchanges: [{"eid":"Futures_Binance","currency":"BTC_USDT"}]
*/

// This source code is subject to the terms of the Mozilla Public License 2.0 at https://mozilla.org/MPL/2.0/
// © innocentChart76064

//@version=5
strategy(title = "buy/sell KDJ RSI", overlay=true)

//Define KDJ parameter
kdj_length = input(9, title = "KDJ length")
signal = input(3,title="signal")

// Calculate KDJ values
bcwsma(s,l,m) =>
    _bcwsma = float(na)
    _s = s
    _l = l
    _m = m
    _bcwsma := (_m*_s+(_l-_m)*nz(_bcwsma[1]))/_l
    _bcwsma

c = close
h = ta.highest(high, kdj_length)
l = ta.lowest(low,kdj_length)
RSV = 100*((c-l)/(h-l))
kdj_k = bcwsma(RSV, signal, 1)
kdj_d = bcwsma(kdj_k, signal, 1)
kdj_j = 3 * kdj_k-2 * kdj_d

//Define RSI parameter
rsi_length_1 = input(6)
rsi_length_2 = input(12)
rsi_length_3 = input(24)
price = close

//Calculate RSI values
rsi_1 = ta.rsi(price, rsi_length_1)
rsi_2 = ta.rsi(price, rsi_length_2)
rsi_3 = ta.rsi(price, rsi_length_3)

// Trading conditions
longCondition = ta.crossover(kdj_j,kdj_k) and rsi_1 > rsi_2 or ta.crossover(kdj_j,kdj_k) and ta.crossover(rsi_1,rsi_3) or ta.crossover(rsi_1,rsi_3) and rsi_1<40
shortCondition = ta.crossunder(kdj_j,kdj_k) and rsi_1 < rsi_2 or ta.crossunder(kdj_j,kdj_k) and ta.crossunder(rsi_1,rsi_3) or ta.crossunder(rsi_1,rsi_3) and rsi_1>60
// Enter long trade
strategy.entry("Long", strategy.long, when=longCondition)

// Enter short trade
strategy.entry("Short", strategy.short, when=shortCondition)
Published by ChaoZhang on the FMZ strategy square · last modified 2023-11-27. Collected in the Quant Trading Vault. Unvalidated research: re-test with your own data and costs before trusting it.
Build this with AgenKit
A spec is not a trading system. Paste this into your coding agent and AgenKit runs a specialist team — architecture, test-first build, risk gates, review — with paper trading on by default.
/agenkit build a production-grade trading bot with a backtest engine, risk controls and paper trading by default from strategies/KDJ-RSI-Crossover-Buy-Sell-Signals-Strategy.md- npx agenkit install engineering-kit in your project
- Paste the command into your agent and approve each phase
- Get tests, backtest, risk controls and a paper-trading switch
Understand it first
Before you run this, read the lesson behind the idea and how to backtest it honestly. Specs like this one are the survivors of an unknown number of trials; deflate their results accordingly.
Related specs
- BB Percentage Index Trend Fading StrategyPine Script · Trend following · 1h
- Bollinger Bands and RSI Trend Following StrategyPine Script · Trend following · 1h
- EMA Cross Trend Following Strategy with SMA Stop Loss and Re Entry MechanismPine Script · Trend following · 1h
- EMA and RSI Trend Trading StrategyPine Script · Trend following · 1d
- Incremental Order Size Fibonacci Retracement Trend Following StrategyPine Script · Trend following · 1d
- Multi Indicator Trend Divergence Quantitative Trading StrategyPine Script · Trend following · 1d