Strategy vault / Mean reversion
Key Reversal Backtest Strategy 440103
The key reversal backtest strategy identifies key reversal signals in stock prices to determine if the current trend is reversing, in order to capture the price movement direction after the trend reversal. The…
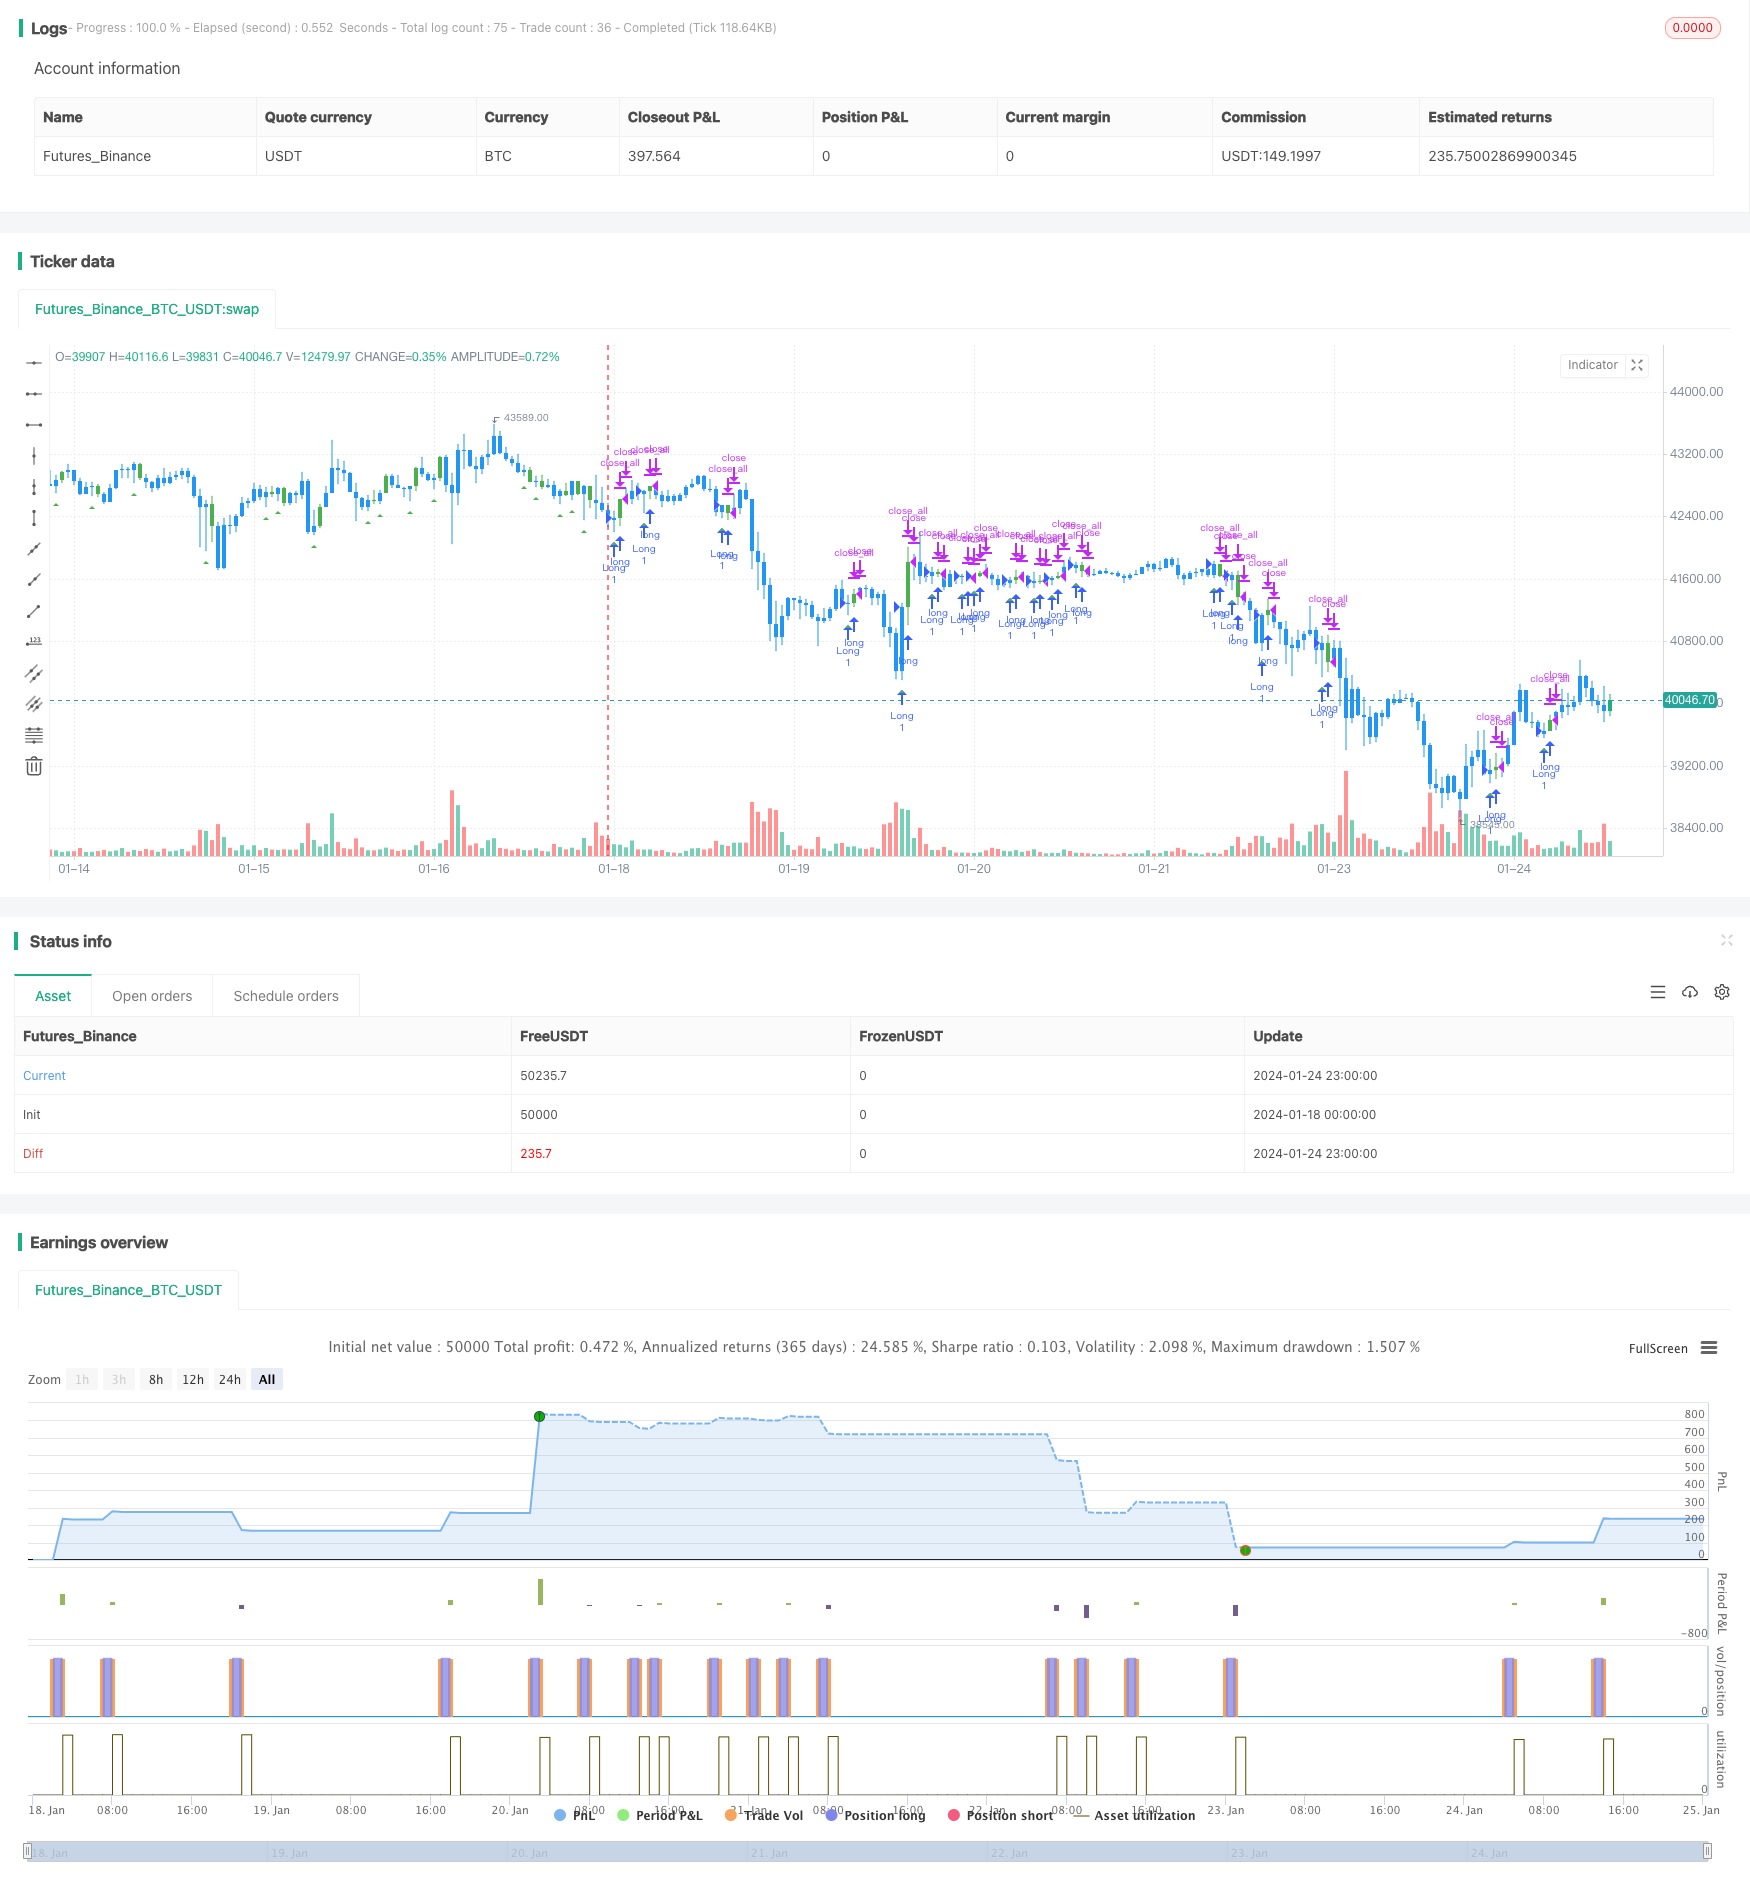
Overview
The key reversal backtest strategy identifies key reversal signals in stock prices to determine if the current trend is reversing, in order to capture the price movement direction after the trend reversal. The strategy is based on the theory of "key reversal day". It goes long or short when detecting key reversal signals, and locks in profits by configuring take profit and stop loss.
Strategy Principle
The core logic of the key reversal backtest strategy is to identify the key reversal day. According to the price movement of the stock, we can judge the current trend direction. The emergence of a key reversal signal indicates that the trend may reverse.
Specifically, for an uptrend, if the lowest price of the day breaks the new low over a period of time, but the close price is near the previous day's low, then this day is a key reversal day. This means that the bullish power is weakening and the bearish pressure is increasing, indicating the uptrend may reverse into a downtrend. The strategy will open short position on the key reversal day.
On the contrary, for a downtrend, if the lowest price of the day breaks the new low, but the close price is near the previous day's high. This is also a key reversal day, indicating that bearish power is diminishing and the downtrend may reverse into an uptrend. The strategy will open long position on the key reversal day.
By identifying the key reversal day and tracking the subsequent price movement, the strategy is able to capture the run after the price reversal.
Advantage Analysis
The main advantages of the key reversal backtest strategy are:
Capture trend reversal with large profit space. Key reversal signals often imply a change in trend direction. By judging reversal signals and tracking subsequent runs, relatively large profits can be obtained.
Clear rules easy to backtest. The criteria for determining key reversal days are very clear, with the new high/low price reversing the closing price of the previous day. This makes the strategy easy to backtest and helps avoid misjudgments.
Flexible adjustment for optimization. Take profit and stop loss levels are very flexible and can be adjusted according to market conditions and personal risk preferences for strategy optimization to reduce risk of loss.
Risk Analysis
The key reversal backtest strategy also has some risks:
Risk of misjudging reversal signals. Stock prices often have short-term adjustments. Not all key reversal signals imply a trend reversal, which may lead to misjudgments. The probability of misjudgment can be reduced by optimizing parameters and adjusting profit taking and stop loss conditions.
Risk of failure to reverse or reverse again after reversal. Even with an accurate judgment, prices after reversal may turn around again or the original trend may continue. This faces the risk of losses. Manage losses in a timely manner by stop loss.
Backtest bias. The performance of any rules and signals in live trading may deviate from backtest results and fail to reproduce backtest profits.
Optimization Directions
The main optimization directions for the key reversal backtest strategy:
Optimize take profit and stop loss settings. Calculate appropriate levels based on more historical data.
Add filter conditions combined with other technical indicators to avoid misjudgments. For example, confirm reversal signals with trading volume to avoid misleading by arbitrage operations.
Optimize tracking strategy after reversal. Price movements after reversal also have certain rules to follow. Set up subsequent tracking strategies to further increase returns.
Use machine learning models to judge signal quality. Train models to evaluate the reliability of each key reversal signal and avoid tracking poor quality signals.
Summary
The key reversal signal strategy captures price trend reversal opportunities by identifying key reversal days. The strategy rules are simple and clear, and easy to implement. The trend after reversal has large space to run, but there are also certain risks of misjudgment. By continuously optimizing parameters and filter criteria to reduce misjudgment, relatively reliable results can be obtained.
Parameters
| Name | Default | What it controls |
|---|---|---|
| v_input_1 | true | Enter the number of bars over which to look for a new low in prices. |
| v_input_2 | 20 | Take Profit pip |
| v_input_3 | 10 | Stop Loss pip |
Source Pine Script
/*backtest
start: 2024-01-18 00:00:00
end: 2024-01-25 00:00:00
period: 1h
basePeriod: 15m
exchanges: [{"eid":"Futures_Binance","currency":"BTC_USDT"}]
*/

//@version=4
////////////////////////////////////////////////////////////
//  Copyright by HPotter v1.0 21/01/2020
//
// A key reversal is a one-day trading pattern that may signal the reversal of a trend.
// Other frequently-used names for key reversal include "one-day reversal" and "reversal day."
// How Does a Key Reversal Work?
// Depending on which way the stock is trending, a key reversal day occurs when:
// In an uptrend -- prices hit a new high and then close near the previous day's lows.
// In a downtrend -- prices hit a new low, but close near the previous day's highs
// WARNING:
// - For purpose educate only
// - This script to change bars colors.
////////////////////////////////////////////////////////////
strategy(title="Key Reversal Up Backtest", shorttitle="KRU Backtest", overlay = true)
nLength = input(1, minval=1, title="Enter the number of bars over which to look for a new low in prices.")
input_takeprofit = input(20, title="Take Profit pip", step=0.01)
input_stoploss = input(10, title="Stop Loss pip", step=0.01)
xLL = lowest(low[1], nLength)
C1 = iff(low < xLL and close > close[1], true, false)
plotshape(C1, style=shape.triangleup, size = size.small, color=color.green, location = location.belowbar )
posprice = 0.0
pos = 0
barcolor(nz(pos[1], 0) == -1 ? color.red: nz(pos[1], 0) == 1 ? color.green : color.blue )
posprice := iff(C1== true, close, nz(posprice[1], 0))
pos := iff(posprice > 0, 1, 0)
if (pos == 0)
    strategy.close_all()
if (pos == 1)
    strategy.entry("Long", strategy.long)
posprice := iff(low <= posprice - input_stoploss and posprice > 0, 0 ,  nz(posprice, 0))
posprice := iff(high >= posprice + input_takeprofit and posprice > 0, 0 ,  nz(posprice, 0))
Published by ChaoZhang on the FMZ strategy square · last modified 2024-01-26. Collected in the Quant Trading Vault. Unvalidated research: re-test with your own data and costs before trusting it.
Build this with AgenKit
A spec is not a trading system. Paste this into your coding agent and AgenKit runs a specialist team — architecture, test-first build, risk gates, review — with paper trading on by default.
/agenkit build a production-grade trading bot with a backtest engine, risk controls and paper trading by default from strategies/Key-Reversal-Backtest-Strategy-440103.md- npx agenkit install engineering-kit in your project
- Paste the command into your agent and approve each phase
- Get tests, backtest, risk controls and a paper-trading switch
Understand it first
Before you run this, read the lesson behind the idea and how to backtest it honestly. Specs like this one are the survivors of an unknown number of trials; deflate their results accordingly.
Related specs
- 1 2 3 Pattern Quantitative Trading Strategy with EMAs MACD and 4th Candle ExtensionPine Script · Mean reversion · 1h
- 3 10 Oscillator Profile Flagging StrategyPine Script · Mean reversion · 1d
- A Trend Reversal Strategy Based on Moving Averages Price Patterns and VolumePine Script · Mean reversion · 1d
- ATR and EMA based Dynamic Take Profit and Stop Loss Adaptive StrategyPine Script · Mean reversion · 1h
- Adaptive Mean Reversion Trading Strategy Based on Chande Momentum OscillatorPine Script · Mean reversion · 1d
- Adaptive Moving Average Tracking StrategyPine Script · Mean reversion · 1d