Strategy vault / Mean reversion
Kijun Loopback Strategy
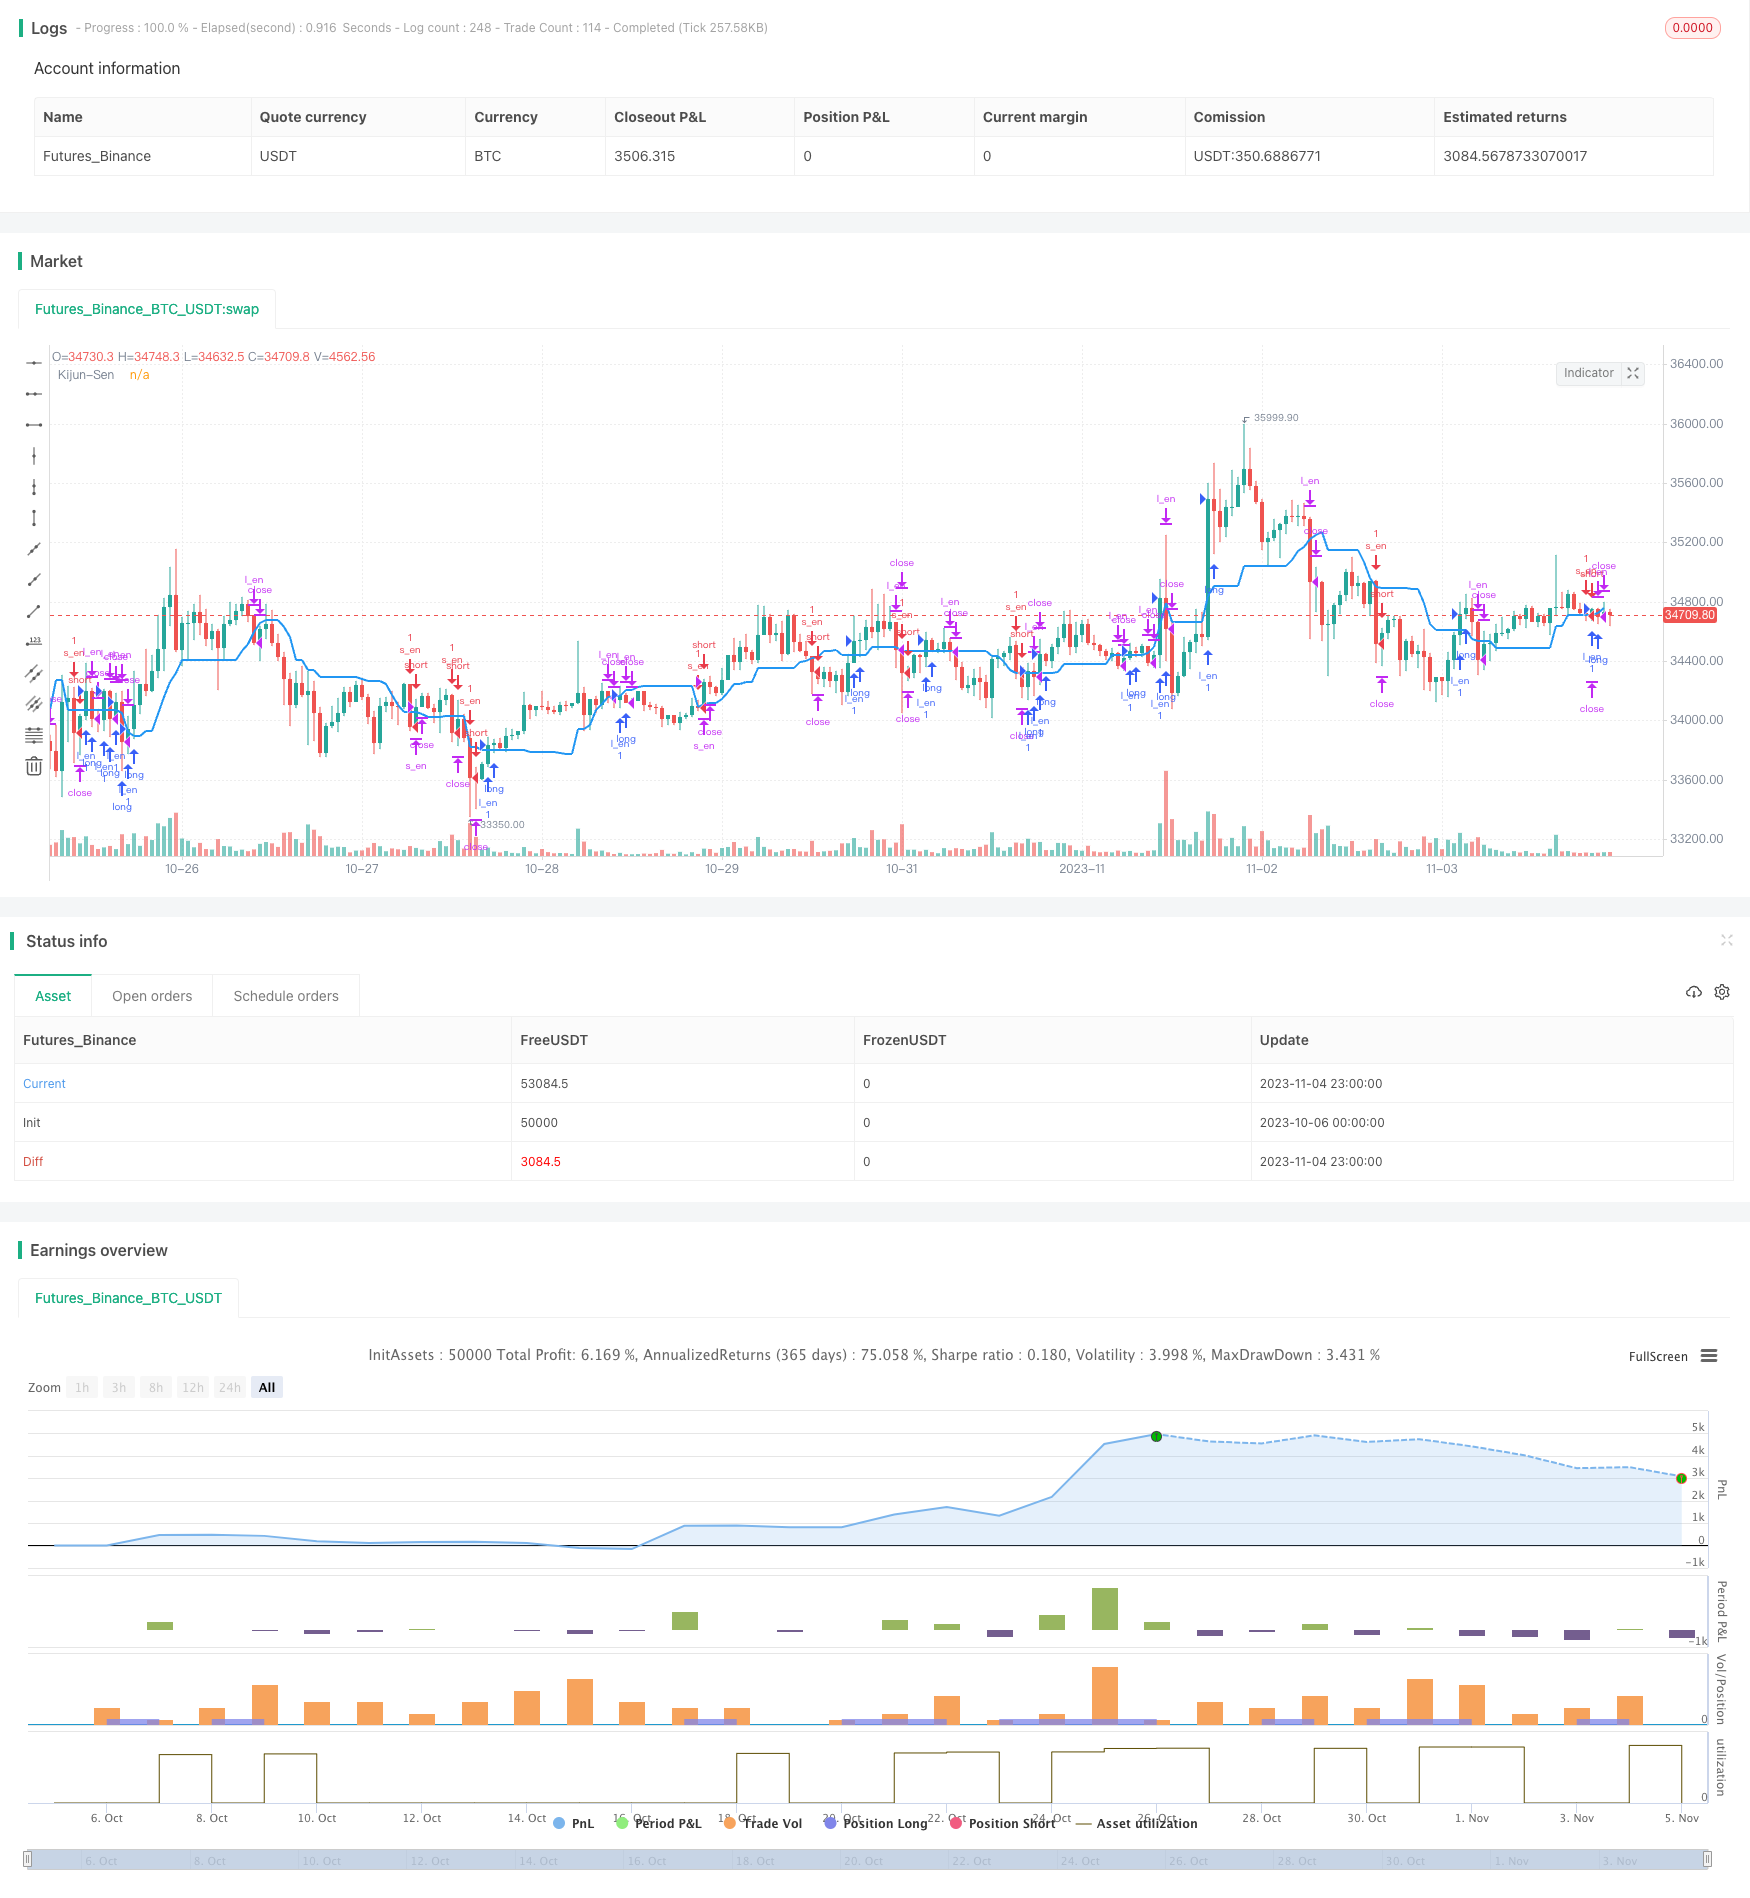
The Kijun Loopback strategy utilizes the Kijun-sen line from the Ichimoku Cloud indicator to determine long and short positions based on price crossover of the Kijun-sen line. It is a trend following strategy. By…
Overview
The Kijun Loopback strategy utilizes the Kijun-sen line from the Ichimoku Cloud indicator to determine long and short positions based on price crossover of the Kijun-sen line. It is a trend following strategy. By capturing loopbacks of the Kijun-sen line, this strategy aims to identify trend reversal points effectively with advantages like strong trend catching capability and controllable drawdowns.
Strategy Logic
The Kijun Loopback strategy uses the Kijun-sen line from the Ichimoku Cloud as the baseline for decisions. The Kijun-sen is an average line calculated from the highest and lowest prices over a given period. When the price crosses above the Kijun-sen line, a long position is opened. When the price crosses below the Kijun-sen line, a short position is opened. In this way, the loopbacks of the Kijun-sen line are used to detect turning points in the price trend for trend following.
Specifically, the strategy determines Kijun-sen loopbacks using the Base Long and Base Short conditions. The Base Long condition is open < Kijun-sen and close > Kijun-sen, indicating an upcross of the Kijun-sen line. The Base Short condition is open > Kijun-sen and close < Kijun-sen, indicating a downcross. When Base Long triggers, a long position is opened. When Base Short triggers, a short position is opened. The exit conditions are when the price re-crosses the Kijun-sen in the opposite direction, i.e. close below the Kijun-sen for long trades and close above for short trades.
Thus, the loopbacks of the Kijun-sen line are used to catch trend reversal points for trend following.
Advantage Analysis
The Kijun Loopback strategy has the following advantages:
Strong capability in catching trend reversals. The Kijun-sen line reflects price trends well. Its loopbacks represent trend reversals. The strategy can timely catch reversal points for trend following.
Controllable drawdown risks. The strategy uses the Kijun-sen to limit drawdown ranges, better than simple moving average strategies.
Simple to implement. The strategy needs only one indicator, the Kijun-sen. The logic is simple and clean.
Wide applicability. It can be applied on different timeframes and major trading instruments.
Low data demand. The strategy needs only price data, without heavy indicator computations.
Risk Analysis
The Kijun Loopback strategy also has the following risks:
Tendency to generate excessive trading signals. Frequent Kijun-sen loopbacks can lead to over-trading, increasing costs from commissions and slippage.
Limited drawdown control capability. The Kijun-sen can only limit drawdowns to some extent. Drawdowns may still be significant under extreme price swings.
Prone to wrong signals. Frequent crosses of the Kijun-sen may generate wrong signals with trend direction.
Performance variance among instruments. The Kijun-sen effectiveness varies significantly for different instruments. Parameter tuning is needed for each instrument.
Reliance on a single indicator. The single indicator design exposes the strategy to invalidations.
Solutions:
Optimize parameters to reduce trade frequency.
Add stop loss/profit taking to further control drawdowns.
Add filters to avoid wrong signals.
Tune parameters by instrument.
Incorporate more indicators in decision making.
Enhancement Directions
The Kijun Loopback strategy can be enhanced in the following aspects:
Strengthen trend determination. Incorporate additional trend indicators like MACD, Bollinger Bands to avoid reliance on a single indicator.
Optimize parameter settings. Adjust Kijun-sen period to balance win rate and profit speed. Test different stop loss/profit taking approaches.
Introduce volume analysis. Filter signals by volume to avoid unreasonable trades.
Parameter optimization across instruments. Use machine learning to obtain optimal parameter ranges for different instruments.
Improve entry timing. Add momentum indicators to enter on stronger momentum.
Refine stop loss strategy. Optimize stops to reduce unnecessary stop outs while maintaining win rate.
Incorporate risk management mechanisms. Dynamically adjust position sizing and stop loss based on changing market conditions for active risk control.
Summary
The Kijun Loopback strategy captures trend reversals using Kijun-sen loopbacks. It has advantages like strong trend catching and controllable drawdowns. But risks like wrong signals and drawdown control limitations exist. Future enhancements may include parameter optimization, adding auxiliary indicators etc. Overall, the Kijun strategy is simple and practical. With proper enhancements, it can become a solid core strategy in quantitative trading.
Parameters
| Name | Default | What it controls |
|---|---|---|
| v_input_1 | 14 | Average True Range Period |
| v_input_2 | 20 | Kijun Sen Period |
| v_input_3 | 4 | Risk % |
| v_input_4 | 30 | Equity Protection % |
| v_input_5 | 1.5 | Average True Range multiplier |
| v_input_6 | 100 | Target TP in Points |
Source Pine Script
/*backtest
start: 2023-10-06 00:00:00
end: 2023-11-05 00:00:00
period: 1h
basePeriod: 15m
exchanges: [{"eid":"Futures_Binance","currency":"BTC_USDT"}]
*/

//@version=4
strategy("Master VP","MVP",true)

//INDICATOR---------------------------------------------------------------------
    //Average True Range (1. RISK)
atr_period = input(14, "Average True Range Period")
atr = atr(atr_period)

    //Ichimoku Cloud - Kijun Sen (2. BASELINE)
ks_period = input(20, "Kijun Sen Period")
kijun_sen = (highest(high, ks_period) + lowest(low,ks_period))/2
base_long = open < kijun_sen and close > kijun_sen
base_short = open > kijun_sen and close < kijun_sen

//TRADE LOGIC-------------------------------------------------------------------
    //Long Entry
    //if -> WPR crosses below -39 AND MACD line is less than signal line
l_en = base_long
    //Long Exit
    //if -> WPR crosses above -14
l_ex = close < kijun_sen
    //Short Entry
    //if -> WPR crosses above -39 AND MACD line is greater than signal line
s_en = base_short
    //Short Exit
    //if -> WPR crosses under -14
s_ex = close > kijun_sen
strategy.initial_capital = 50000
//MONEY MANAGEMENT--------------------------------------------------------------
balance = strategy.netprofit + strategy.initial_capital //current balance
floating = strategy.openprofit          //floating profit/loss
risk = input(4,"Risk %")/100           //risk % per trade
equity_protector = input(30,"Equity Protection %")/100  //equity protection %
stop = atr*100000*input(1.5,"Average True Range multiplier")    //Stop level
target = input(100, "Target TP in Points")  //TP level
    //Calculate current DD and determine if stopout is necessary
equity_stopout = false
if(floating<0 and abs(floating/balance)>equity_protector)
    equity_stopout := true

    //Calculate the size of the next trade
temp01 = balance * risk     //Risk in USD
temp02 = temp01/stop        //Risk in lots
temp03 = temp02*100000      //Convert to contracts
size = temp03 - temp03%1000 //Normalize to 1000s (Trade size)
if(size < 1000)
    size := 1000            //Set min. lot size

//TRADE EXECUTION---------------------------------------------------------------
strategy.close_all(equity_stopout)      //Close all trades w/equity protector
is_open = strategy.opentrades > 0

if true
    strategy.entry("l_en",true,oca_name="a",when=l_en and not is_open)  //Long entry
    strategy.entry("s_en",false,oca_name="a",when=s_en and not is_open) //Short entry

    strategy.exit("S/L","l_en",loss=stop, profit=target)      //Long exit (stop loss)
    strategy.close("l_en",when=l_ex)            //Long exit (exit condition)
    strategy.exit("S/L","s_en",loss=stop, profit=target)      //Short exit (stop loss)
    strategy.close("s_en",when=s_ex)            //Short exit (exit condition)

//PLOTTING----------------------------------------------------------------------
plot(kijun_sen,"Kijun-Sen",color.blue,2)Published by ChaoZhang on the FMZ strategy square · last modified 2023-11-06. Collected in the Quant Trading Vault. Unvalidated research: re-test with your own data and costs before trusting it.
Build this with AgenKit
A spec is not a trading system. Paste this into your coding agent and AgenKit runs a specialist team — architecture, test-first build, risk gates, review — with paper trading on by default.
/agenkit build a production-grade trading bot with a backtest engine, risk controls and paper trading by default from strategies/Kijun-Loopback-Strategy.md- npx agenkit install engineering-kit in your project
- Paste the command into your agent and approve each phase
- Get tests, backtest, risk controls and a paper-trading switch
Understand it first
Before you run this, read the lesson behind the idea and how to backtest it honestly. Specs like this one are the survivors of an unknown number of trials; deflate their results accordingly.
Related specs
- Dynamic Adaptive Multi Timeframe Trend Following and Range Reversal Hybrid StrategyPine Script · Mean reversion · 2d
- Multi Indicator Scoring Trading StrategyPine Script · Mean reversion · 1d
- Advanced Quantitative Trend Following and Cloud Reversal Composite Trading StrategyPine Script · Mean reversion · 1d
- Customizable Non Repainting HTF MACD MFI Scalable Bot StrategyPine Script · Mean reversion · 1d
- Dynamic MACD and Ichimoku Cloud Trading StrategyPine Script · Mean reversion · 1h
- MACD Cross Period Trading StrategyPine Script · Mean reversion · 1d