Strategy vault / Trend following
KST Indicator Profit Strategy
The KST Indicator Profit Strategy is a stock picking strategy applied to the 30-minute cycle of SPY. This strategy uses KST indicator crossovers to determine entry and exit timing.
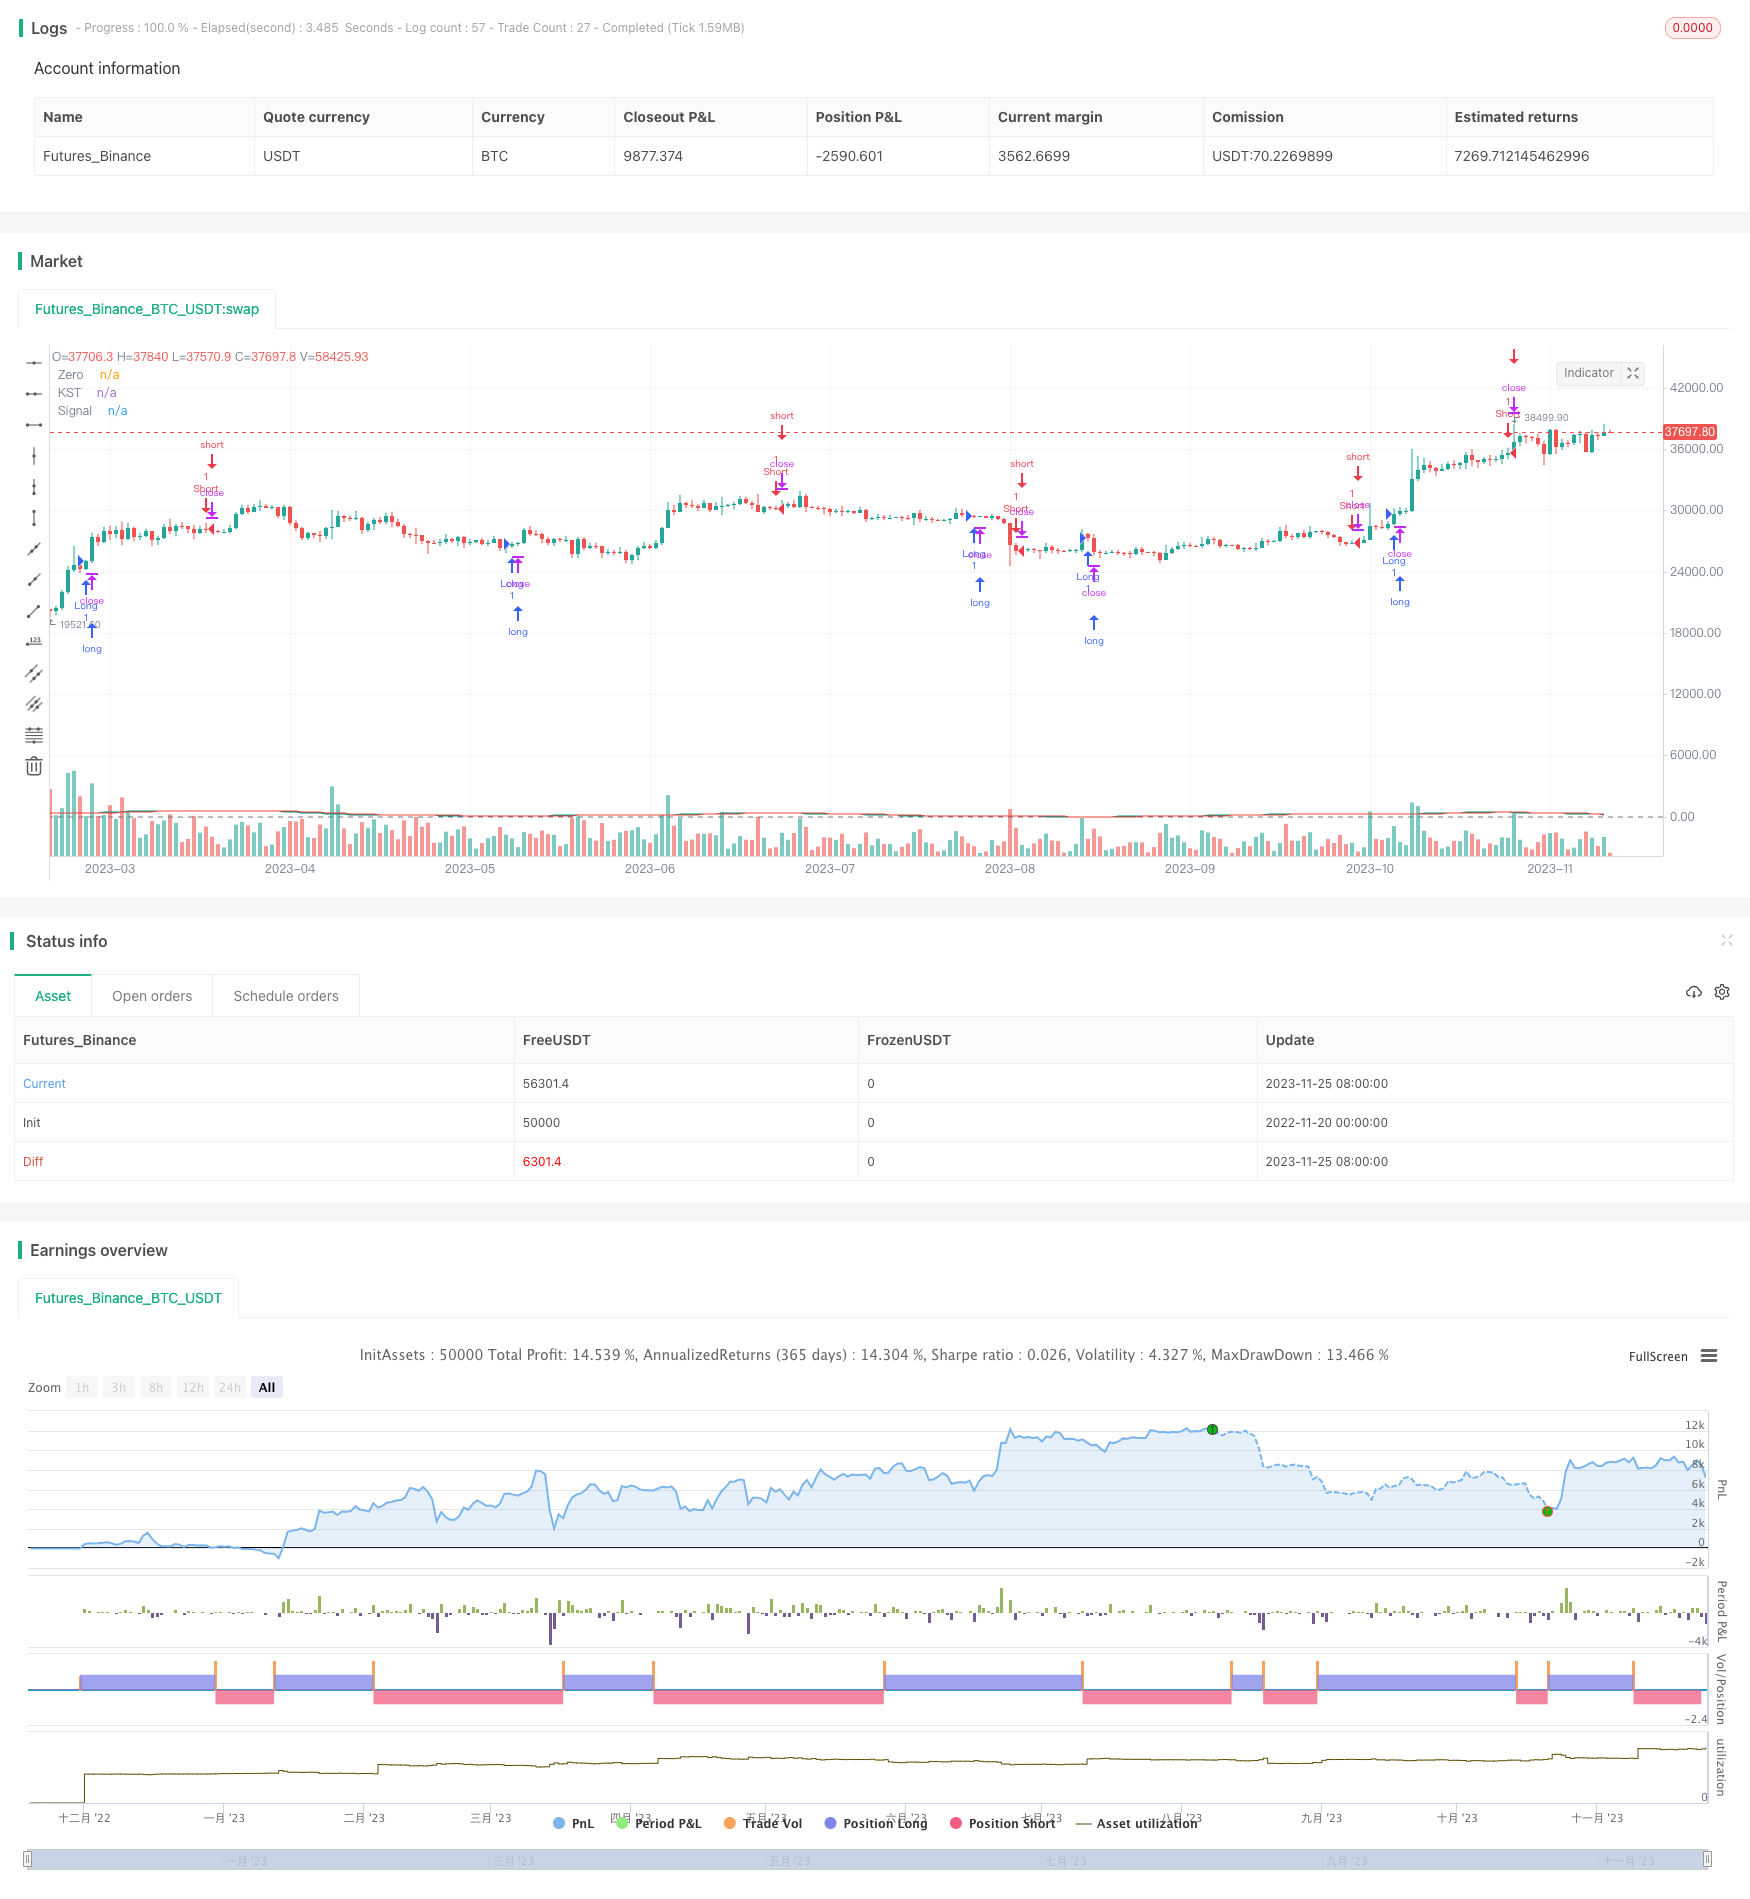
Overview
The KST Indicator Profit Strategy is a stock picking strategy applied to the 30-minute cycle of SPY. This strategy uses KST indicator crossovers to determine entry and exit timing.
Strategy Principle
This strategy is mainly based on the KST indicator. The KST indicator consists of the following parts:
- Four ROC curves with lengths of 11, 15, 20, and 33 respectively.
- Apply SMAs with lengths of 9, 14, 8, and 15 to smooth the above ROC curves.
- Take a weighted sum of the four smoothed ROC curves, with weights of 1, 2, 3 and 4 respectively.
- Apply a length 9 SMA to the final KST curve to derive the Signal line.
Buy and sell signals are determined by golden crosses and death crosses between the KST line and the Signal line:
- KST line crossing above Signal line is buy signal.
- KST line crossing below Signal line is sell signal.
Advantage Analysis
The main advantages of this strategy are:
The KST indicator comprehensively considers price movements over different time horizons, making the strategy more stable and reliable.
The weighted averaging of the ROC curves in the KST indicator ensures that longer-term price changes play a leading role, which helps capture market trends.
Works well in high liquidity products like SPY.
Risk Analysis
There are also some risks to this strategy:
Like MA indicators, the KST indicator can produce false signals in sideways markets. This can be improved by parameter tuning.
Entries and exits rely completely on the indicator without considering fundamentals or market regimes, leading to large losses during significant events.
The investment universe contains only SPY, so single-asset risk may be high.
Optimization Directions
Possible ways to optimize the strategy:
Optimize KST parameters to find best combination.
Incorporate volatility indicator to avoid false signals during choppy markets.
Add stop loss orders to limit downside risk per trade.
Expand stock pool to include individual stocks meeting certain criteria to improve robustness.
Conclusion
This strategy identifies short-term trends in SPY using the KST indicator, with good backtest results. We can improve its stability and real-world performance through parameter tuning, risk controls and expanding stock selection criteria. Making it more universally applicable.
Parameters
| Name | Default | What it controls |
|---|---|---|
| v_input_int_1 | 11 | ROC Length #1 |
| v_input_int_2 | 15 | ROC Length #2 |
| v_input_int_3 | 20 | ROC Length #3 |
| v_input_int_4 | 33 | ROC Length #4 |
| v_input_int_5 | 9 | SMA Length #1 |
| v_input_int_6 | 14 | SMA Length #2 |
| v_input_int_7 | 8 | SMA Length #3 |
| v_input_int_8 | 15 | SMA Length #4 |
| v_input_int_9 | 9 | Signal Line Length |
Source Pine Script
/*backtest
start: 2022-11-20 00:00:00
end: 2023-11-26 00:00:00
period: 1d
basePeriod: 1h
exchanges: [{"eid":"Futures_Binance","currency":"BTC_USDT"}]
*/

//@version=5
strategy("KST Strategy", shorttitle="KST", overlay=true)

roclen1 = input.int(11, minval=1, title="ROC Length #1")
roclen2 = input.int(15, minval=1, title="ROC Length #2")
roclen3 = input.int(20, minval=1, title="ROC Length #3")
roclen4 = input.int(33, minval=1, title="ROC Length #4")
smalen1 = input.int(9, minval=1, title="SMA Length #1")
smalen2 = input.int(14, minval=1, title="SMA Length #2")
smalen3 = input.int(8, minval=1, title="SMA Length #3")
smalen4 = input.int(15, minval=1, title="SMA Length #4")
siglen = input.int(9, minval=1, title="Signal Line Length")

smaroc(roclen, smalen) =>
    ta.sma(ta.roc(close, roclen), smalen)

kst = smaroc(roclen1, smalen1) + 2 * smaroc(roclen2, smalen2) + 3 * smaroc(roclen3, smalen3) + 4 * smaroc(roclen4, smalen4)
sig = ta.sma(kst, siglen)

// Plot the KST and Signal Line
plot(kst, color=#009688, title="KST")
plot(sig, color=#F44336, title="Signal")
hline(0, title="Zero", color=#787B86)

// Strategy logic
longCondition = ta.crossover(kst, sig)
shortCondition = ta.crossunder(kst, sig)

strategy.entry("Long", strategy.long, when=longCondition)
strategy.entry("Short", strategy.short, when=shortCondition)
Published by ChaoZhang on the FMZ strategy square · last modified 2023-11-27. Collected in the Quant Trading Vault. Unvalidated research: re-test with your own data and costs before trusting it.
Build this with AgenKit
A spec is not a trading system. Paste this into your coding agent and AgenKit runs a specialist team — architecture, test-first build, risk gates, review — with paper trading on by default.
/agenkit build a production-grade trading bot with a backtest engine, risk controls and paper trading by default from strategies/KST-Indicator-Profit-Strategy.md- npx agenkit install engineering-kit in your project
- Paste the command into your agent and approve each phase
- Get tests, backtest, risk controls and a paper-trading switch
Understand it first
Before you run this, read the lesson behind the idea and how to backtest it honestly. Specs like this one are the survivors of an unknown number of trials; deflate their results accordingly.
Related specs
- ADX MA and EMA Long Only Trend Tracking StrategyPine Script · Trend following · 1d
- ATR and Moving Average Crossover Hybrid StrategyPine Script · Trend following · 1h
- Adaptive FVG Detection and MA Trend Trading Strategy with Dynamic ResistancePine Script · Trend following · 1d
- Adaptive Risk Management Strategy Based on Dynamic ATR and Moving Average CrossoverPine Script · Trend following · 2h
- Adaptive Trading Strategy Based on Stochastic RSI Dual Line CrossoverPine Script · Trend following · 4h
- Adaptive Volatility Based Trend Following Short Strategy with Time Delay and Stop Loss ProtectionPine Script · Trend following · 2m