Strategy vault / Mean reversion
Linear Regression Moving Average Trading Strategy
The Linear Regression Moving Average trading strategy generates buy and sell signals based on the crossovers between a linear regression line and moving average of the stock price. This strategy combines trend…
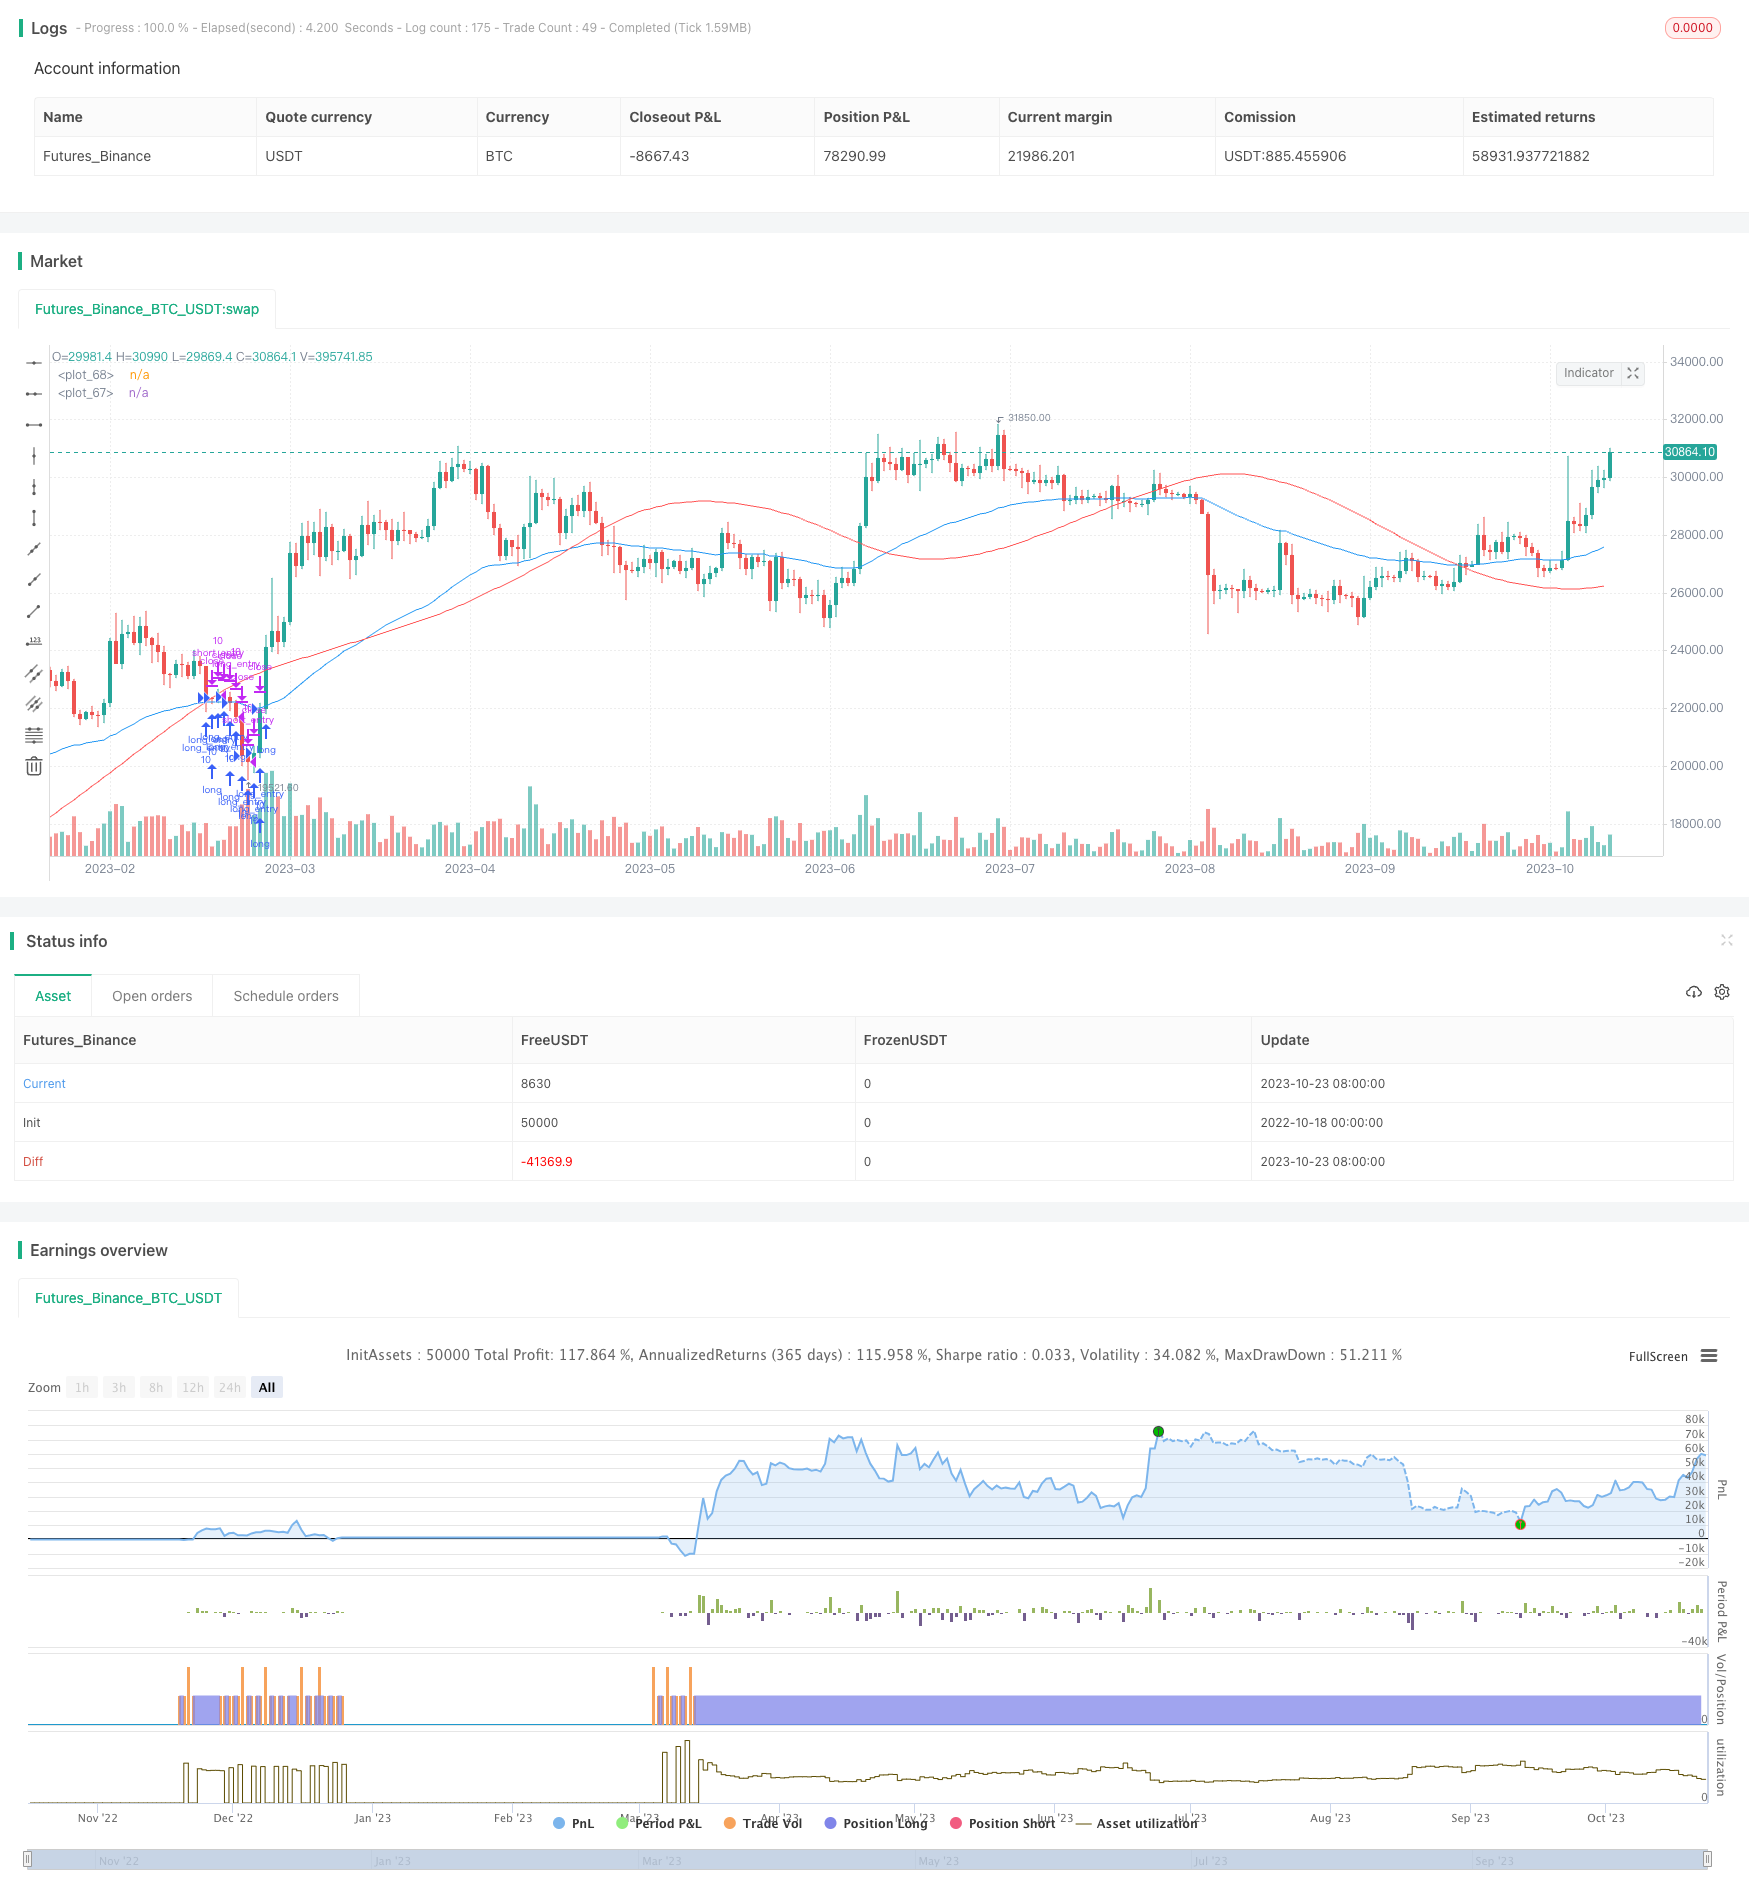
Overview
The Linear Regression Moving Average trading strategy generates buy and sell signals based on the crossovers between a linear regression line and moving average of the stock price. This strategy combines trend following with linear regression analysis to identify potential reversals and achieve buying low and selling high.
Strategy Logic
The strategy first calculates a n-day linear regression line and m-day moving average of the stock price. The regression line captures long term statistical trends while the moving average reflects short term momentum.
When the moving average crosses above the regression line, it signals strengthening upside momentum and generates a buy signal. When the moving average crosses below, it signals weakening upside and produces a sell signal.
Specifically, the strategy follows these steps to determine trade signals:
Calculate n-day linear regression line of prices lrLine
Calculate m-day simple moving average of lrLine called lrMA
Calculate m-day exponential moving average of prices called ema
When ema crosses above lrMA, generate buy signal longEntry
When ema crosses below lrMA, generate sell signal longExit
Only consider buy signals when market is bullish
Execute trades based on the signals
By using crossover between regression and moving averages to determine entries, the strategy can effectively filter out false breaks and identify reversals for buying low and selling high.
Advantages
- Combines trend and regression analysis for accurate signal identification
- Regression line is simple to calculate and implement
- Uses market filtering to avoid unfavorable trades
- Customizable parameters for adjusting strategy
- Achieves buying low and selling high for profit
Risks
- Frequent crossovers during volatility may generate false signals
- Inaccurate market filters lead to mistimed entries
- Poor parameter tuning impacts strategy performance
- High trading frequency leads to higher costs
Parameters should be tuned to increase moving average and regression line periods and reduce trade frequency. Reasonable stop losses should be implemented to control risks. Market filters can be enhanced to improve accuracy.
Enhancements
The strategy can be optimized in several aspects:
Moving average optimization by testing different types of MAs
Regression line optimization by adjusting calculation period
Market filter optimization by testing different indicators
Parameter optimization through rigorous backtesting
Stop loss optimization by testing different stop loss logics
Cost optimization by adjusting trade frequency based on costs
These optimizations can further improve the stability and profitability of the strategy.
Conclusion
The Linear Regression MA strategy integrates strengths of trend analysis and linear regression for effective reversal identification and buying low selling high. The straightforward strategy is suitable for stock picking over medium to long term horizons. With parameter tuning and risk control, the strategy can achieve even higher stability. It provides a viable technical trading framework for market analysis.
Parameters
| Name | Default | What it controls |
|---|---|---|
| v_input_bool_1 | true | Execute Long Trades |
| v_input_bool_2 | true | Execute Short Trades |
| v_input_bool_3 | true | Execute Stop Loss |
| v_input_float_1 | 10 | Max Profit (%) |
| v_input_float_2 | 1.75 | Stop Loss (%) |
| v_input_1 | true | Show Date Range |
| v_input_int_1 | true | (?Date Info)Start Month |
| v_input_int_2 | true | Start Day |
| v_input_int_3 | 2022 | Start Year |
| v_input_int_4 | 55 | (?Averages)Linear Regression Line |
| v_input_int_5 | 55 | Linear Regression MA |
| v_input_int_6 | 55 | EMA Length |
Source Pine Script
/*backtest
start: 2022-10-18 00:00:00
end: 2023-10-24 00:00:00
period: 1d
basePeriod: 1h
exchanges: [{"eid":"Futures_Binance","currency":"BTC_USDT"}]
*/

// This source code is subject to the terms of the Mozilla Public License 2.0 at https://mozilla.org/MPL/2.0/
// © lazy_capitalist

//@version=5
strategy('Linear Regression MA', overlay=true, initial_capital=10000)
datesGroup = "Date Info"
startMonth = input.int(defval = 1,    title = "Start Month",  minval = 1, maxval = 12,  group=datesGroup)
startDay   = input.int(defval = 1,    title = "Start Day",    minval = 1, maxval = 31,  group=datesGroup)
startYear  = input.int(defval = 2022, title = "Start Year",   minval = 1970,            group=datesGroup)

averagesGroup = "Averages"
lrLineInput     = input.int(title="Linear Regression Line",   defval=55, minval = 1, group=averagesGroup)
lrMAInput       = input.int(title="Linear Regression MA",     defval=55, minval = 1, group=averagesGroup)
emaInput        = input.int(title="EMA Length",               defval=55, minval = 1, group=averagesGroup)


tradesGroup = "Execute Trades"
executeLongInput    = input.bool(title="Execute Long Trades",       defval=true)
executeShortInput   = input.bool(title="Execute Short Trades",      defval=true)
executeStopLoss     = input.bool(title="Execute Stop Loss",         defval=true)

fourHrSMAExpr       = ta.sma(close, 200)
fourHrMA            = request.security(symbol=syminfo.tickerid, timeframe="240", expression=fourHrSMAExpr)

bullish             = close > fourHrMA ? true : false


maxProfitInput              = input.float(  title="Max Profit (%)",         defval=10.0,    minval=0.0)   * 0.01
stopLossPercentageInput     = input.float(  title="Stop Loss (%)",          defval=1.75,    minval=0.0)   * 0.01

start       = timestamp(startYear, startMonth, startDay, 00, 00)            // backtest start  window
window()    => time >= start ? true : false                              // create function "within window of time"
showDate    = input(defval = true, title = "Show Date Range")

lrLine = ta.linreg(close, lrLineInput, 0)
lrMA   = ta.sma(lrLine, lrMAInput)
ema     = ta.ema(close, emaInput)

longEntry   = ema   < lrMA
longExit    = lrMA  < ema

shortEntry  = lrMA  < ema
shortExit   = ema   < lrMA


maxProfitLong   = strategy.opentrades.entry_price(0) * (1 + maxProfitInput)
maxProfitShort  = strategy.opentrades.entry_price(0) * (1 - maxProfitInput)

stopLossPriceShort  = strategy.position_avg_price * (1 + stopLossPercentageInput)
stopLossPriceLong   = strategy.position_avg_price * (1 - stopLossPercentageInput)

if(executeLongInput and bullish)
    strategy.entry( id="long_entry", direction=strategy.long,   when=longEntry and window(),    qty=10,  comment="long_entry")
    strategy.close( id="long_entry", when=longExit,     comment="long_exit")
    // strategy.close( id="long_entry", when=maxProfitLong <= close, comment="long_exit_mp")

if(executeShortInput and not bullish)
    strategy.entry( id="short_entry", direction=strategy.short,   when=shortEntry and window(),    qty=10,  comment="short_entry")
    strategy.close( id="short_entry", when=shortExit,     comment="short_exit")
    // strategy.close( id="short_entry", when=maxProfitShort <= close, comment="short_exit_mp")

if(strategy.position_size > 0 and executeStopLoss)
    strategy.exit(  id="long_entry",        stop=stopLossPriceLong,             comment="exit_long_SL")
    strategy.exit(  id="short_entry",       stop=stopLossPriceShort,            comment="exit_short_SL")

// plot(series=lrLine,     color=color.green)
plot(series=lrMA,       color=color.red)
plot(series=ema,        color=color.blue)
Published by ChaoZhang on the FMZ strategy square · last modified 2023-10-25. Collected in the Quant Trading Vault. Unvalidated research: re-test with your own data and costs before trusting it.
Build this with AgenKit
A spec is not a trading system. Paste this into your coding agent and AgenKit runs a specialist team — architecture, test-first build, risk gates, review — with paper trading on by default.
/agenkit build a production-grade trading bot with a backtest engine, risk controls and paper trading by default from strategies/Linear-Regression-Moving-Average-Trading-Strategy.md- npx agenkit install engineering-kit in your project
- Paste the command into your agent and approve each phase
- Get tests, backtest, risk controls and a paper-trading switch
Understand it first
Before you run this, read the lesson behind the idea and how to backtest it honestly. Specs like this one are the survivors of an unknown number of trials; deflate their results accordingly.
Related specs
- Advanced 15 Minute Chart Trading Signal StrategyPine Script · Mean reversion · 3h
- Advanced Momentum EMA Trend Following with RSI Overbought Oversold Trading StrategyPine Script · Mean reversion · 1d
- Advanced Quantitative Trading Strategy Combining RSI Divergence and Moving AveragesPine Script · Mean reversion · 1h
- Advanced Quantitative Trend Following and Cloud Reversal Composite Trading StrategyPine Script · Mean reversion · 1d
- BONK Multi Factor Trading StrategyPine Script · Mean reversion · 1d
- Bidirectional Moving Average Reversion Trading StrategyPine Script · Mean reversion · 1h