Strategy vault / Multi-timeframe
Long and Short Opening Strategy Based on Multi Timeframe Moving Average and MACD
This strategy takes full advantage of the functions of the multi timeframe exponential moving average (MTF EMA) to determine the trend direction and the MACD indicator to generate trading signals, while setting stop…
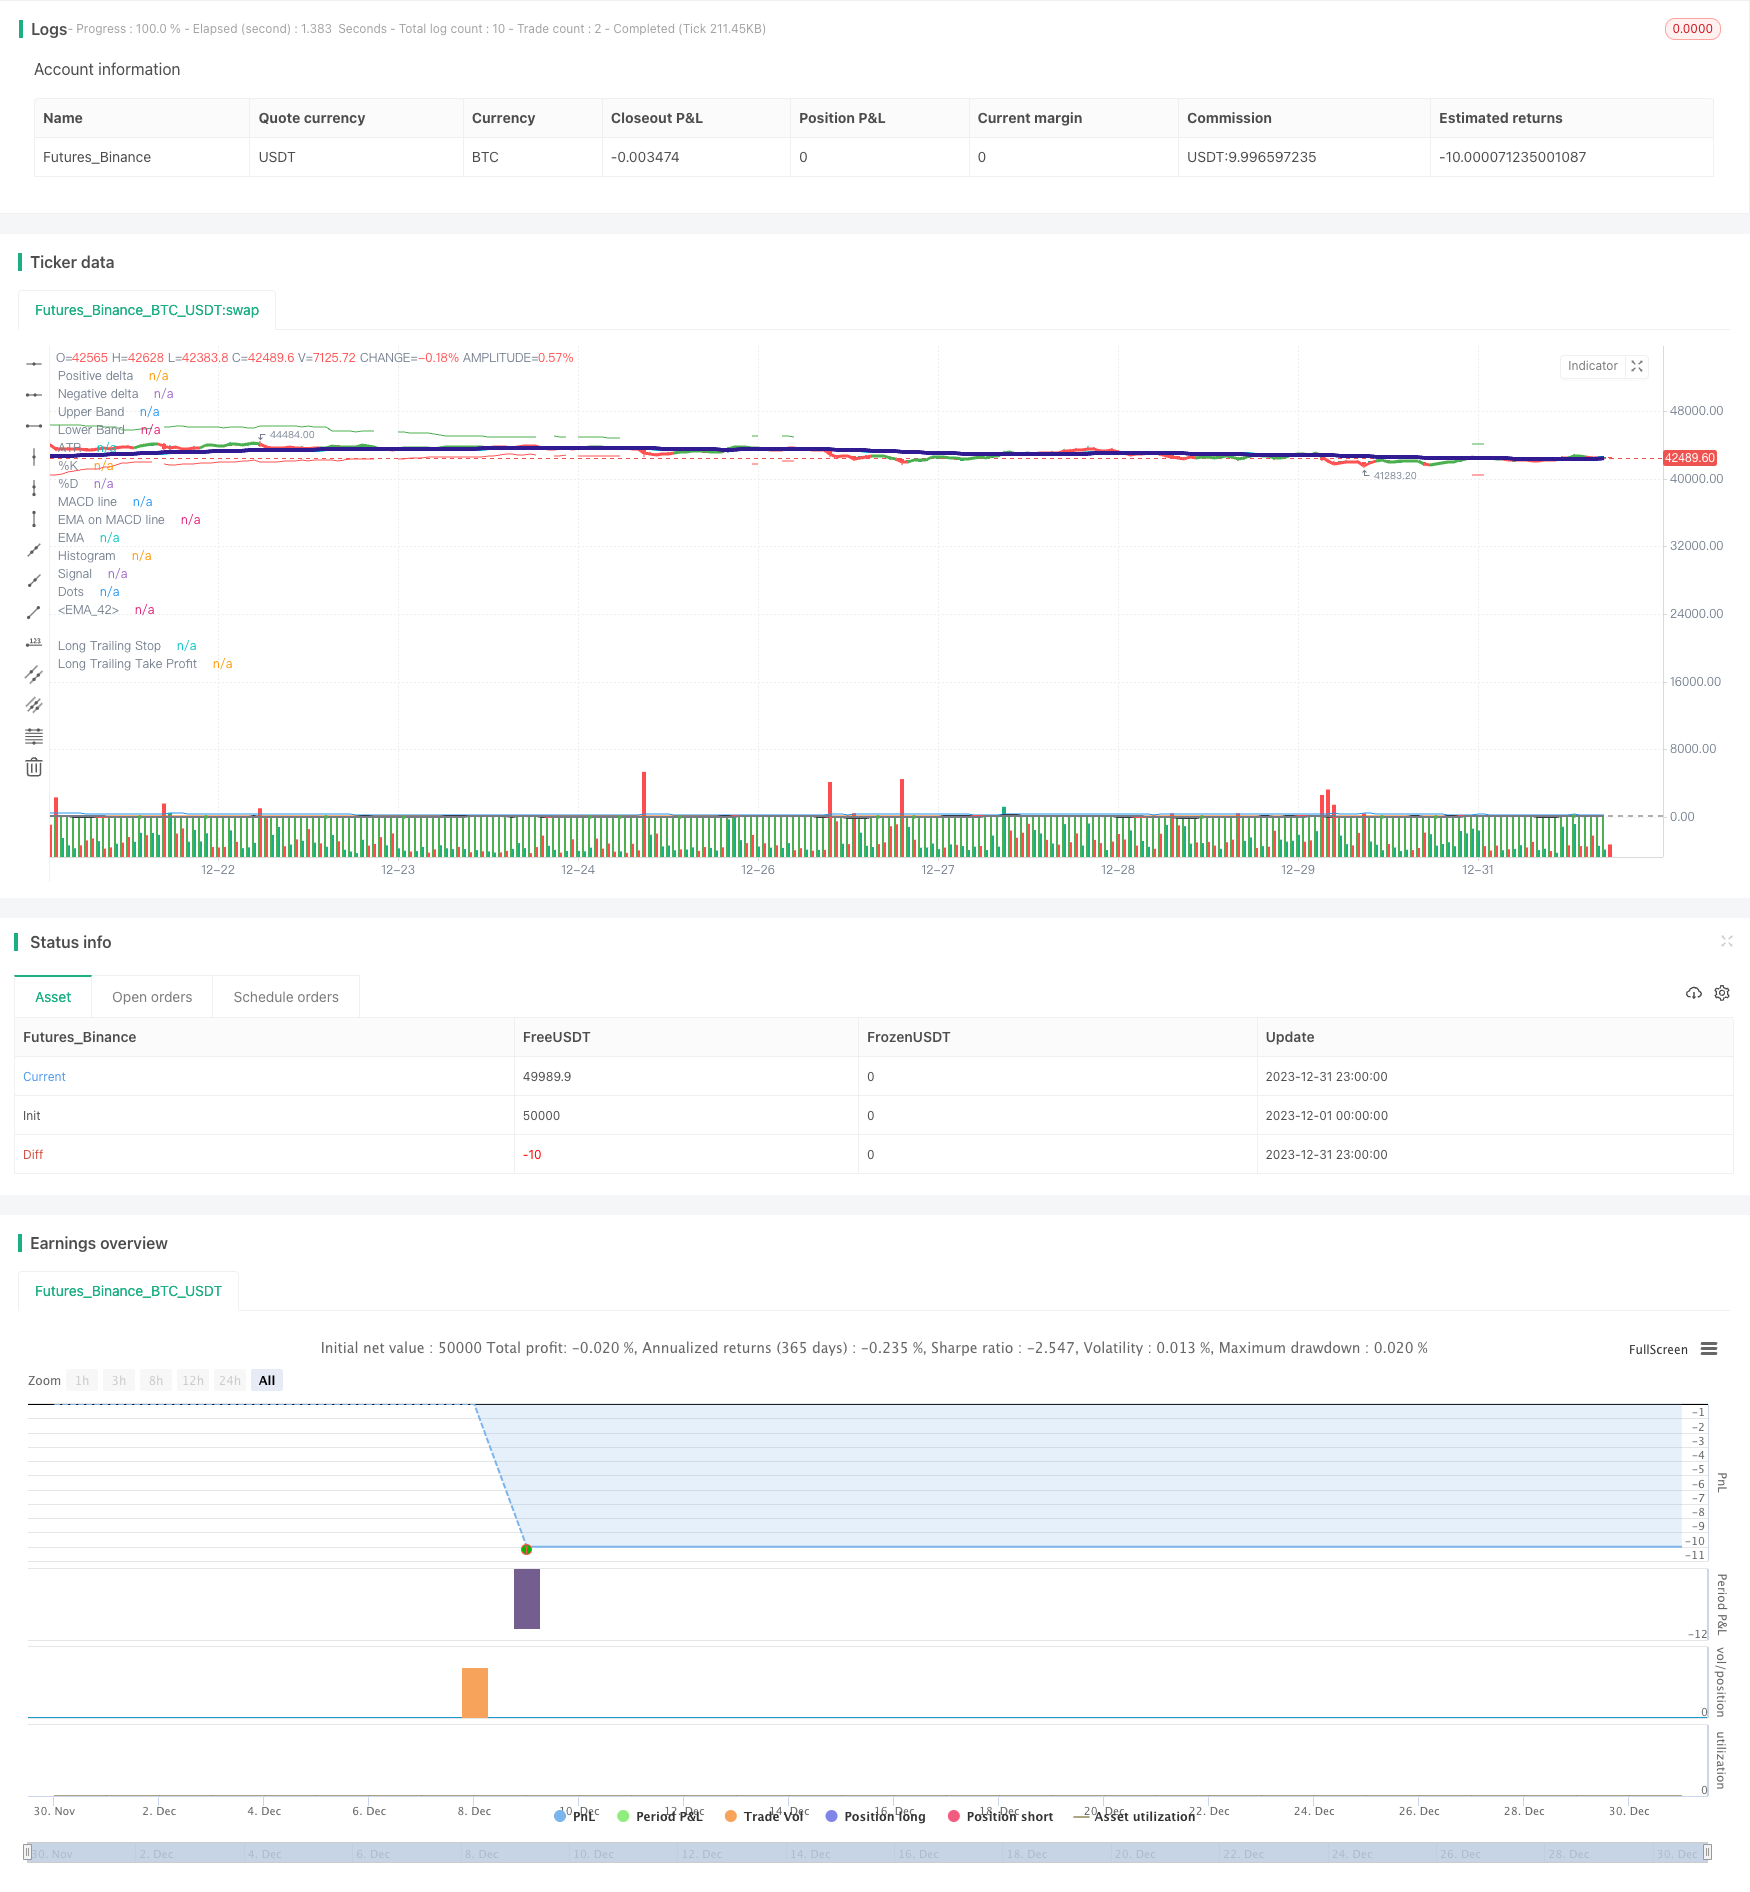
Overview
This strategy takes full advantage of the functions of the multi timeframe exponential moving average (MTF EMA) to determine the trend direction and the MACD indicator to generate trading signals, while setting stop loss and take profit prices with the ATR indicator. The strategy is suitable for digital and fiat currency pairs with strong trends and performs better in markets with strong trends.
Strategy Principle
1. Trend Judgment Using MTF EMA
The multi timeframe exponential moving average (MTF EMA) can display moving averages of multiple timeframes on the same chart to determine the overall long/short status of an asset. This strategy adopts 1-hour and 15-minute MTF EMAs.
When the price is above the 1-hour MTF EMA and the 1-hour MTF EMA is below the 15-minute MTF EMA, it is defined as an uptrend. When the price is below the 1-hour MTF EMA and the 1-hour MTF EMA is above the 15-minute MTF EMA, it is defined as a downtrend.
2. MACD Generating Trading Signals
When the MACD line crosses above the Signal line from below, a buy signal is generated. When it crosses below from above, a sell signal is generated. At the same time, a crossover limit is set for the MACD line and Signal line to avoid false signals.
3. Setting Stop Loss and Take Profit with ATR
The ATR indicator is used to set stop loss and take profit prices. ATR can dynamically set reasonable stop loss and take profit distances based on market volatility. At the same time, the multiples of stop loss and take profit are set based on the backtest of highs and lows to make them more flexible.
Trading Strategy
Open Positions Signals
Long signal: Uptrend and MACD crossing above Signal line and crossover value less than limit Short signal: Downtrend and MACD crossing below Signal line and crossover value greater than limit
Close Positions Signals
Long take profit: Price breaks through ATR take profit price Long stop loss: Price breaks through ATR stop loss price Short take profit: Price breaks through ATR take profit price Short stop loss: Price breaks through ATR stop loss price
Advantage Analysis
The biggest advantage of this strategy is that it fully utilizes the strengths of the MTF EMA in determining trends and the MACD in generating trading signals. MTF EMA can clearly judge the overall trend direction and avoid frequent trading in choppy markets. The MACD indicator can better capture short-term changes in price patterns and generate trading signals. Using both together ensures capturing the trend while obtaining more trading opportunities. In addition, using the ATR indicator to dynamically track stop loss and take profit can effectively control the risk of individual trades.
Risks and Solutions
There are two main risks to this strategy: First, in the absence of a clear trend, MTF EMA may generate incorrect signals, leading to losses; Second, the MACD indicator often generates misleading signals when prices change dramatically, which can lead to over-trading. For the first risk, the MTF EMA parameters can be adjusted appropriately to better match price trend changes; The second risk can be mitigated by setting crossover limits for the MACD indicator.
Optimization Directions
The following aspects of the strategy could be optimized:
Adjust the cycle parameters of MTF EMA to match the price characteristics of different trading instruments better
Optimize the fast and slow moving average and signal line parameters of the MACD indicator for better signals
Test different ATR cycle parameters and stop loss/take profit multiples for the best returns
Add other auxiliary indicators to filter signals
Summary
This long and short opening strategy combines the methods of MTF EMA for trend judgment, MACD for trading signal generation, and ATR for dynamic stop loss and take profit. It can achieve good returns in markets with obvious trends. There is plenty of room for optimizing this strategy's parameters and optimization to achieve better performance. However, it is necessary to control risks and avoid blind trading in choppy markets.
Parameters
| Name | Default | What it controls |
|---|---|---|
| v_input_1 | true | From Day |
| v_input_2 | 4 | From Month |
| v_input_3 | 2022 | From Year |
| v_input_4 | true | To Day |
| v_input_5 | 5 | To Month |
| v_input_6 | 2022 | To Year |
| v_input_7 | false | ═════════════════════ SOURCE ═════════════════════ |
| v_input_8 | true | Source hl2 or (open+close)/2 ? |
| v_input_9 | false | ════════════════════ MTF EMA ════════════════════ |
| v_input_10 | 60 | MTF EMA 1 |
| v_input_11 | 70 | EMA Period 1 |
| v_input_12 | 15 | MTF EMA 2 |
| v_input_13 | 68 | EMA Period 2 |
| v_input_14 | false | ═════════════════════ MACD ══════════════════════ |
| v_input_15 | 13 | MACD fast moving average |
| v_input_16 | 18 | MACD slow moving average |
| v_input_17 | 24 | MACD signal line moving average |
| v_input_18 | 9 | MACD EMA period |
| v_input_19 | true | Use EMA (otherwise SMA) |
| v_input_20 | false | Use normal MACD |
| v_input_21 | 180 | LONG MACD and signal crossover limit |
| v_input_22 | false | Show MACD ribbon? |
| v_input_23 | 3 | MACD ribbon multiplier |
| v_input_24 | false | ═══════════════════ STOCHASTIC ════════════════════ |
| v_input_25 | true | Stochastic On? |
| v_input_26 | 10 | K |
| v_input_27 | true | D |
| v_input_28 | 3 | Smooth |
| v_input_29 | 30 | Stoch value crossover |
| v_input_30 | true | avg price length |
| v_input_31 | false | ═════════════════ LONG SL ═════════════════ |
| v_input_32 | 5 | Max Intraday Loss(%) |
| v_input_33 | false | Long Stop Loss when MTF EMA cross? |
| v_input_34 | false | Long Stop Loss (%) on? |
| v_input_35 | 4.7 | Long Stop Loss (%) |
| v_input_36 | true | Long Stop Loss ATR? |
| v_input_37 | true | Look back for High/Lows? |
| v_input_38 | 18 | How far to look back for High/Lows: |
| v_input_39 | 9 | Long ATR Lenghth |
| v_input_40 | 4.3 | Long ATR Stop x ? |
| v_input_41 | false | ═════════════════ LONG TP ═════════════════ |
| v_input_42 | true | Long Take Profit (%) on? |
| v_input_43 | 5.3 | Long Take Profit (%) |
| v_input_44 | true | 1 Long Take Profit On? |
| v_input_45 | true | Look back for High/Lows? |
| v_input_46 | 12 | How far to look back for High/Lows for 1 TP |
| v_input_47 | 24 | Long ATR Lenghth 1 TP |
| v_input_48 | 5.5 | First Long ATR Take Profit x ? |
Source Pine Script
/*backtest
start: 2023-12-01 00:00:00
end: 2023-12-31 23:59:59
period: 1h
basePeriod: 15m
exchanges: [{"eid":"Futures_Binance","currency":"BTC_USDT"}]
*/

// This source code is subject to the terms of the Mozilla Public License 2.0 at https://mozilla.org/MPL/2.0/
// © Steven A. Zmuda Burke / stevenz17
//@version=4
// From Date Inputs
fromDay = input(defval = 01, title = "From Day", minval = 1, maxval = 31)
fromMonth = input(defval = 04, title = "From Month", minval = 1, maxval = 12)
fromYear = input(defval = 2022, title = "From Year", minval = 1970)

// To Date Inputs
toDay = input(defval = 01, title = "To Day", minval = 1, maxval = 31)
toMonth = input(defval = 05, title = "To Month", minval = 1, maxval = 12)
toYear = input(defval = 2022, title = "To Year", minval = 1970)

// Calculate start/end date and time condition
startDate = timestamp(fromYear, fromMonth, fromDay, 00, 00)
finishDate = timestamp(toYear, toMonth, toDay, 00, 00)
time_cond = true

// Input
strategy("LONG", overlay=true, initial_capital=1000, default_qty_type=strategy.percent_of_equity, default_qty_value=100, slippage=1, commission_type=strategy.commission.percent,
     commission_value=0.015)
SOURCE = input(title = "═════════════════════ SOURCE ═════════════════════", defval = false, type = input.bool)
sourcehl2 = input(title="Source hl2 or (open+close)/2 ?",type=input.bool,defval=true)
source = sourcehl2 ? hl2 : ((open+close)/2)

//MTF EMA
MTFEMA = input(title = "════════════════════ MTF EMA ════════════════════", defval = false, type = input.bool)

res1=input(title="MTF EMA 1", type=input.resolution, defval="60")
len1 = input(title = "EMA Period 1", type=input.integer, defval=70, minval=1)
ema1 = ema(source, len1)
emaStep1 = security (syminfo.tickerid, res1, ema1, barmerge.gaps_off, barmerge.lookahead_off)
mtf1 = emaStep1

res2=input(title="MTF EMA 2", type=input.resolution, defval="15")
len2 = input(title = "EMA Period 2", type=input.integer, defval=68, minval=1)
ema2 = ema(source, len2)
emaStep2 = security (syminfo.tickerid, res2, ema2, barmerge.gaps_off, barmerge.lookahead_off)
mtf2 = emaStep2

t1 = plot(mtf1, linewidth=4, color= color.aqua, title="EMA")
t2 = plot(mtf2, linewidth=4, color= color.navy, title="EMA")
fill(t1, t2, transp = 70, color = mtf1 > mtf2 ? color.red : color.green)

///MACD
MACD= input(title = "═════════════════════ MACD ══════════════════════", defval = false, type = input.bool)
MACDsource=close
fastLength = input(13, minval=1, title="MACD fast moving average")
slowLength=input(18,minval=1, title="MACD slow moving average")
signalLength=input(24,minval=1, title="MACD signal line moving average")
MacdEmaLength =input(9, title="MACD EMA period", minval=1)
useEma = input(true, title="Use EMA (otherwise SMA)")
useOldAlgo = input(false, title="Use normal MACD")
Lmacsig=input(title="LONG MACD and signal crossover limit",type=input.integer,defval=180)

// Fast line
ma1= useEma ? ema(MACDsource, fastLength) : sma(MACDsource, fastLength)
ma2 = useEma ?  ema(ma1,fastLength) :  sma(ma1,fastLength)
fastMA = ((2 * ma1) - ma2)

// Slow line
mas1=  useEma ? ema(MACDsource , slowLength) :  sma(MACDsource , slowLength)
mas2 =  useEma ? ema(mas1 , slowLength): sma(mas1 , slowLength)
slowMA = ((2 * mas1) - mas2)

// MACD line
macd = fastMA - slowMA

// Signal line
emasig1 = ema(macd, signalLength)
emasig2 = ema(emasig1, signalLength)
signal = useOldAlgo ? sma(macd, signalLength) : (2 * emasig1) - emasig2

hist = macd - signal

histline = hist > 0 ? color.green : color.red

//MACD ribbon
macdribbon=input(title="Show MACD ribbon?",type=input.bool,defval=false)
macdx=input(title="MACD ribbon multiplier", type=input.integer, defval=3, minval=1)

leadLine1 = macdribbon ? macd*macdx + source : na
leadLine2 = macdribbon ? signal*macdx + source : na
leadLine3 = hist + source

//MACD plot
p3 = plot(leadLine1, color= color.green, title="MACD", transp = 100, linewidth = 8)
p4 = plot(leadLine2, color= color.red, title="Signal", transp = 100, linewidth = 8)
fill(p3, p4, transp = 20, color = leadLine1 > leadLine2 ? #53b987 : #eb4d5c)

plot((leadLine3), color = histline, title="Histogram", linewidth = 3)


l="TEst"

upHist = (hist > 0) ? hist : 0
downHist = (hist <= 0) ? hist : 0

p1 = plot(upHist, color=color.green, transp=40, style=plot.style_columns, title='Positive delta')
p2 = plot(downHist, color=color.green, transp=40, style=plot.style_columns, title='Negative delta')

zeroLine = plot(macd, color=color.black, transp=0, linewidth=2, title='MACD line')
signalLine = plot(signal, color=color.gray, transp=0, linewidth=2, title='Signal')

ribbonDiff = color.green
fill(zeroLine, signalLine, color=ribbonDiff)

circleYPosition = signal
plot(ema(macd,MacdEmaLength) , color=color.red, transp=0, linewidth=2, title='EMA on MACD line')

ribbonDiff2 = hist > 0 ? color.green : color.red
plot(crossunder(signal,macd) ? circleYPosition : na,style=plot.style_circles, linewidth=4, color=ribbonDiff, title='Dots')


//STOCHASTIC
stochchch= input(title = "═══════════════════ STOCHASTIC ════════════════════", defval = false, type = input.bool)
StochOn = input(title="Stochastic On?",type=input.bool,defval=true)
periodK = input(10, title="K", minval=1)
periodD = input(1, title="D", minval=1)
smoothK = input(3, title="Smooth", minval=1)
stochlimit = input(30, title="Stoch value crossover", minval=1)
k = sma(stoch(close, high, low, periodK), smoothK)
d = sma(k, periodD)

stochSignal = StochOn ? (d < stochlimit ? true : false) : true

pp= input(1, title="avg price length", minval=1)
p = ema (source, pp)
K = k + p

plot(k, title="%K", color=#0094FF)
plot(d, title="%D", color=#FF6A00)
h0 = hline(72, "Upper Band", color=#606060)
h1 = hline(20, "Lower Band", color=#606060)
fill(h0, h1, color=#9915FF, transp=80, title="Background")


//Long
LS= "════════════════════════════════ LONG CONDITIONS ═══════════════════════════"

uptrend = close > mtf1 and mtf1 < mtf2
downtrend = close < mtf1 and mtf1 > mtf2

crossMACD = crossunder(macd,signal)

LongBuy = uptrend and stochSignal? crossMACD and signal < Lmacsig and macd < Lmacsig : na

LONG = strategy.position_size > 0
SHORT = strategy.position_size < 0
FLAT = strategy.position_size == 0

plotshape(LongBuy, style=shape.xcross, text="LONG", color=color.green)

//ATR & TP/SL

ATRTPSLX= input(title = "═════════════════ LONG SL ═════════════════", defval = false, type = input.bool)

maxIdLossPcnt = input(5, "Max Intraday Loss(%)", type=input.float, minval=0.0, step=0.1)
// strategy.risk.max_intraday_loss(maxIdLossPcnt, strategy.percent_of_equity)

SSL2=input(title="Long Stop Loss when MTF EMA cross?",type=input.bool,defval=false)

SSLOP = LONG  and crossunder(source, mtf1)

SlossPercOn = input(title="Long Stop Loss (%) on?",type=input.bool,defval=false)
SlossPerc = input(title="Long Stop Loss (%)", type=input.float, minval=0.0, step=0.1, defval=4.7) * 0.01
SSpricePerc = LONG and SlossPercOn? strategy.position_avg_price * (-1 - SlossPerc) : na
plot(series = SSpricePerc, linewidth=2, color= color.maroon,style=plot.style_linebr, title="Long Stop Loss %")
SSLX = LONG and crossunder(source, SSpricePerc)

SSLatr= input(title="Long Stop Loss ATR?",type=input.bool,defval=true)
useStructure=input(title="Look back for High/Lows?",type=input.bool,defval=true)
Slookback=input(title="How far to look back for High/Lows:",type=input.integer,defval=18,minval=1)
SatrLenghth=input(title="Long ATR Lenghth",type=input.integer,defval=9,minval=1)
SatrStopMultiplier=input(title="Long ATR Stop x ?", type=input.float,defval=4.3, minval=0.1,step=0.1)

Satr = atr(SatrLenghth)
LongStop = SSLatr ? ((useStructure ? lowest(low, Slookback) : source) - Satr * SatrStopMultiplier) : na

SStop = crossunder(source,LongStop)

plot(Satr, color=color.blue, title="ATR", transp=100)
plot(series = uptrend ? LongStop : na, color=color.red, style=plot.style_linebr, title="Long Trailing Stop", transp=0)


ATRTPSLXX= input(title = "═════════════════ LONG TP ═════════════════", defval = false, type = input.bool)

TpPercOn = input(title="Long Take Profit (%) on?",type=input.bool,defval=true)
TpPerc = input(title="Long Take Profit (%)", type=input.float, minval=0.0, step=0.1, defval=5.3) * 0.01
TppricePerc = LONG and TpPercOn? strategy.position_avg_price * (-1 + TpPerc) : na
plot(series = TppricePerc, linewidth=2, color= color.lime,style=plot.style_linebr, title="Long Take Profit %")
TPLX = LONG and crossunder(source, TppricePerc)

TP1=input(title="1 Long Take Profit On?",type=input.bool,defval=true)

useStructure1=input(title="Look back for High/Lows?",type=input.bool,defval=true)
STplookback=input(title="How far to look back for High/Lows for 1 TP",type=input.integer,defval=12,minval=1)
STpatrLenghth=input(title="Long ATR Lenghth 1 TP",type=input.integer,defval=24,minval=1)
SatrProfitMultiplier = input(title="First Long ATR Take Profit x ?", type=input.float,defval=5.5, minval=0.1,step=0.1)
STpatr = atr(STpatrLenghth)
LongTakeProfit = (useStructure1 ? highest(high, STplookback) : source) + STpatr * SatrProfitMultiplier
LongTP = TP1 ? crossover(source, LongTakeProfit): false
plot(series = uptrend ? LongTakeProfit: na , color=color.green, style=plot.style_linebr, title="Long Trailing Take Profit", transp=0)


// Bar color
barcolor(cross(macd, signal) ? (macd - signal > 0 ? (uptrend and macd < 0 and signal < 0 ? color.yellow : na) : (downtrend and macd > 0 and signal > 0 ? color.blue : na)) : na)

// Strategy ATR

GOLONG = LongBuy and SSLatr and FLAT

if GOLONG and TP1
    strategy.entry(id="Entry LONG 1TP", long=true,comment="Entry Long")
    strategy.exit("Long Profit or Loss 1TP","Entry LONG 1TP", limit=LongTakeProfit, stop=LongStop)
if SSLX
    strategy.close(id="Entry LONG 1TP", comment="% Long SL EXIT")
if TPLX
    strategy.close(id="Entry LONG 1TP", comment="% Long TP EXIT")

if SSLOP and SSL2
    strategy.close(id="Entry LONG 1TP", comment="MTF EMA cross EXIT")

if (not time_cond)
    strategy.close_all()
    strategy.cancel_all()


//plot(strategy.equity, title="equity", color=red, linewidth=2, style=areabr)

//@version=4Published by ChaoZhang on the FMZ strategy square · last modified 2024-01-03. Collected in the Quant Trading Vault. Unvalidated research: re-test with your own data and costs before trusting it.
Build this with AgenKit
A spec is not a trading system. Paste this into your coding agent and AgenKit runs a specialist team — architecture, test-first build, risk gates, review — with paper trading on by default.
/agenkit build a production-grade trading bot with a backtest engine, risk controls and paper trading by default from strategies/Long-and-Short-Opening-Strategy-Based-on-Multi-Timeframe-Moving-Average-and-MACD.md- npx agenkit install engineering-kit in your project
- Paste the command into your agent and approve each phase
- Get tests, backtest, risk controls and a paper-trading switch
Understand it first
Before you run this, read the lesson behind the idea and how to backtest it honestly. Specs like this one are the survivors of an unknown number of trials; deflate their results accordingly.
Related specs
- EMA RSI and MACD Based Multi Timeframe Trading StrategyPine Script · Multi-timeframe · 1h
- Multi timeframe RSI and Moving Average Trading StrategyPine Script · Multi-timeframe · 1h
- Multi Timeframe Adaptive Market Regime Quantitative Trading StrategyPine Script · Multi-timeframe · 1m
- Multi Timeframe MACD StochRSI Combo StrategyPine Script · Multi-timeframe · 1h
- Multi Timeframe MACD Trading StrategyPine Script · Multi-timeframe · 1h
- Multi timeframe Quantitative Trading Strategy Based on PSAR MACD and RSIPine Script · Multi-timeframe · 1d