Lu Shen Simple Volatility Strategy
Complete T-Shen public account, Lv Shen's special strategic translation. The following is reprinted content, Please pay more attention to "Qianqian's Quantitative World" to obtain more strategy source codes!! Also…
Complete T-Shen public account, Lv Shen's special strategic translation. The following is reprinted content, Please pay more attention to "Qianqian's Quantitative World" to obtain more strategy source codes!! Also give yourself an ad~ Official account "Flat Bean's Quantitative Journal"" Publicly execute online quantitative bankruptcies daily for everyone~ There are many more benefits for you to get~
This is just Demo!! Demo!! DemoAwei!! Dads!! Be careful with real offers!!
Make good use of volatility and outperform the BTC market is that simple! Original by Lu Yangyang Qianqian's Quantitative World 3 days ago " The research and development of quantitative strategies actually has two sides. It is very difficult for those who are just getting started. It is not only the code at the "technical" level, but also the strategic and logical thinking at the "strategic" level. Both are important and must not be biased."
Hello to all the Qianqian quantification enthusiasts!!!
This article is the second issue of special invitations. Qianqian is honored to invite Master Lu Yangyang (WeChat ID LE_CHIFFRE1) to introduce to you: how to use the volatility factor to easily outperform the BTC market and achieve "dimensionality reduction strike""!
Lu Shen comes from a traditional quantitative investment institution. He has also been deeply involved in the currency exchange business and has rich experience and unique insights in the quantitative field. The content of this issue of Lu Shen covers inspiration, coding implementation, personal insights, etc. It is full of useful information. Qianqian herself felt that she benefited a lot from reading it. She really admires and thanks Lu Shen. I strongly recommend everyone to read it carefully.!
Let's welcome Lu Shen to introduce the volatility strategy to everyone.
01
Introduction
Hello everyone, today I am honored to post an article on the "Qianqian's Quantification" public account, and I would also like to thank Boss T (one of Qianqian's nicknames) for the invitation. This is my first time writing an article for Boss T. I am completely free to use my spare time after work. Please correct the quality and errors and include them in the article. Thank you all.
TThe boss said to write something quantitative, but he didn't give any scope. I really don't know where to start. Then start with the topics you most enjoy discussing with others. Quantitative indicators and strategies (which can be assisted or automated). Of course, in the end we have to add a cliché: "Investment is risky, so you need to be cautious when entering the market." Strategies only provide ideas and reference for everyone, and you are responsible for your profits and losses. All profits and losses from using this strategy have nothing to do with myself and the main body of the "Qianqian Quantitative World" public account.
Disclaimer finished, now let's start the main topic.
02
A simple volatility strategy
People who are familiar with me actually know that personally, I don't like Alpha's gameplay very much. Relatively speaking, I believe in Beta more and study Beta more. As for why, e.........mmmmm, I don't know how to answer~~, please make up your own mind. If you are interested, you can send a private message or leave a message to the author of the public account. If the logic is clear and distinctive, the author himself will send you a small red envelope.
The research and development of quantitative strategies actually has two sides. It is very difficult for those who are just getting started. It is not only the code at the "technical" level, but also the strategic and logical thinking at the "strategic" level. Both are important and must not be taken in either direction. The strategy I will introduce to you today is actually inspired by a research report from Huatai many years ago. Please read it carefully and it is just an inspiration. The reason why I say this is because the logic of this strategy is completely different from what was mentioned in the research report. Let's talk privately with Mr. T about the specific research report.
This strategy algorithm adopts the rolling yield fluctuation principle of the logarithmic price rise and fall in a certain period, and calculates the rolling highest value and the minimum value in a certain period based on the fluctuation interval. The highest value is used as the upper channel, and the minimum value is used as the lower channel. Break through the upper channel and open a position. The rolling average of the upper and lower pipelines is used as the closing line. (Knock on the blackboard here!)
For the specific graphic visualization interface, please refer to the PPT below. This graphic was drawn by me using Pyecharts. Please contact Mr. T privately for the specific code.
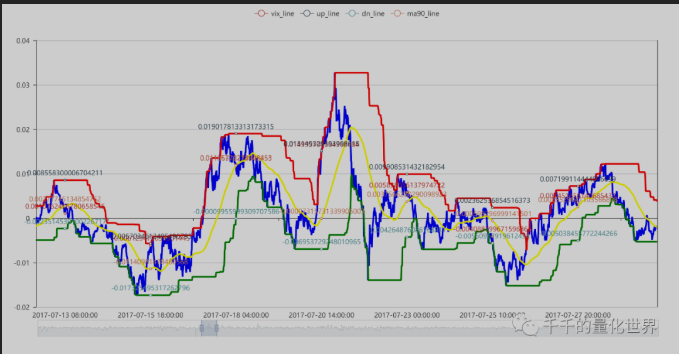
Actually, this strategy was the one I used before for broad-based ETFs, and of course it was also used for stock trading with index timing. Later, I directly applied it to the cryptocurrency world and was astonished to find that it really was a dimensionality reduction strike, and the parameters didn't need to be changed.
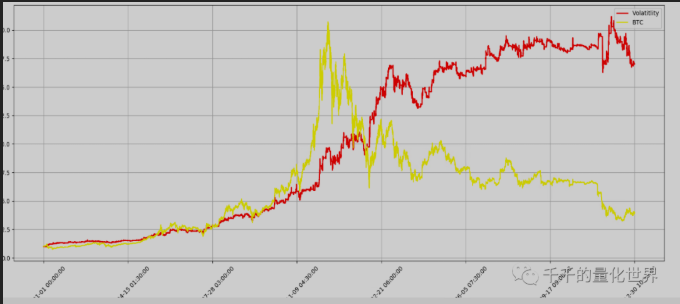
The figure below shows the performance of the backtesting for the year. Screenshots of some of the code logic are as follows:
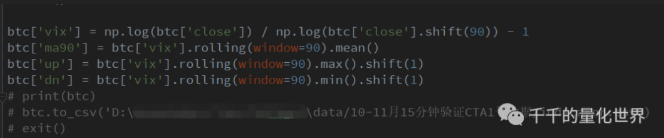
The above is actually to calculate the indicator data through pandas after reading the data.
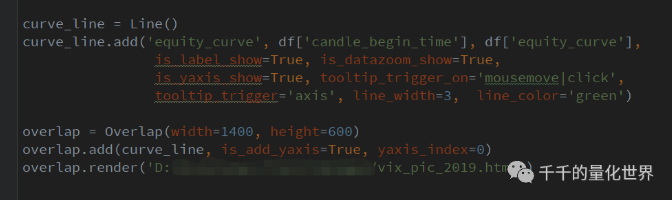
After calculation, you can usepd.to_csv()The function outputs data and is used in the screenshot abovepyechartsPerform visual output (Note: I use the old versionpyecharts).
For all the specific strategies, visualizations, and performance indicator code, I still messaged Mr. T privately.
03
Casual Talk on Quant
Next I will mainly talk about two points. First: Some people have a lot of questions or say why you people can publish real strategies. Are you fake liars? Or is it really about saving all sentient beings? Haha~~. First of all, a good strategy is not afraid of disclosure. This is not a weapon development for war-level confrontation, which will determine life or death. Therefore, I and other organizations or individuals are not afraid of so-called strategic secrets, because in my opinion, CTA has no secrets. It's just ideas that everyone thinks of and doesn't think of. Secondly, this version is my oldest version. On this basis, I have made several upgrades, such as adding other conditional judgments, take-profit and stop-loss, etc., and of course it also includes parameter adjustments for other types of cycles, etc.
Secondly: Many people, whether beginners, those who have just started, or even experienced players, need sources of inspiration, including factor discovery in stocks, ideas for timing strategies, and so on. These often come from subjective experience, research reports, communication within the community, etc. It does not exclude the possibility of buying some strategies available in the market and then reading and understanding them, and modifying them according to one's own risk tolerance and specific needs.
Finally, to summarize, quantification is originally an imported product, and programmed trading is a subset of quantification. As early as when I was in college (around 2009), some people had been involved in programmed methods such as TB and Pyramid. If we continue to do it today, it can be said that these people who were the first to foresee and foresight have been there for 10 years, and this does not include those who "brought back" high-frequency strategies and systems from Wall Street. Therefore, quantitative strategies or programmatic strategies have been going on in China for some time, but in terms of current market share, participants, and policy support, quantification is still a very small part of the market, even though research reports on multi-factor analysis and strategy modeling are flying everywhere. Some people like to use brainless logic to compare this with the United States, believing that China's quantitative future development trends will be the same as those of the United States, with explosive growth and so on. However, this is not Ruixing's "coffee and small pot of tea" business logic. China has Chinese characteristics, and the road ahead is still thorny and bumpy. Therefore, we have also gathered a large circle of institutional and individual investors. We hope that everyone can get to know each other, communicate and grow together, and make a small contribution to this industry.
Finally, I would like to thank the 'Qianqian's Quantification' public account for trusting my professional expertise and inviting me to contribute articles. If anyone has specific questions about code or strategies, please private message me or Master T. I am also in Master T's group.
Finally, thanks again to Lü Shen for his wonderful explanation!
If you haven't joined the quantitative discussion group yet, come join us quickly to get your study materials!!!
Qianqian Honorable Guardian!

Scan on WeChat Follow This Public Account
Parameters
| Name | Default | What it controls |
|---|---|---|
| N | 90 | Index Calculation Period |
| Amount | 100 | Order Quantity |
Source JavaScript
/*backtest
start: 2019-04-18 00:00:00
end: 2020-04-17 23:59:00
period: 15m
exchanges: [{"eid":"Futures_BitMEX","currency":"XBT_USD"}]
*/

// Buddies!! Please pay attention before live trading!! This content is only translated by Lü Shendemo, Please add relevant content when trading live.
// Yes/IsDemo!!! Be Cautious in Live Trading!!!

// Initialize
exchange.SetContractType('XBTUSD')
var vix_arr = []
var vix_ma = []
var vix_ma_up = []
var vix_ma_dw = []
var LastBarTime = 0
var isFirst = true

function initVix() {
    records = _C(exchange.GetRecords)
    Log(records.length)
    if (records && records.length > 2 * N + 2) {
        // Before initializationNIndividual/Unitvixvalue
        for (var i = -2; i < N - 1; i++) {
            Bar = records[records.length - N + i]
            lastNbar = records[records.length - N + i - N]
            Vix()
        }
    }
    // Log("vix_arr", vix_arr.length, vix_arr)
    // Log("vix_ma", vix_ma.length, vix_ma)
    // Log("vix_ma_up", vix_ma_up.length, vix_ma_up)
    // Log("vix_ma_dw", vix_ma_dw.length, vix_ma_dw)
}

// Get exchange information
function UpdateInfo() {
    account = _C(exchange.GetAccount)
    pos = _C(exchange.GetPosition)
    records = _C(exchange.GetRecords)
    Bar = records[records.length - 1]
    lastNbar = records[records.length - N]
    ticker = _C(exchange.GetTicker)
}

// Calculate volatility and upper/lower bands
function Vix() {
    // When everyKCalculated at the end
    if (LastBarTime !== Bar.Time) {
        // whenKStart calculation when the number of calculation roots is reachedvix_arr
        if (records && records.length > N) {
            // Obtainvix CurrentcloseNatural logarithm divided by previous90Natural Logarithm Minus One
            vix = Math.log(Bar.Close) / Math.log(lastNbar.Close) - 1
            vix_arr.push(vix)
            //Log("vix_arr", vix_arr)
        }
        // whenvix_arrStart calculation when the number of calculation roots is reachedvix_ma
        if (vix_arr && vix_arr.length > N) {
            // Get the corresponding periodvixCalculate its moving average
            vix_ma = TA.MA(vix_arr, N)
            // RemovemaInnullvalue
            vix_ma = vix_ma.filter(function(val) {
                return !(!val || val === "");
            })
            //Log("vix_ma", vix_ma)
            // Get the upper and lower channels
            vix_up = TA.Highest(vix_arr, N)
            vix_dw = TA.Lowest(vix_arr, N)
            vix_ma_up.push(vix_up)
            vix_ma_dw.push(vix_dw)
            // Log("vix_ma_up", vix_ma_up)
            //Log("vix_ma_dw", vix_ma_dw)
            // Limit Length of All Arrays
            if (vix_arr.length > 2000) {
                vix_arr.splice(0, 1);
            }
            if (vix_ma.length > 2000) {
                vix_ma.splice(0, 1);
            }
            if (vix_ma_up.length > 2000) {
                vix_ma_up.splice(0, 1);
            }
            if (vix_ma_dw.length > 2000) {
                vix_ma_dw.splice(0, 1);
            }
        }
        LastBarTime = Bar.Time
    }
}

// Draw lines
function PlotMA_Kline(records, isFirst) {
    //$.PlotRecords(records, "K")
    if (isFirst) {
        for (var i = records.length - 1 - N; i <= records.length - 1; i++) {
            if (vix_ma[i] !== null) {
                $.PlotLine("vix_arr", vix_arr[i], records[i].Time)
                $.PlotLine("vix_ma", vix_ma[i], records[i].Time)
                $.PlotLine("vix_ma_up", vix_ma_up[i], records[i].Time)
                $.PlotLine("vix_ma_dw", vix_ma_dw[i], records[i].Time)
            }
        }
        PreBarTime = records[records.length - 1].Time
    } else {
        if (PreBarTime !== records[records.length - 1].Time) {
            $.PlotLine("vix_arr", vix_arr[vix_arr.length - 2], records[records.length - 2].Time)
            $.PlotLine("vix_ma", vix_ma[vix_ma.length - 2], records[records.length - 2].Time)
            $.PlotLine("vix_ma_up", vix_ma_up[vix_ma_up.length - 2], records[records.length - 2].Time)
            $.PlotLine("vix_ma_dw", vix_ma_dw[vix_ma_dw.length - 2], records[records.length - 2].Time)
            PreBarTime = records[records.length - 1].Time
        }
        $.PlotLine("vix_arr", vix_arr[vix_arr.length - 1], records[records.length - 1].Time)
        $.PlotLine("vix_ma", vix_ma[vix_ma.length - 1], records[records.length - 1].Time)
        $.PlotLine("vix_ma_up", vix_ma_up[vix_ma_up.length - 1], records[records.length - 1].Time)
        $.PlotLine("vix_ma_dw", vix_ma_dw[vix_ma_dw.length - 1], records[records.length - 1].Time)
    }
}

// Transaction logic
function onTick() {
    // When no position
    if (pos.length == 0) {
        // Long CurrentKThe closing price of the line > Upper rail && BeforeKThe closing price of the line <= Upper rail
        if (vix_arr[vix_arr.length - 1] > vix_ma_up[vix_ma_up.length - 1] &&
            vix_arr[vix_arr.length - 2] <= vix_ma_up[vix_ma_up.length - 2]) {
            exchange.SetDirection("buy")
            exchange.Buy(ticker.Sell, Amount)
            $.PlotFlag(new Date().getTime(), 'Buy', 'BK')
        }
        // Short CurrentKThe closing price of the line < Lower Band && BeforeKThe closing price of the line >= Lower Band
        if (vix_arr[vix_arr.length - 1] < vix_ma_dw[vix_ma_dw.length - 1] &&
            vix_arr[vix_arr.length - 2] >= vix_ma_dw[vix_ma_dw.length - 2]) {
            exchange.SetDirection("sell")
            exchange.Sell(ticker.Buy, Amount)
            $.PlotFlag(new Date().getTime(), 'Sell', 'SK')
        }
    }
    // When Long
    if (pos.length > 0 && pos[0].Type == 0) {
        // Pinduo CurrentKThe closing price of the line < Middle track && BeforeKThe closing price of the line >= Middle track
        if (vix_arr[vix_arr.length - 1] < vix_ma[vix_ma.length - 1] &&
            vix_arr[vix_arr.length - 2] >= vix_ma[vix_ma.length - 2]) {
            exchange.SetDirection("closebuy")
            exchange.Sell(ticker.Buy, pos[0].Amount)
            $.PlotFlag(new Date().getTime(), 'Sell', 'SBK')
        }
    }
    // When Short
    if (pos.length > 0 && pos[0].Type == 1) {
        // Flat currentKThe closing price of the line > Middle track && BeforeKThe closing price of the line <= Middle track
        if (vix_arr[vix_arr.length - 1] > vix_ma[vix_ma.length - 1] &&
            vix_arr[vix_arr.length - 2] <= vix_ma[vix_ma.length - 2]) {
            exchange.SetDirection("closesell")
            exchange.Buy(ticker.Sell, pos[0].Amount)
            $.PlotFlag(new Date().getTime(), 'Buy', 'PSK')
        }
    }
}

function main() {
    initVix()
    while (1) {
        UpdateInfo()
        Vix()
        onTick()
        if (records) {
            PlotMA_Kline(records, isFirst)
            //Log('Draw lines')
            isFirst = false
        }
        Sleep(5 * 1000)
    }
}Published by 扁豆子 on the FMZ strategy square · last modified 2020-04-23. Collected in the Quant Trading Vault. Unvalidated research: re-test with your own data and costs before trusting it.
Build this with AgenKit
A spec is not a trading system. Paste this into your coding agent and AgenKit runs a specialist team — architecture, test-first build, risk gates, review — with paper trading on by default.
/agenkit build a production-grade trading bot with a backtest engine, risk controls and paper trading by default from strategies/Lu-Shen-Simple-Volatility-Strategy.md- npx agenkit install engineering-kit in your project
- Paste the command into your agent and approve each phase
- Get tests, backtest, risk controls and a paper-trading switch
Understand it first
Before you run this, read the lesson behind the idea and how to backtest it honestly. Specs like this one are the survivors of an unknown number of trials; deflate their results accordingly.
Related specs
- Binance Perpetual Multi Coin Hedging Strategy for Shorting or Longing Altcoin Indexes Bug Fixed on April 10 Requires UpdateJavaScript · Volatility
- Coin Toss StrategyJavaScript · Volatility · 15m
- Collect Price Volatility Moving Average 3 Years 330000 Times ReturnJavaScript · Volatility · 1d
- Dual Bollinger Band Volatility Tracking StrategyPine Script · Volatility · 1d
- Dual EMA Volatility Adaptive Trading Strategy with Multi Tiered Profit Optimization SystemPine Script · Volatility · 1d
- Dual Moving Average Volatility Tracking StrategyPine Script · Volatility · 1h