Strategy vault / Trend following
MACD Crossover Strategy MACD
This strategy uses the crossover of two exponential moving averages (EMAs) with different periods to generate trading signals. When the fast EMA crosses above the slow EMA, it generates a buy signal, and when the…
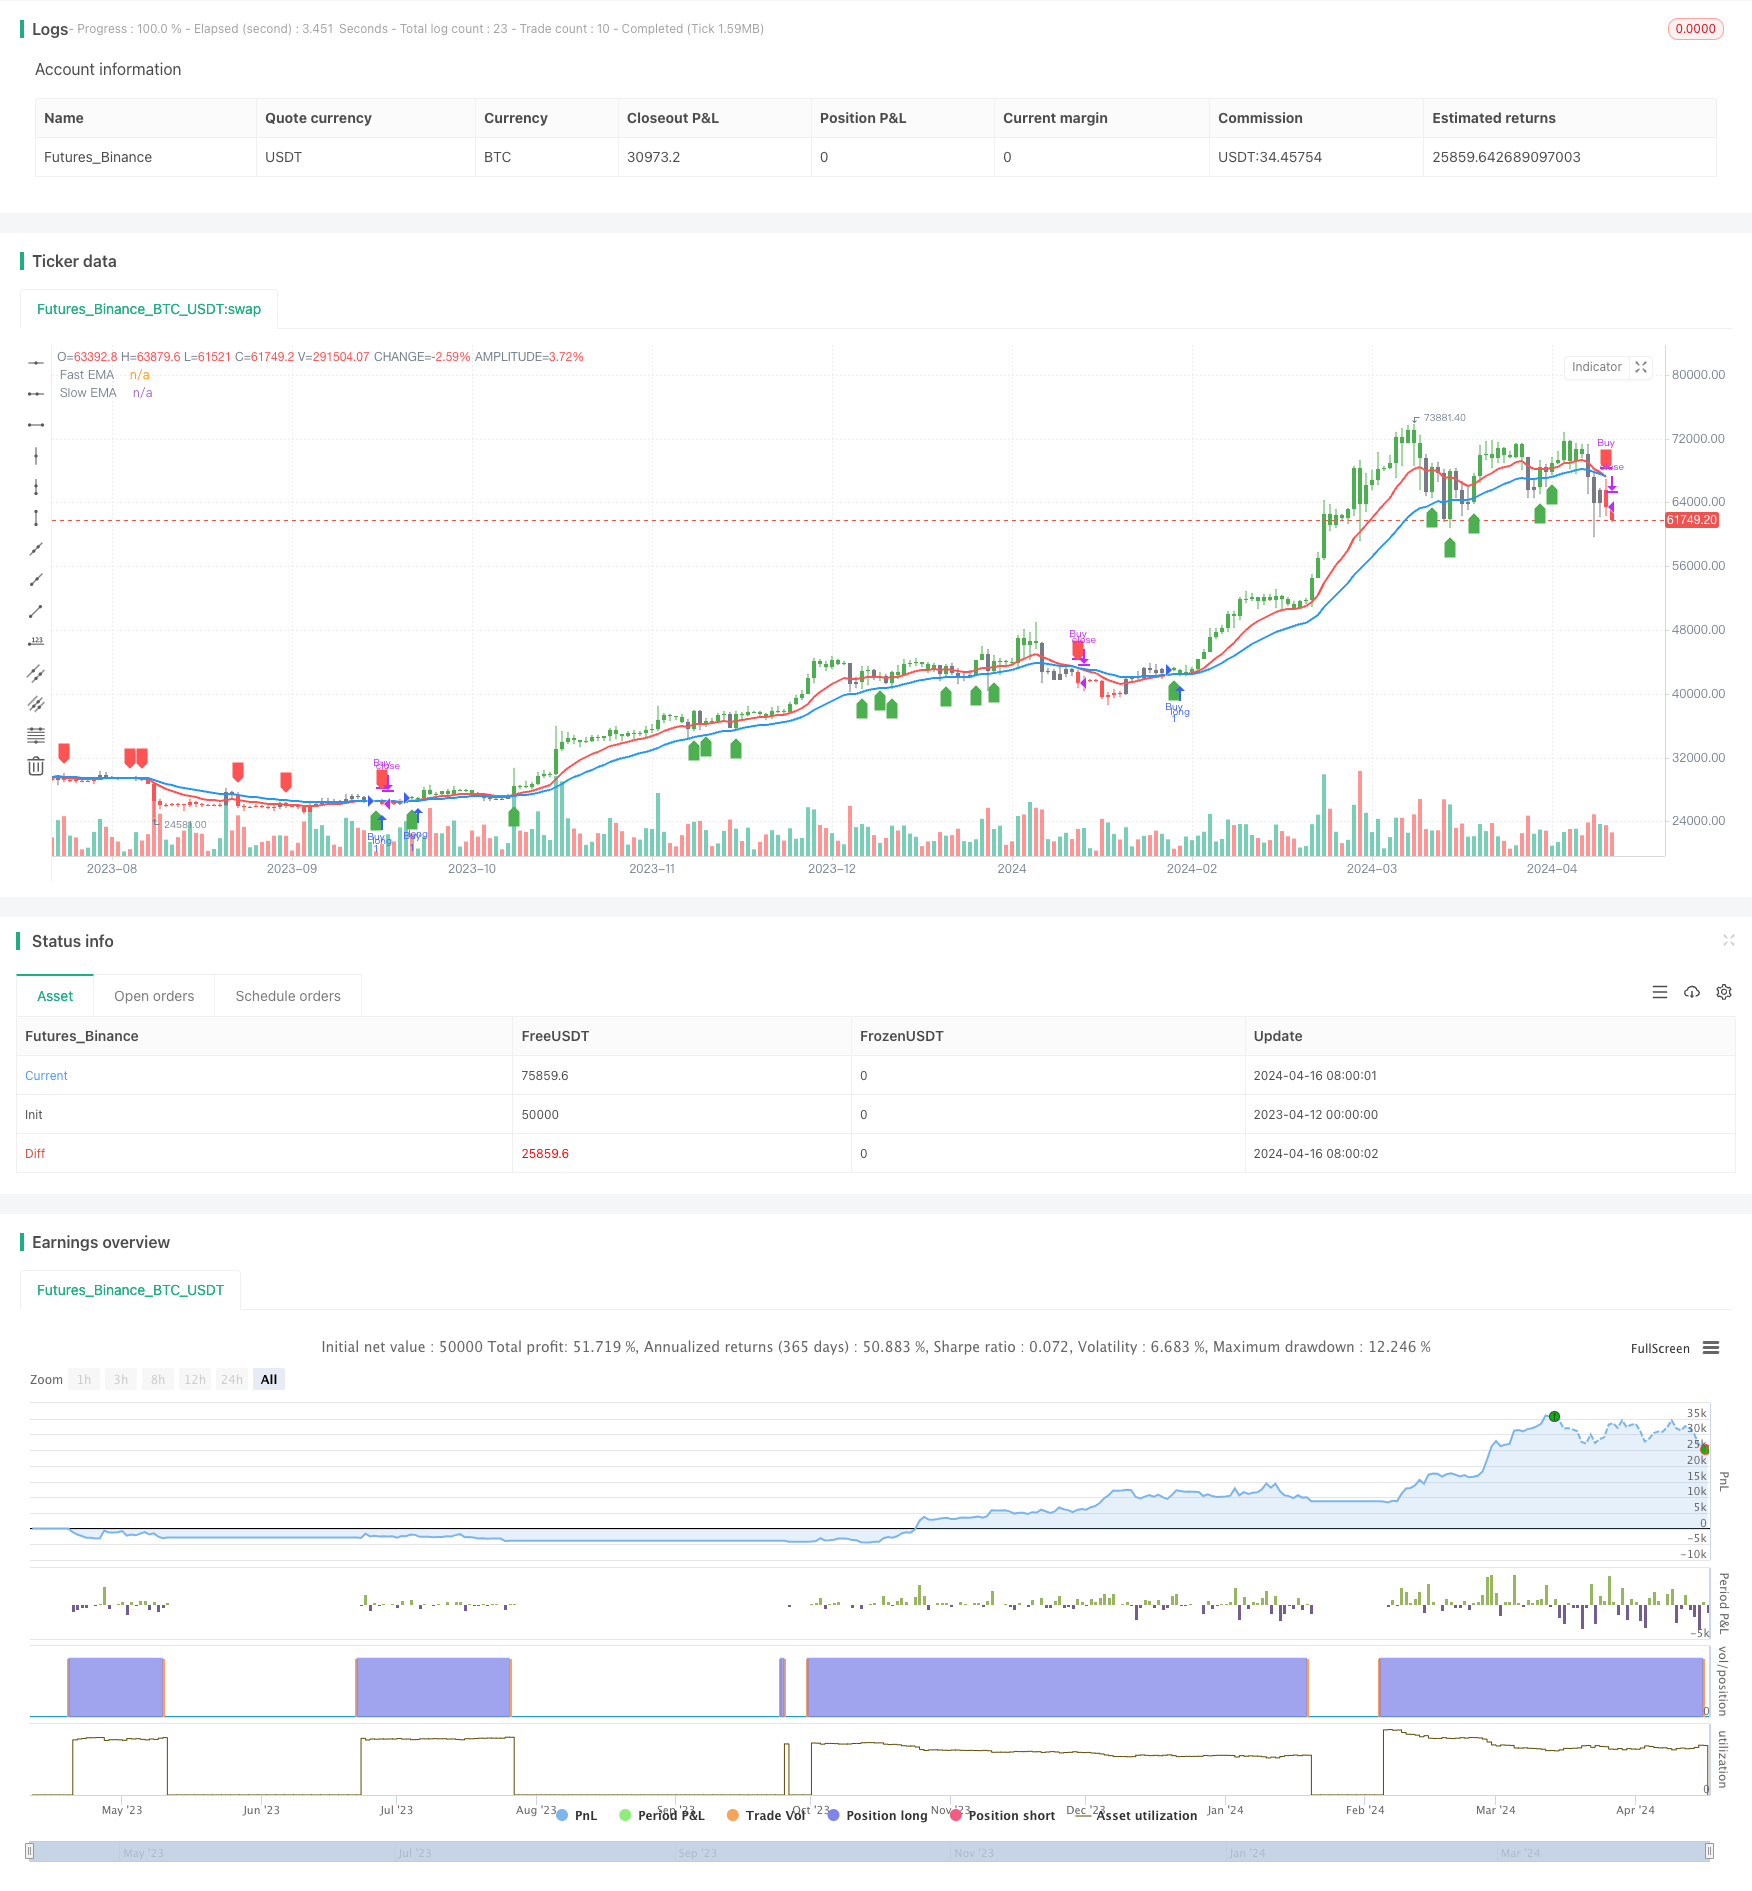
Overview
This strategy uses the crossover of two exponential moving averages (EMAs) with different periods to generate trading signals. When the fast EMA crosses above the slow EMA, it generates a buy signal, and when the fast EMA crosses below the slow EMA, it generates a sell signal. This strategy can be applied to various financial instruments and time frames, such as gold being most effective on the 2-hour time frame and Bitcoin being most effective on the daily chart, etc.
Strategy Principle
- Calculate the fast EMA (default period is 12) and the slow EMA (default period is 26).
- Define the bullish zone (fast EMA above slow EMA and price above fast EMA) and the bearish zone (fast EMA below slow EMA and price below fast EMA).
- Buy when transitioning from the bearish zone to the bullish zone, and sell when transitioning from the bullish zone to the bearish zone.
- Mark the bullish and bearish zones on the chart with green and red colors, and use arrows to mark the buy and sell signals.
Strategy Advantages
- Simple and easy to understand, suitable for beginners to learn.
- Widely applicable, can be used for various financial instruments and time frames.
- Strong trend-following ability, able to capture medium to long-term trends.
- Adjustable parameters, increasing flexibility.
Strategy Risks
- Prone to generating false signals in choppy markets, leading to losses.
- Slow to react at trend reversals, resulting in certain slippage.
- Improper parameter selection will affect the strategy's performance.
Strategy Optimization Directions
- Add trend filters, such as only trading when ADX is above a certain value, to reduce losses in choppy markets.
- Optimize entry and exit timing, such as using ATR to determine stop-loss and take-profit, reducing single trade losses.
- Optimize parameters to find the best combination, improving stability and profitability.
- Combine with other indicators for auxiliary judgment, such as MACD, RSI, etc., to improve signal accuracy.
Summary
The MACD crossover strategy is a simple strategy based on trend following. Its advantages are simplicity, practicality, and wide applicability, while its disadvantages are difficulty in grasping trend reversals and parameter selection. Through trend filtering, optimizing entry and exit points, parameter optimization, and combining other indicators, the performance of this strategy can be improved, which is worth further research and testing.
Parameters
| Name | Default | What it controls |
|---|---|---|
| v_input_1_close | 0 | Source Data: close | high | low | open | hl2 | hlc3 | hlcc4 | ohlc4 |
| v_input_2 | 12 | Fast EMA period |
| v_input_3 | 26 | Slow EMA period |
| v_input_4 | true | Smoothing period (1 = no smoothing) |
| v_input_5 | true | Paint Bar Colors |
| v_input_6 | true | Show fast moving average line |
| v_input_7 | true | Show slow moving average line |
| v_input_8 | true | Plot Buy/Sell Signals? |
Source Pine Script
/*backtest
start: 2023-04-12 00:00:00
end: 2024-04-17 00:00:00
period: 1d
basePeriod: 1h
exchanges: [{"eid":"Futures_Binance","currency":"BTC_USDT"}]
*/

//@version=5
strategy('Advance EMA Crossover Strategy', overlay=true, precision=6)
//****************************************************************************//
// CDC Action Zone is based on a simple EMA crossover
// between [default] EMA12 and EMA26
// The zones are defined by the relative position of
// price in relation to the two EMA lines
// Different zones can be use to activate / deactivate
// other trading strategies
// The strategy can also be used on its own with
// acceptable results, buy on the first green candle
// and sell on the first red candle
//****************************************************************************//
// Define User Input Variables

xsrc = input(title='Source Data', defval=close)
xprd1 = input(title='Fast EMA period', defval=12)
xprd2 = input(title='Slow EMA period', defval=26)
xsmooth = input(title='Smoothing period (1 = no smoothing)', defval=1)
fillSW = input(title='Paint Bar Colors', defval=true)
fastSW = input(title='Show fast moving average line', defval=true)
slowSW = input(title='Show slow moving average line', defval=true)
plotSigsw = input(title='Plot Buy/Sell Signals?', defval=true)

//****************************************************************************//
//Calculate Indicators

xPrice = ta.ema(xsrc, xsmooth)

FastMA = ta.ema(xPrice, xprd1)
SlowMA = ta.ema(xPrice, xprd2)

//****************************************************************************//
// Define Color Zones and Conditions

BullZone = FastMA > SlowMA and xPrice > FastMA  // Bullish Zone
BearZone = FastMA < SlowMA and xPrice < FastMA  // Bearish Zone

//****************************************************************************//
// Strategy Entry and Exit Conditions

if (BullZone and not BullZone[1])
    strategy.entry("Buy", strategy.long)  // Buy on the transition into BullZone

if (BearZone and not BearZone[1])
    strategy.close("Buy")  // Sell on the transition into BearZone

//****************************************************************************//
// Display color on chart

plotcolor = BullZone ? color.green : BearZone ? color.red : color.gray
barcolor(color=fillSW ? plotcolor : na)

//****************************************************************************//
// Plot Fast and Slow Moving Averages

plot(fastSW ? FastMA : na, color=color.red, title="Fast EMA", linewidth=2)
plot(slowSW ? SlowMA : na, color=color.blue, title="Slow EMA", linewidth=2)

//****************************************************************************//
// Plot Buy and Sell Signals

plotshape(series=plotSigsw and BullZone and not BullZone[1], location=location.belowbar, color=color.green, style=shape.labelup, title="Buy Signal")
plotshape(series=plotSigsw and BearZone and not BearZone[1], location=location.abovebar, color=color.red, style=shape.labeldown, title="Sell Signal")

//****************************************************************************//
Published by ChaoZhang on the FMZ strategy square · last modified 2024-04-18. Collected in the Quant Trading Vault. Unvalidated research: re-test with your own data and costs before trusting it.
Build this with AgenKit
A spec is not a trading system. Paste this into your coding agent and AgenKit runs a specialist team — architecture, test-first build, risk gates, review — with paper trading on by default.
/agenkit build a production-grade trading bot with a backtest engine, risk controls and paper trading by default from strategies/MACD-Crossover-Strategy-MACD.md- npx agenkit install engineering-kit in your project
- Paste the command into your agent and approve each phase
- Get tests, backtest, risk controls and a paper-trading switch
Understand it first
Before you run this, read the lesson behind the idea and how to backtest it honestly. Specs like this one are the survivors of an unknown number of trials; deflate their results accordingly.
Related specs
- Dynamic Trend Identification Strategy with Exponential Moving Average and Adaptive Volatility ThresholdPine Script · Trend following · 1h
- Multi Indicator Crossover Dynamic Stop Loss Trend Following StrategyPine Script · Trend following · 1d
- Dual Trend Strategy with EMA Crossover and RSI FilterPine Script · Trend following · 1d
- Multi Timeframe Volume and Trend Confluence Trading StrategyPine Script · Trend following · 1d
- Multi timeframe Trend Tracking Strategy Based on Impulse MACD and Dual Moving Average CrossoverPine Script · Trend following · 1d
- Gaussian Cross EMA Trend Retracement StrategyPine Script · Trend following · 1d