MACD Golden Cross Breakout with 200 Day Moving Average Trend Following Strategy
This strategy combines the MACD indicator to identify short-term trends and the 200-day moving average to determine long-term trends. When the MACD golden cross occurs and runs at a low level, if the price breaks…
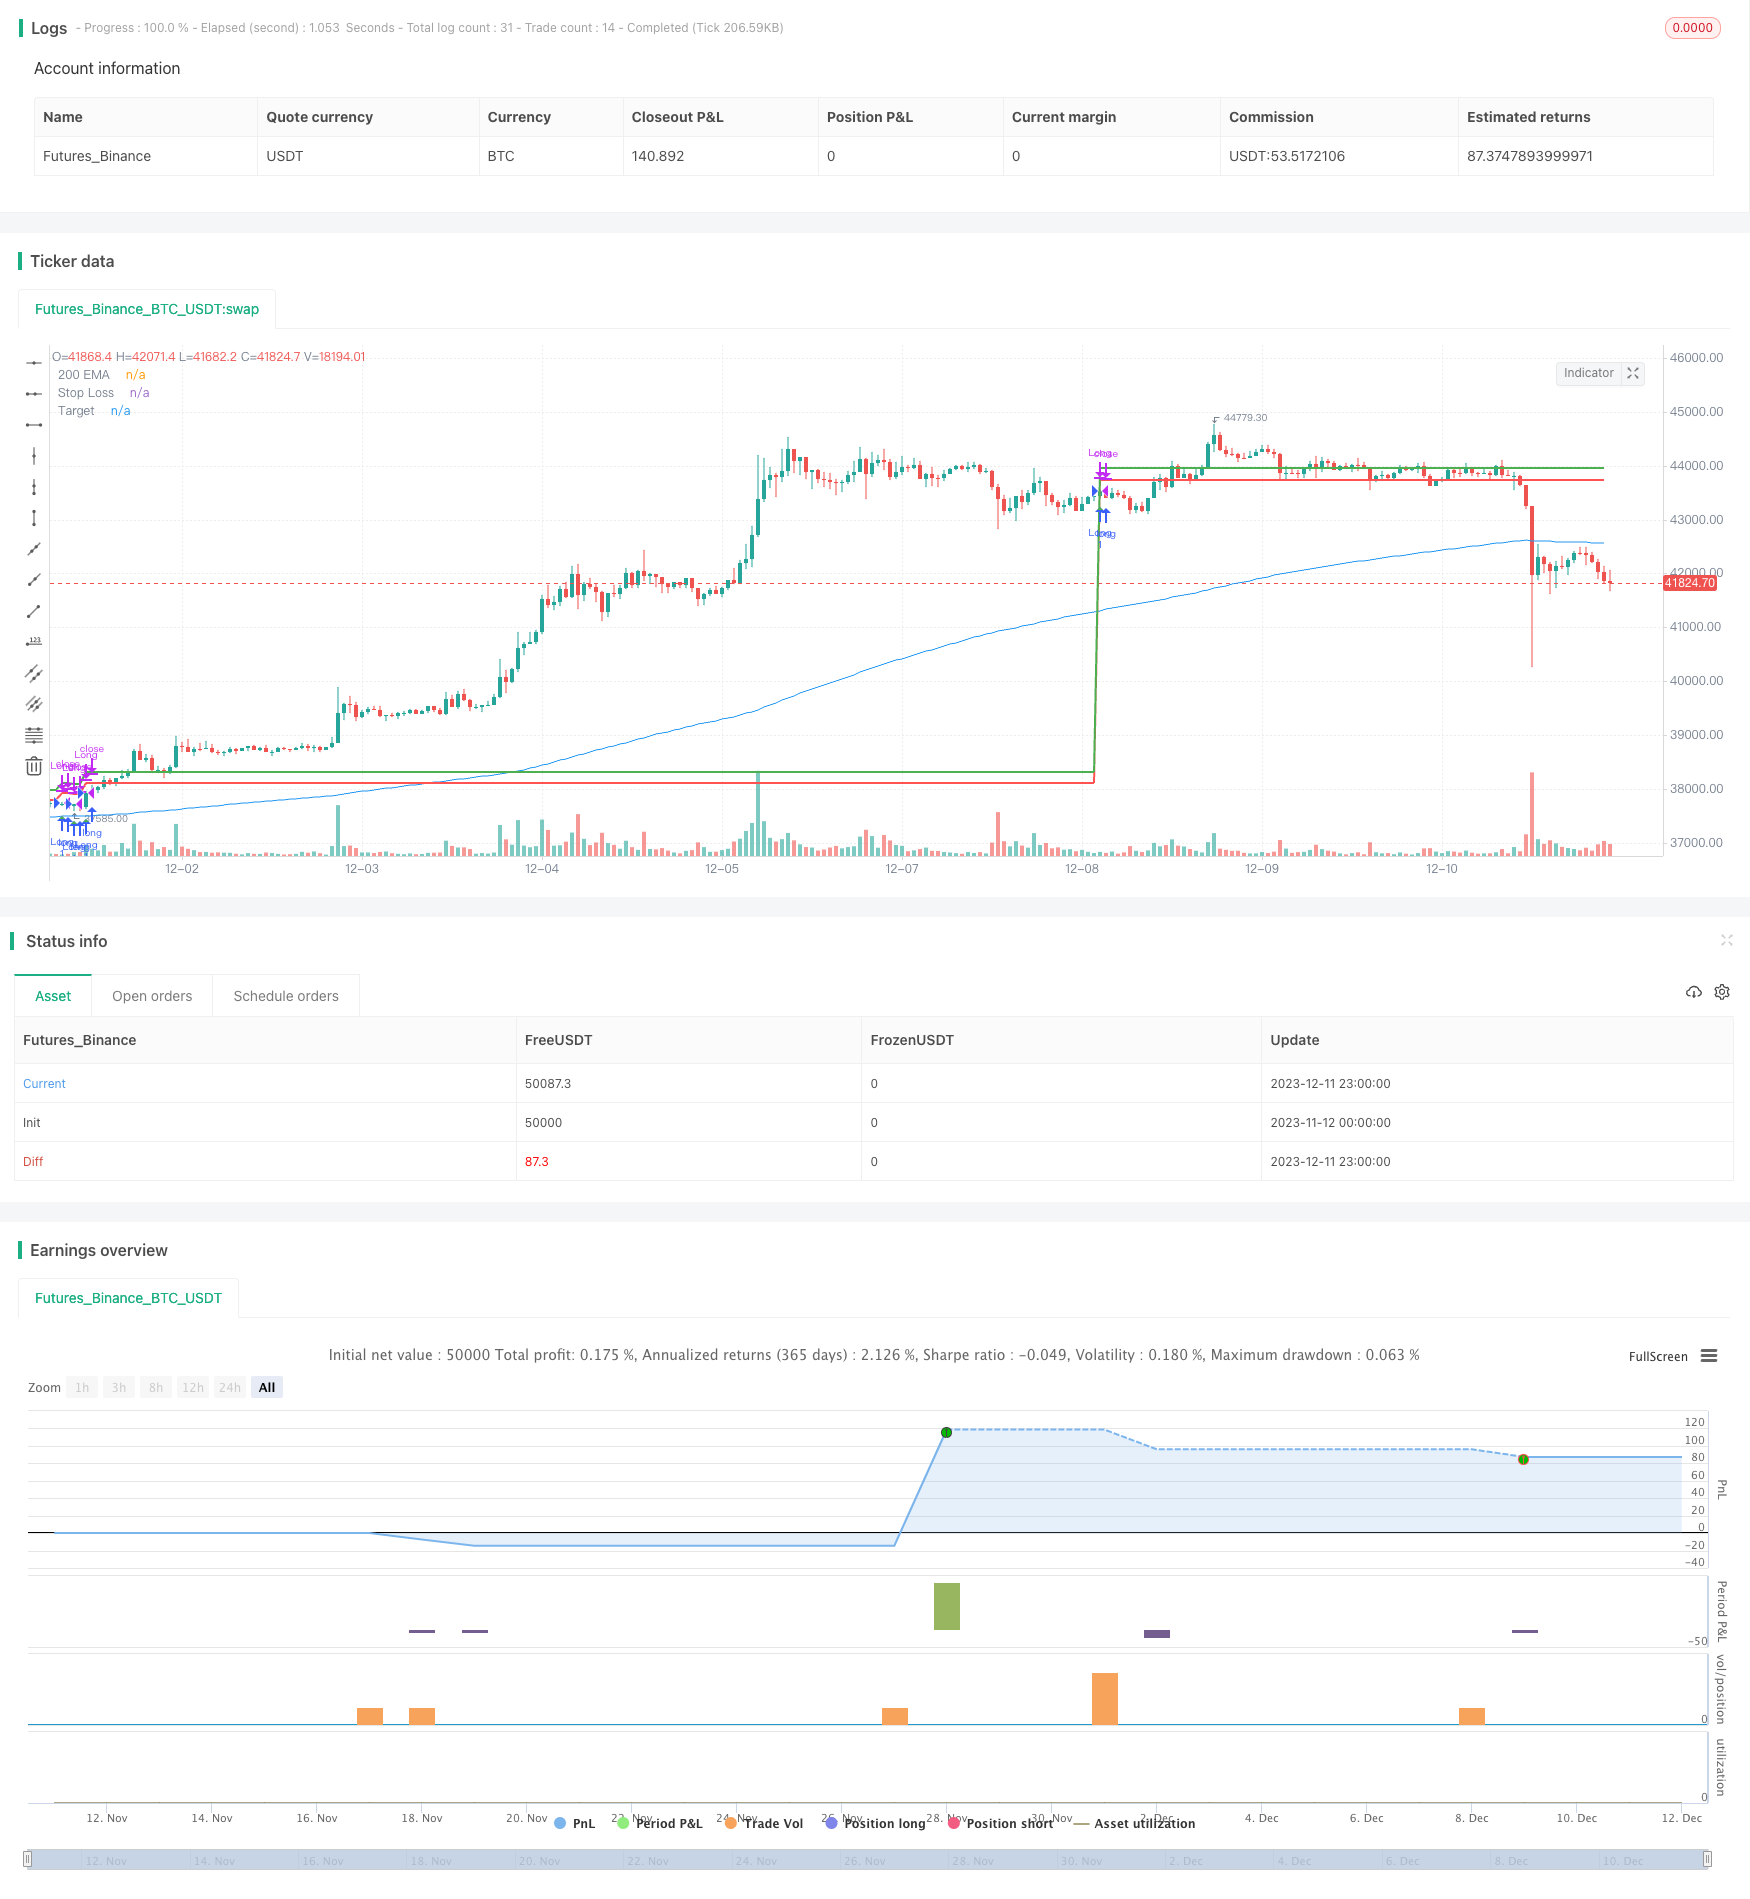
Overview
This strategy combines the MACD indicator to identify short-term trends and the 200-day moving average to determine long-term trends. When the MACD golden cross occurs and runs at a low level, if the price breaks through the 200-day moving average, a long position is established with a trailing stop loss. This strategy mainly utilizes the relationship between the MACD indicator's golden cross and death cross and the 200-day moving average to identify potential opportunities.
Strategy Logic
The strategy is mainly based on the MACD indicator and 200-day moving average for judgement, the specific logic is:
Calculate the fast line, slow line and MACD line of the MACD indicator. The fast line parameter is 12 days, the slow line parameter is 26 days, and the signal line parameter is 9 days.
Calculate the 200-day Exponential Moving Average (EMA).
When the MACD fast line crosses over the slow line (golden cross), the MACD line is negative (running at a low level), and the close price is above the 200-day line, go long.
After entering the position, set the stop loss price to 0.5% of the entry price, and the target price to 1% of the entry price.
If the price touches the stop loss or target price, exit the position with a stop loss or take profit.
Mandatory flatten before the daily close at 15:15.
The trading hours are set between 9:00 and 15:15 every day.
By judging the short-term trend direction and momentum with the MACD indicator and determining the long-term trend direction with the 200-day moving average, the trend following operation can be realized. The stop loss is set smaller and the target price is larger to maximize profits. The mandatory daily exit can control the overnight risk.
Advantages of the Strategy
The strategy has the following advantages:
Combining multiple indicators makes signal judgement more accurate. MACD judges short-term trends and momentum, while the 200-day MA judges the main trend direction.
Small stop loss range can withstand certain drawdowns. The stop loss is only 0.5%, which is conducive to tracking mid-term trends.
Higher profit target allows more profit room. The target is 1% of the entry price, meeting the profit maximization of trend strategies.
Mandatory daily unwind helps avoid overnight risk of huge price swings. This controls the overall risk.
The strategy logic is simple and clear, easy to understand and replicate, suitable for beginners to learn.
Risks of the Strategy
The strategy also has some risks:
Exhaustion risk. Prices may reverse downwards after a sharp rise, unable to stop loss in time and cause huge losses. A trailer stop loss can be used to adjust the stop loss price in real time.
Trend determination failure risk. MACD and moving average may give wrong signals, resulting in losses in non-trending markets. Consider combining trading volume indicators for filtering, to ensure entering only during trend acceleration stages.
Overnight fluctuation risks still exist despite the daily unwind mechanism. This requires traders to withstand a certain degree of risk while controlling overall position sizing.
Optimization Directions
The strategy can also be optimized in the following aspects:
Combine trading volume indicators to determine real trends, avoid wrongly entering during choppy consolidations. For example, set entry rules so that volume must be 10% greater than previous period.
Set dynamic stop loss mechanisms. Continuously adjust stop loss price after entry based on price movement, to trail more profits.
Optimize MACD parameter combinations and test effectiveness across different markets. Parameters affect signal sensitivity.
Test other moving averages, like 100-day and 150-day lines, to see which fits better with trends.
Add re-entry mechanisms. Daily forced exits may miss subsequent trends, so re-entry signals can allow position holding the next day.
Conclusion
In summary, this strategy integrates the MACD and 200-day MA for signal judgement. It enters trends conditionally when short-term indicators give sustained signals, with stop loss and take profit mechanisms. Mandatory daily unwind also controls overnight risks. The logic is simple for beginners to operate and integrate into other strategies. But there are also trend determination failure risks and exhaustion risks. Next steps could optimize aspects like stop loss methods, parameters, trade volume filters etc to improve the overall profit factor.
Parameters
| Name | Default | What it controls |
|---|---|---|
| v_input_1 | 12 | Fast Length |
| v_input_2 | 26 | Slow Length |
| v_input_3 | 9 | Signal Length |
| v_input_4 | 200 | 200 EMA Length |
| v_input_5 | 0.5 | Stop Loss Percentage |
| v_input_6 | true | Target Percentage |
| v_input_7 | 9 | Start Hour |
| v_input_8 | false | Start Minute |
| v_input_9 | 15 | End Hour |
| v_input_10 | 15 | End Minute |
Source Pine Script
/*backtest
start: 2023-11-12 00:00:00
end: 2023-12-12 00:00:00
period: 1h
basePeriod: 15m
exchanges: [{"eid":"Futures_Binance","currency":"BTC_USDT"}]
*/

//@version=4
strategy("MACD and 200 EMA Long Strategy", shorttitle="MACD200EMALong", overlay=true)

// Input parameters
fastLength = input(12, title="Fast Length")
slowLength = input(26, title="Slow Length")
signalLength = input(9, title="Signal Length")
ema200Length = input(200, title="200 EMA Length")
stopLossPercentage = input(0.5, title="Stop Loss Percentage")
targetPercentage = input(1, title="Target Percentage")

// Trading session
startHour = input(09, title="Start Hour", minval=0, maxval=23)
startMinute = input(00, title="Start Minute", minval=0, maxval=59)
endHour = input(15, title="End Hour", minval=0, maxval=23)
endMinute = input(15, title="End Minute", minval=0, maxval=59)

// Calculate MACD
[macdLine, signalLine, _] = macd(close, fastLength, slowLength, signalLength)

// Calculate 200-period EMA
ema200 = ema(close, ema200Length)

// Conditions for entering a long position
longCondition = crossover(macdLine, signalLine) and macdLine < 0 and close > ema200 and hour < 13

// Calculate stop loss and target levels only once at the entry
var float stopLossLevel = na
var float targetLevel = na

if (longCondition)
    stopLossLevel := close * (1 + stopLossPercentage / 100)


    targetLevel := close * (1 + targetPercentage / 100)

// Trading session condition
intradayCondition = true

// Strategy logic
strategy.entry("Long", strategy.long, when=longCondition and intradayCondition)
strategy.exit("Take Profit/Stop Loss", from_entry="Long", loss=stopLossLevel, profit=targetLevel)

// Force exit if the current close is below the stop loss level
if (not na(stopLossLevel) and close < stopLossLevel)
    strategy.close("Long")

// Exit the trade if the current close is greater than or equal to the target level
if (not na(targetLevel) and close >= targetLevel)
    strategy.close("Long")

// Manually force exit at 3:15 PM
if (hour == 15 and minute == 15)
    strategy.close("Long")

// Plotting the EMA, target, and stop loss on the chart
plot(ema200, color=color.blue, title="200 EMA")
plot(stopLossLevel, color=color.red, title="Stop Loss", linewidth=2)
plot(targetLevel, color=color.green, title="Target", linewidth=2)

// Plot entry arrow
plotshape(series=longCondition and intradayCondition, title="Long Entry", color=color.green, style=shape.triangleup, location=location.belowbar)
Published by ChaoZhang on the FMZ strategy square · last modified 2023-12-13. Collected in the Quant Trading Vault. Unvalidated research: re-test with your own data and costs before trusting it.
Build this with AgenKit
A spec is not a trading system. Paste this into your coding agent and AgenKit runs a specialist team — architecture, test-first build, risk gates, review — with paper trading on by default.
/agenkit build a production-grade trading bot with a backtest engine, risk controls and paper trading by default from strategies/MACD-Golden-Cross-Breakout-with-200-Day-Moving-Average-Trend-Following-Strategy.md- npx agenkit install engineering-kit in your project
- Paste the command into your agent and approve each phase
- Get tests, backtest, risk controls and a paper-trading switch
Understand it first
Before you run this, read the lesson behind the idea and how to backtest it honestly. Specs like this one are the survivors of an unknown number of trials; deflate their results accordingly.
Related specs
- Bull Market Tracking SystemPine Script · Breakout · 1h
- Dual Breakout Volatility Channel StrategyPine Script · Breakout · 1h
- Dual Moving Average Breakthrough StrategyPine Script · Breakout · 1d
- EMA MACD Quantitative Strategy With Dual Track Running and Leading the Market IndexPine Script · Breakout · 1d
- Kana Candle Breakout Strategy Based on Moving Average and Support ResistancePine Script · Breakout · 1h
- MA Trendline Breakthrough StrategyPine Script · Breakout · 1d