Strategy vault / Trend following
MACD RSI Crossover Trend Following Strategy with Bollinger Bands Optimization System
This strategy is a trend following system based on MACD and RSI crossover signals, combined with Bollinger Bands for market volatility analysis. The core approach is to capture trend reversal points through the…
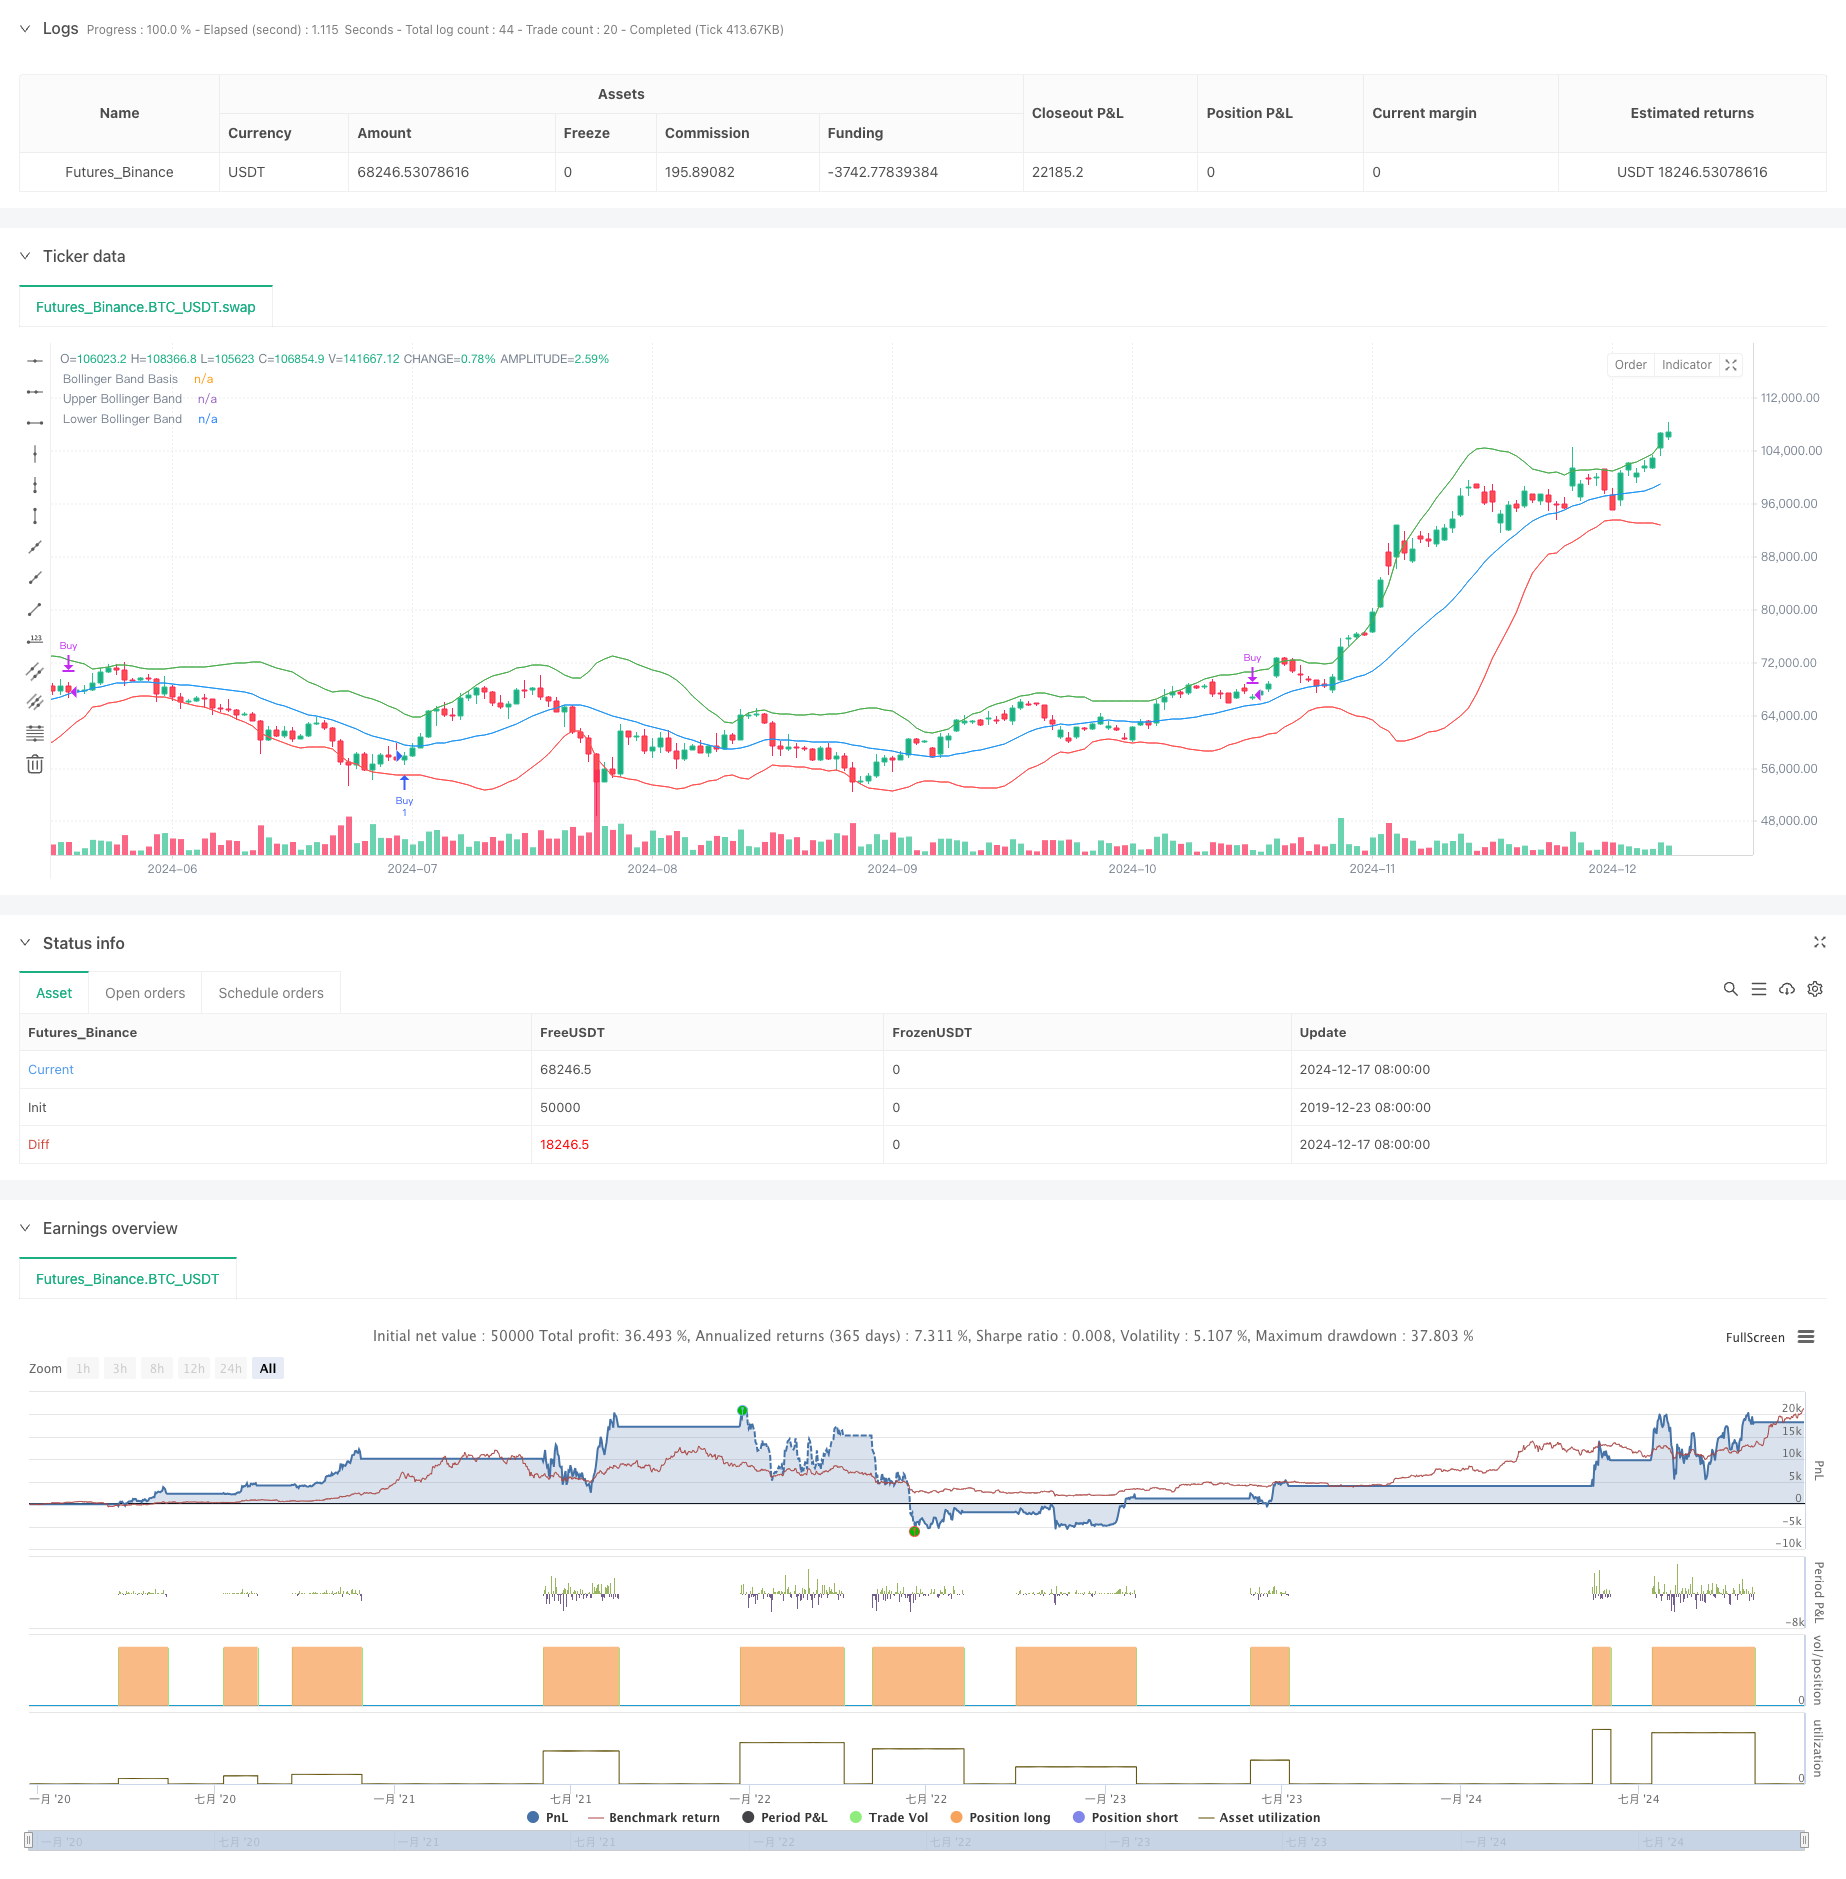
Overview
This strategy is a trend following system based on MACD and RSI crossover signals, combined with Bollinger Bands for market volatility analysis. The core approach is to capture trend reversal points through the coordination of MACD golden/death crosses and RSI overbought/oversold zones, while using Bollinger Bands to confirm price volatility ranges for more robust trading signals.
Strategy Principles
The strategy employs a triple technical indicator filtering mechanism:
- MACD indicator (12,26,9) captures trend momentum, generating long signals when the MACD line crosses above the signal line.
- RSI indicator (14) confirms overbought/oversold conditions, supporting long signals when below 50.
- Bollinger Bands (20,2) define price volatility ranges and provide reference for trading decisions.
Entry conditions require MACD golden cross and RSI in lower zone (<50), indicating potential market rebound from oversold areas. Exit conditions require MACD death cross and RSI in higher zone (>50), suggesting weakening upward momentum and possible correction.
Strategy Advantages
- Multiple technical indicators cross-validate, effectively reducing false signals.
- MACD and RSI combination captures both trends and overbought/oversold conditions.
- Bollinger Bands introduction helps assess market volatility states for better risk control.
- Clear strategy logic with adjustable parameters.
- Suitable for medium to long-term trend trading, avoiding frequent transactions.
Strategy Risks
- Ranging markets may generate frequent false breakout signals.
- Lag may occur in rapid oscillating markets.
- Multiple indicators may cause signal conflicts.
- Fixed RSI thresholds may need adjustment in different market environments.
- Lack of stop-loss mechanism may lead to significant drawdowns.
Strategy Optimization Directions
- Introduce adaptive RSI thresholds that dynamically adjust based on market volatility.
- Add ATR-based stop-loss mechanism for better risk control.
- Consider using Bollinger Band breakouts as signal confirmation.
- Include volume indicators as auxiliary confirmation.
- Implement market environment filtering, such as trend strength indicators.
- Optimize MACD parameters, consider using adaptive periods.
Summary
The strategy constructs a relatively complete trend following trading system through the combined application of MACD, RSI, and Bollinger Bands. It has solid theoretical foundation and practical feasibility, but still requires parameter optimization and risk control improvements based on specific market characteristics. Through the suggested optimization directions, the strategy has potential for better stability and profitability. The system is suitable for investors seeking medium to long-term trend opportunities, but users need to fully understand its limitations and implement proper risk management.
Source Pine Script
/*backtest
start: 2019-12-23 08:00:00
end: 2024-12-18 08:00:00
period: 1d
basePeriod: 1d
exchanges: [{"eid":"Futures_Binance","currency":"BTC_USDT"}]
*/

//@version=5
strategy("MACD, RSI, Bollinger Bands Strategy", overlay=true)

// Input parameters for MACD
fastLength = input.int(12, title="MACD Fast Length")
slowLength = input.int(26, title="MACD Slow Length")
signalLength = input.int(9, title="MACD Signal Length")

// Input parameters for RSI
rsiLength = input.int(14, title="RSI Length")

// Input parameters for Bollinger Bands
bbLength = input.int(20, title="Bollinger Band Length")
bbMult = input.float(2.0, title="Bollinger Band Multiplier")

// MACD calculation
[macdLine, signalLine, _] = ta.macd(close, fastLength, slowLength, signalLength)
macdCrossUp = ta.crossover(macdLine, signalLine)
macdCrossDown = ta.crossunder(macdLine, signalLine)

// RSI calculation
rsi = ta.rsi(close, rsiLength)

// Bollinger Bands calculation
bbBasis = ta.sma(close, bbLength)
bbUpper = bbBasis + bbMult * ta.stdev(close, bbLength)
bbLower = bbBasis - bbMult * ta.stdev(close, bbLength)

// Plot Bollinger Bands
plot(bbBasis, color=color.blue, title="Bollinger Band Basis")
plot(bbUpper, color=color.green, title="Upper Bollinger Band")
plot(bbLower, color=color.red, title="Lower Bollinger Band")

// Entry condition: MACD crosses signal line from below and RSI < 50
enterLong = macdCrossUp and rsi < 50

// Exit condition: MACD crosses signal line from above and close touches the Bollinger Band middle line
exitLong = macdCrossDown and rsi> 50

// Strategy logic
if (enterLong and strategy.position_size == 0)
    strategy.entry("Buy", strategy.long)

if (exitLong and strategy.position_size > 0)
    strategy.close("Buy")
Published by ChaoZhang on the FMZ strategy square · last modified 2024-12-20. Collected in the Quant Trading Vault. Unvalidated research: re-test with your own data and costs before trusting it.
Build this with AgenKit
A spec is not a trading system. Paste this into your coding agent and AgenKit runs a specialist team — architecture, test-first build, risk gates, review — with paper trading on by default.
/agenkit build a production-grade trading bot with a backtest engine, risk controls and paper trading by default from strategies/MACD-RSI-Crossover-Trend-Following-Strategy-with-Bollinger-Bands-Optimization-System.md- npx agenkit install engineering-kit in your project
- Paste the command into your agent and approve each phase
- Get tests, backtest, risk controls and a paper-trading switch
Understand it first
Before you run this, read the lesson behind the idea and how to backtest it honestly. Specs like this one are the survivors of an unknown number of trials; deflate their results accordingly.
Related specs
- Bollinger Bands and RSI Trend Following StrategyPine Script · Trend following · 1h
- EMA and RSI Trend Trading StrategyPine Script · Trend following · 1d
- Going with the Trend Moving Average Crossover StrategyPine Script · Trend following · 1d
- Adaptive Dual Strategy System for Trend Following and Range TradingPine Script · Trend following · 1h
- Enhanced Moving Average Crossover Sakkoulas Trading StrategyPine Script · Trend following · 1h
- Dynamic Multi Indicator Optimized Trend Following StrategyPine Script · Trend following · 2d