Strategy vault / Trend following
Major Trend Indicator Long
The Major Trend Indicator Long (MTIL) strategy is designed for use across various financial instruments including cryptocurrencies like BTCUSD and ETHUSD as well as traditional stocks such as AAPL. It aims to…
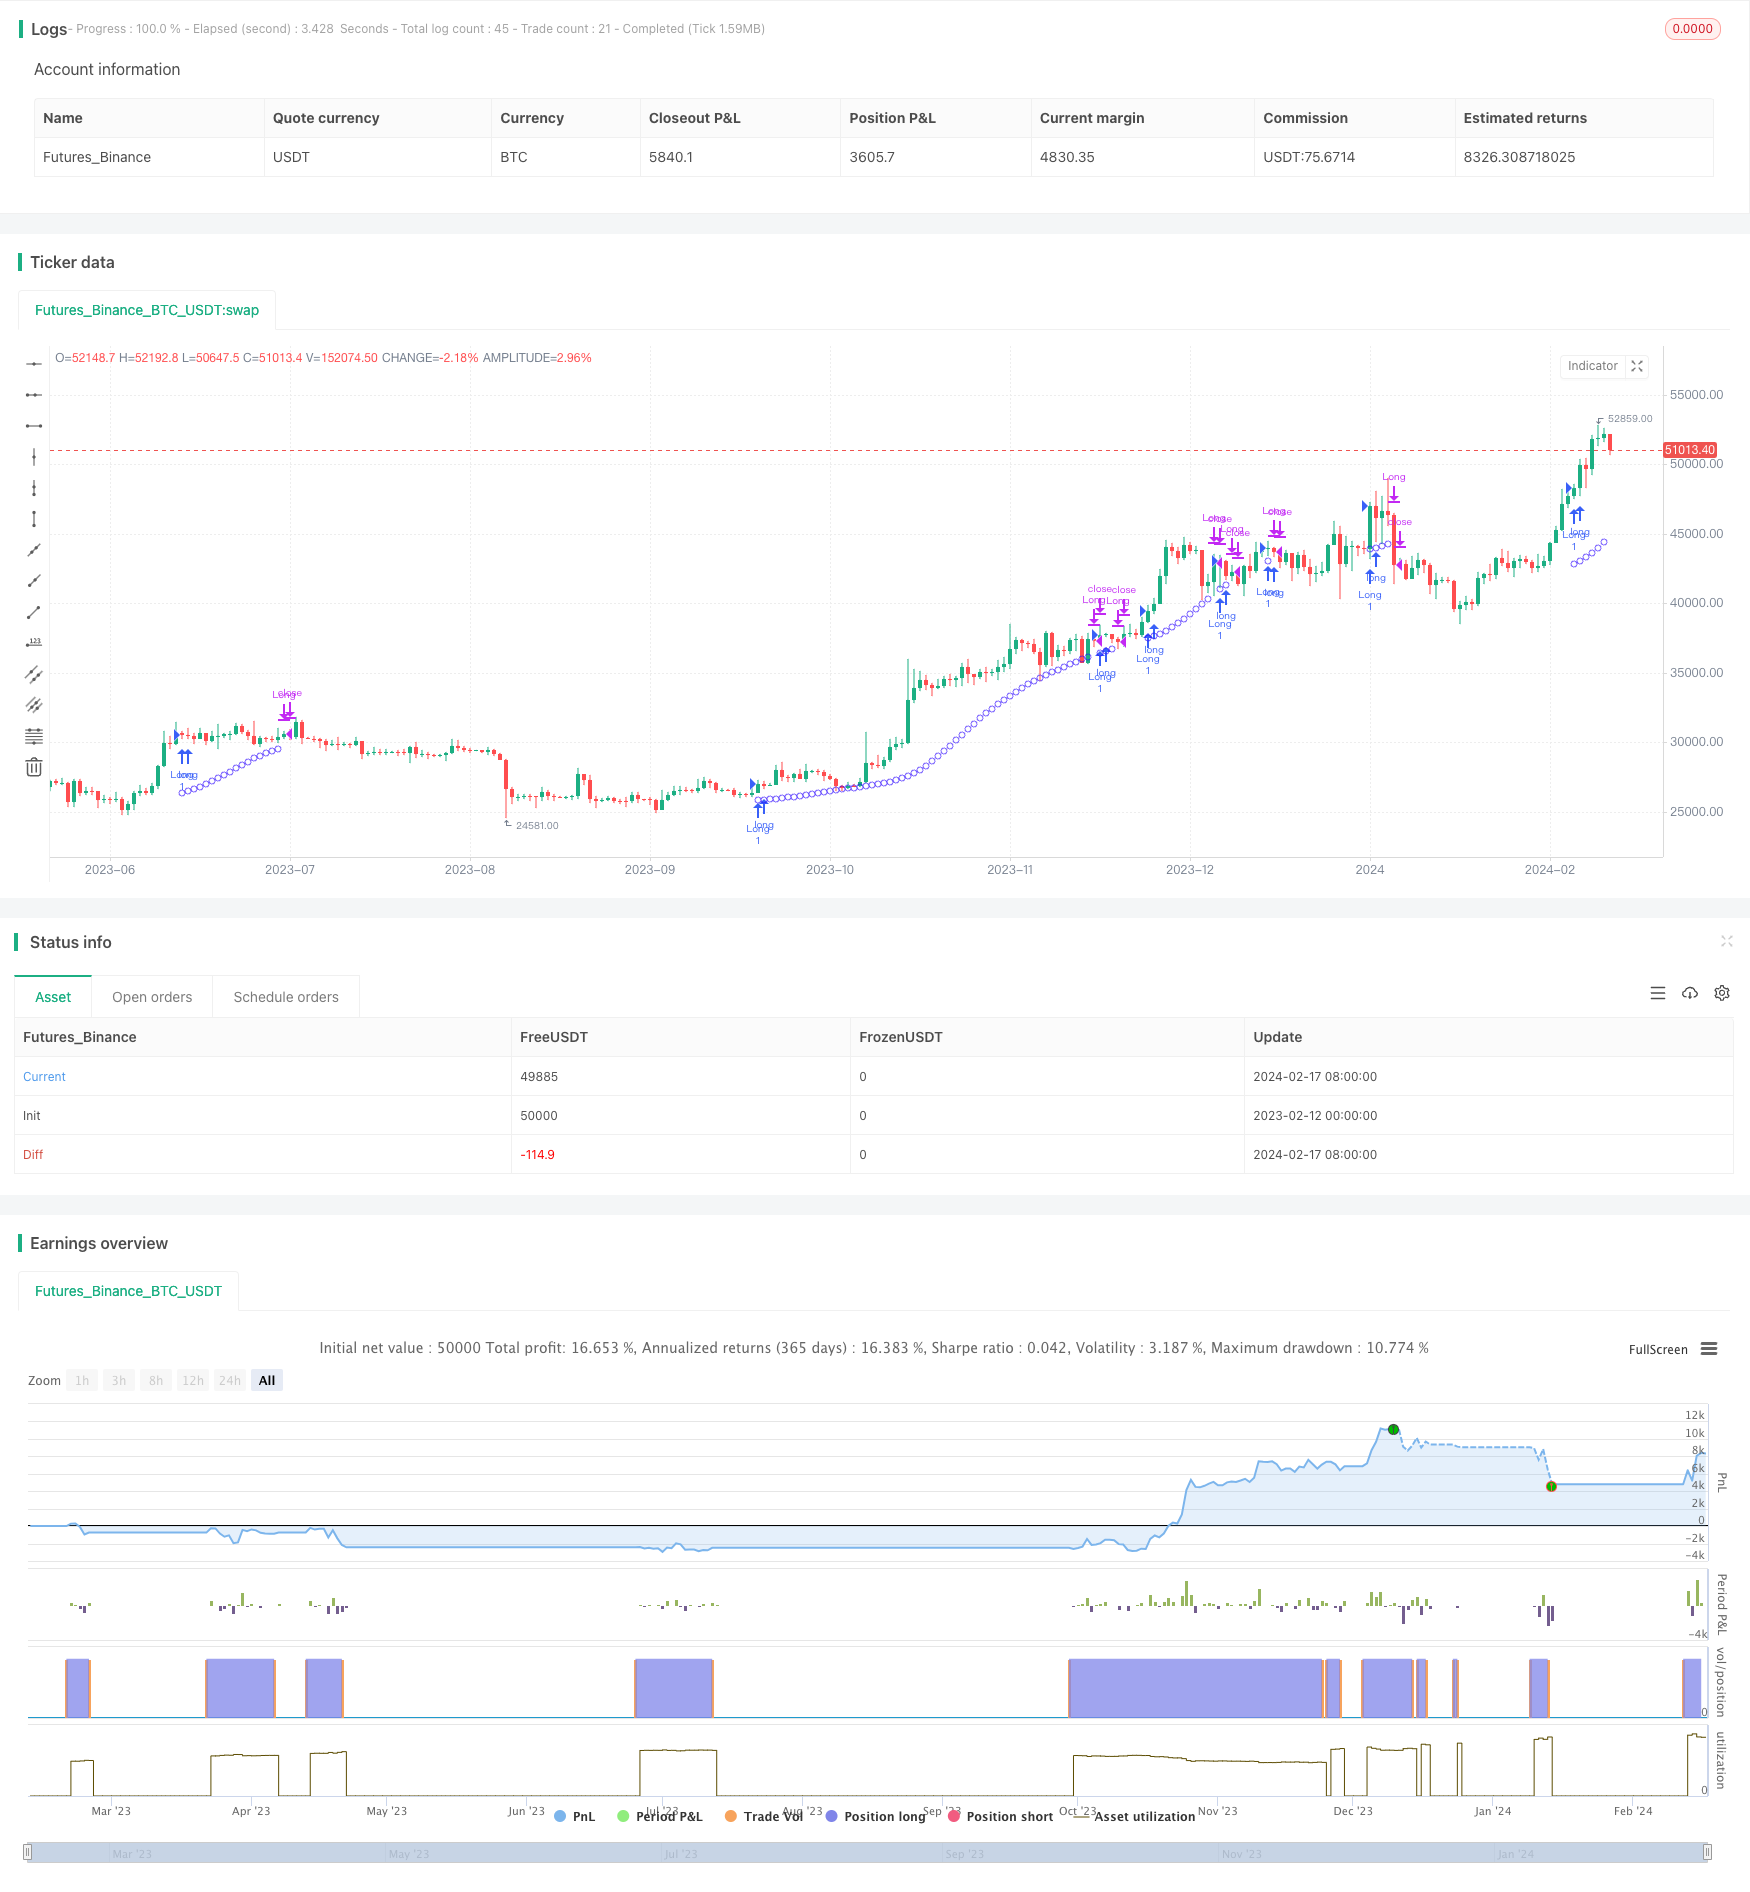
Overview
The Major Trend Indicator Long (MTIL) strategy is designed for use across various financial instruments including cryptocurrencies like BTCUSD and ETHUSD as well as traditional stocks such as AAPL. It aims to identify potential bullish trends for entering long positions.
Strategy Logic
The MTIL strategy utilizes optimized parameters to calculate the highest and lowest prices within defined lookback periods. It then applies linear regression to smooth the price data, spotting potential uptrends to signal long entries.
Specifically, it first derives the highest and lowest prices over given periods. These are then smoothed using linear regression with differing coefficients. This results in the creation of upper and lower bounds. When the smoothed highest prices breach the upper band, the smoothed lowest prices breach the lower band, and the short term linear regression of closing prices is above that of the long term - a bullish signal is generated.
Advantage Analysis
The MTIL strategy has the following advantages:
- Utilizes dual-smoothing techniques for trend identification with higher accuracy
- Customizable backtest start date for testing historical performance
- Customizable parameters catering to individual trading preferences
- Can be combined with short strategy for multi-timeframe analysis
Risk Analysis
The MTIL strategy also carries the following risks:
- Trend trading risks with possibility of magnified losses
- Inappropriate parameter tuning leading to missed opportunities or wrong signals
- Need to account for trading costs to avoid overly frequent trades
Some risks can be mitigated via parameter adjustment, stop losses, trade cost control etc.
Optimization Directions
The MTIL strategy can be optimized across the following dimensions:
- Testing combinations of different period parameters to find optimum
- Incorporating price-volume confirmation to avoid false signals
- Adding other indicators to further validate momentum and intraday moves to reinforce signal confirmation
- Establishing stop loss and take profit rules to limit downside vs lock in profits
Conclusion
The MTIL is a long side strategy harnessing linear regression techniques to spot major trends. Through parameter tuning it can be adapted across various market environments. When combined with a short side strategy it offers more comprehensive analysis. Further optimizations can enhance its accuracy and profitability.
Source Pine Script
/*backtest
start: 2023-02-12 00:00:00
end: 2024-02-18 00:00:00
period: 1d
basePeriod: 1h
exchanges: [{"eid":"Futures_Binance","currency":"BTC_USDT"}]
*/

// This source code is subject to the terms of the Mozilla Public License 2.0 at https://mozilla.org/MPL/2.0/
// © jensenvilhelm


//@version=5
strategy("Major Trend Indicator Long", shorttitle='MTIL', overlay = true)

startDate = timestamp("2001 06 18")
// Sets the start date for the strategy.

// Optimized parameters
length_high = 5
length_low = 5
linReg_st = 3
linReg_st1 = 23
linReg_lt = 75
// Defines key parameters for the strategy.

X_i = ta.highest(high, length_high)
Y_i = ta.lowest(low, length_low)
// Calculates the highest and lowest price values within the defined lookback periods.

x_y = ta.linreg(X_i + high, linReg_st1, 1)
y_x = ta.linreg(Y_i + low, linReg_lt, 1)
// Applies linear regression to smoothed high and low prices.

upper = ta.linreg(x_y, linReg_st1, 6)
lower = ta.linreg(y_x, linReg_st1, 6)
// Determines upper and lower bounds using linear regression.

upperInside = upper < y_x and upper > x_y
lowerInside = lower > y_x and lower < x_y
y_pos = (upper + lower) / 4

X_i1 = ta.highest(high, length_high)
Y_i1 = ta.lowest(low, length_low)

bull = x_y > upper and y_x > lower and ta.linreg(close, linReg_st, 1) > ta.linreg(close, linReg_lt, 5)
// Defines a bullish condition based on linear regression values and price bounds.

plotshape(series=(bull) ? y_pos : na, style=shape.circle, location=location.absolute, color=color.rgb(41, 3, 255, 40), size=size.tiny)

if (time >= startDate)
    if (bull)
        strategy.entry("Long", strategy.long)
    if not (bull)
        strategy.close("Long")
// Controls the strategy's execution based on the bullish condition and the start date.
Published by ChaoZhang on the FMZ strategy square · last modified 2024-02-19. Collected in the Quant Trading Vault. Unvalidated research: re-test with your own data and costs before trusting it.
Build this with AgenKit
A spec is not a trading system. Paste this into your coding agent and AgenKit runs a specialist team — architecture, test-first build, risk gates, review — with paper trading on by default.
/agenkit build a production-grade trading bot with a backtest engine, risk controls and paper trading by default from strategies/Major-Trend-Indicator-Long.md- npx agenkit install engineering-kit in your project
- Paste the command into your agent and approve each phase
- Get tests, backtest, risk controls and a paper-trading switch
Understand it first
Before you run this, read the lesson behind the idea and how to backtest it honestly. Specs like this one are the survivors of an unknown number of trials; deflate their results accordingly.
Related specs
- Adaptive Trading Strategy Based on Stochastic RSI Dual Line CrossoverPine Script · Trend following · 4h
- CM Multiple EMA Crossover StrategyPine Script · Trend following · 6h
- Dual Moving Average Convergence Trend Tracking StrategyPine Script · Trend following · 1d
- Dual SMA Crossover StrategyPine Script · Trend following · 5m
- Dynamic Dual EMA Trend Following StrategyPine Script · Trend following · 1d
- Dynamic Moving Average and Bollinger Bands Cross Strategy with Fixed Stop Loss Optimization ModelPine Script · Trend following · 3h