Strategy vault / Machine learning
Market Structure Swing Trading Strategy
The Market Structure Swing Trading Strategy is an advanced trading approach based on market structure changes, liquidity capture, and trend momentum. By analyzing key characteristics of price movements, the strategy…
Overview
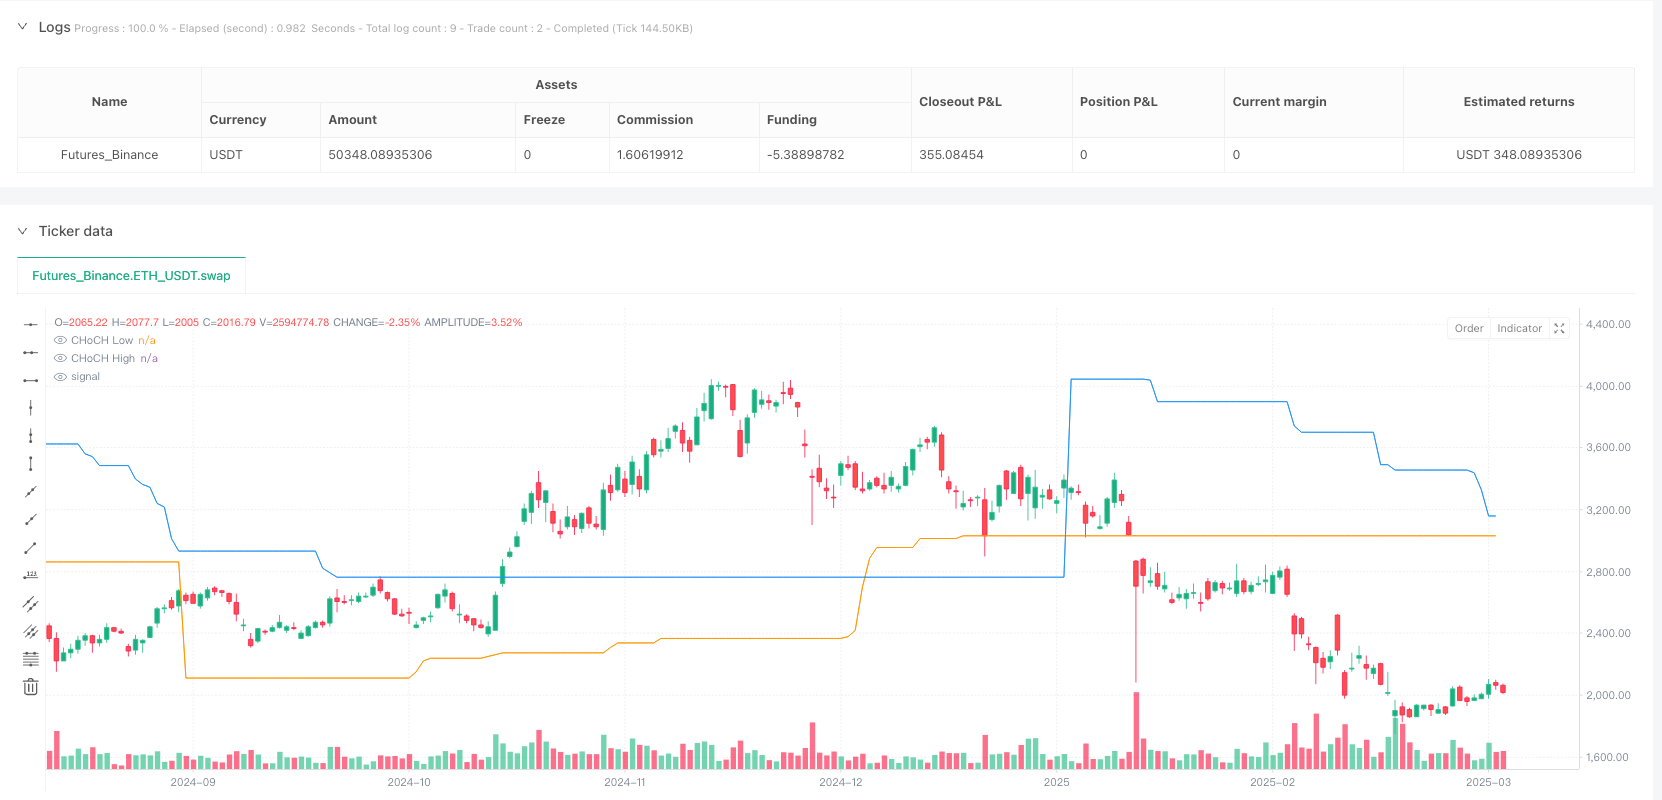
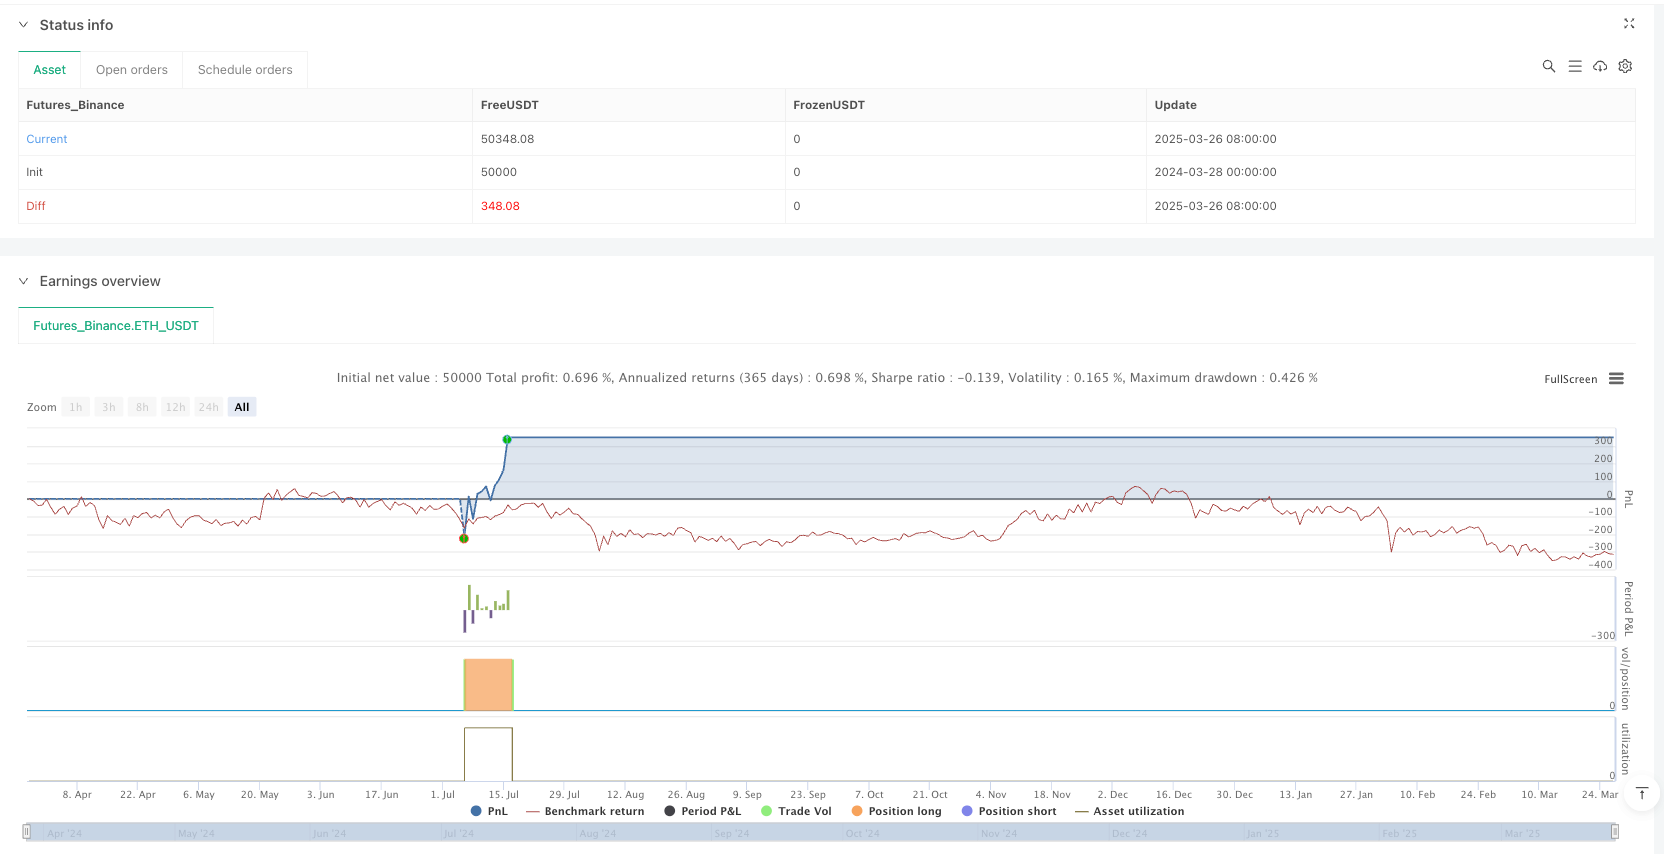
The Market Structure Swing Trading Strategy is an advanced trading approach based on market structure changes, liquidity capture, and trend momentum. By analyzing key characteristics of price movements, the strategy identifies potential trend reversals and continuation opportunities, providing traders with a systematic decision-making framework.
Strategy Principles
The core principles are based on four key indicators:
- Change of Character (CHoCH): Identifying potential market direction changes by detecting trend turning points.
- Break of Structure (BOS): Confirming trend momentum and directional breakouts.
- Inducements (IDM): Capturing market liquidity traps and money flow.
- Sweeps: Identifying false breakouts and liquidity grab opportunities.
The strategy integrates technical analysis indicators, including Average True Range (ATR), Relative Strength Index (RSI), and volume, to construct a multi-dimensional trading decision system.
Strategy Advantages
- Systematic Risk Management: Effectively controlling single-trade risk through ATR-based stop-loss and take-profit calculations.
- Multiple Filter Conditions: Combining CHoCH, BOS, RSI, and volume to improve signal accuracy.
- Dynamic Position Management: Optimizing capital efficiency using percentage of equity positioning.
- Flexible Entry and Exit Mechanisms: Dynamically adjusting trading strategies based on market structure.
Strategy Risks
- False Breakout Risk: Market structure indicators may generate misleading signals.
- Parameter Sensitivity: Strategy performance significantly depends on parameter settings.
- Volume and Liquidity Risks: Potential poor performance in low-liquidity markets.
- Drawdown Control: Possible significant drawdowns in persistent trend markets.
Strategy Optimization Directions
- Introduce Machine Learning Algorithms: Optimize parameter selection and signal identification.
- Incorporate Multi-Timeframe Analysis: Improve signal reliability.
- Develop Dynamic Risk Management Modules: Adjust positions based on market volatility.
- Integrate Additional Technical Indicators: Enhance signal filtering using MACD, Bollinger Bands, etc.
Conclusion
The Market Structure Swing Trading Strategy is an advanced quantitative trading method that provides traders with a powerful decision-making framework through systematic market structure analysis. With continuous optimization and risk management, the strategy has the potential to achieve stable trading performance across different market environments.
Source Pine Script
/*backtest
start: 2024-03-28 00:00:00
end: 2025-03-27 00:00:00
period: 1d
basePeriod: 1d
exchanges: [{"eid":"Futures_Binance","currency":"ETH_USDT"}]
*/

//@version=5
strategy("Market Structure Swing Trading", overlay=true, default_qty_type=strategy.percent_of_equity, default_qty_value=5)

// === Input Parameters ===
len = input(50, "CHoCH Detection Period")
shortLen = input(3, "IDM Detection Period")
atrMultiplierSL = input(2.0, "ATR Multiplier for Stop Loss")
atrMultiplierTP = input(3.0, "ATR Multiplier for Take Profit")
rsiPeriod = input(14, "RSI Period")
rsiOverbought = input(70, "RSI Overbought Level")
rsiOversold = input(30, "RSI Oversold Level")
volThreshold = input(1.2, "Volume Multiplier Threshold")

// === ATR Calculation for SL & TP ===
atr = ta.atr(14)
stopLossLong = close - (atr * atrMultiplierSL)
takeProfitLong = close + (atr * atrMultiplierTP)
stopLossShort = close + (atr * atrMultiplierSL)
takeProfitShort = close - (atr * atrMultiplierTP)

// === RSI Filter ===
rsi = ta.rsi(close, rsiPeriod)
longConditionRSI = rsi < rsiOversold
shortConditionRSI = rsi > rsiOverbought

// === Volume Filter ===
volThresholdValue = ta.sma(volume, 20) * volThreshold
highVolume = volume > volThresholdValue

// === Market Structure Functions ===
swings(len) =>
    var int topx = na
    var int btmx = na
    upper = ta.highest(len)
    lower = ta.lowest(len)
    top = high[len] > upper ? high[len] : na
    btm = low[len] < lower ? low[len] : na
    topx := top ? bar_index[len] : topx
    btmx := btm ? bar_index[len] : btmx
    [top, topx, btm, btmx]

[top, topx, btm, btmx] = swings(len)

// === CHoCH Detection ===
var float topy = na
var float btmy = na
var os = 0
var top_crossed = false
var btm_crossed = false

if top
    topy := top
    top_crossed := false
if btm
    btmy := btm
    btm_crossed := false

if close > topy and not top_crossed
    os := 1
    top_crossed := true
if close < btmy and not btm_crossed
    os := 0
    btm_crossed := true

// === Break of Structure (BOS) ===
var float max = na
var float min = na
var int max_x1 = na
var int min_x1 = na

if os != os[1]
    max := high
    min := low
    max_x1 := bar_index
    min_x1 := bar_index

bullishBOS = close > max and os == 1
bearishBOS = close < min and os == 0

// === Trade Conditions with Filters ===
longEntry = bullishBOS and longConditionRSI and highVolume
shortEntry = bearishBOS and shortConditionRSI and highVolume

// === Execute Trades ===
if longEntry
    strategy.entry("Long", strategy.long)
    strategy.exit("Long TP/SL", from_entry="Long", stop=stopLossLong, limit=takeProfitLong)

if shortEntry
    strategy.entry("Short", strategy.short)
    strategy.exit("Short TP/SL", from_entry="Short", stop=stopLossShort, limit=takeProfitShort)

// === Plotting Market Structure ===
plotshape(series=longEntry, location=location.belowbar, color=color.green, style=shape.labelup, title="BUY")
plotshape(series=shortEntry, location=location.abovebar, color=color.red, style=shape.labeldown, title="SELL")
plot(topy, color=color.blue, title="CHoCH High")
plot(btmy, color=color.orange, title="CHoCH Low")
Published by ianzeng123 on the FMZ strategy square · last modified 2025-03-28. Collected in the Quant Trading Vault. Unvalidated research: re-test with your own data and costs before trusting it.
Build this with AgenKit
A spec is not a trading system. Paste this into your coding agent and AgenKit runs a specialist team — architecture, test-first build, risk gates, review — with paper trading on by default.
/agenkit build a production-grade trading bot with a backtest engine, risk controls and paper trading by default from strategies/Market-Structure-Swing-Trading-Strategy.md- npx agenkit install engineering-kit in your project
- Paste the command into your agent and approve each phase
- Get tests, backtest, risk controls and a paper-trading switch
Understand it first
Before you run this, read the lesson behind the idea and how to backtest it honestly. Specs like this one are the survivors of an unknown number of trials; deflate their results accordingly.
Related specs
- ADX EFI 50 Moving Average Channel Pullback StrategyPine Script · Machine learning · 1h
- Quantitative Multi Factor Dynamic Options Trading StrategyPine Script · Machine learning · 1h
- Multi indicator Combination StrategyPine Script · Machine learning · 1d
- EMA and RSI Quantitative Trading StrategyPine Script · Machine learning · 1h
- High Frequency Hybrid Technical Analysis Quantitative StrategyPine Script · Machine learning · 15m
- Multi Indicator Dynamic Adaptive Quantitative Trading StrategyPine Script · Machine learning · 1h