Strategy vault / Mean reversion
Mean Reversion Bollinger Bands Strategy
The Mean Reversion Bollinger Bands strategy uses the Bollinger Bands indicator to gauge market volatility and moving averages to determine the trend, taking trend trades during periods of low volatility to profit…
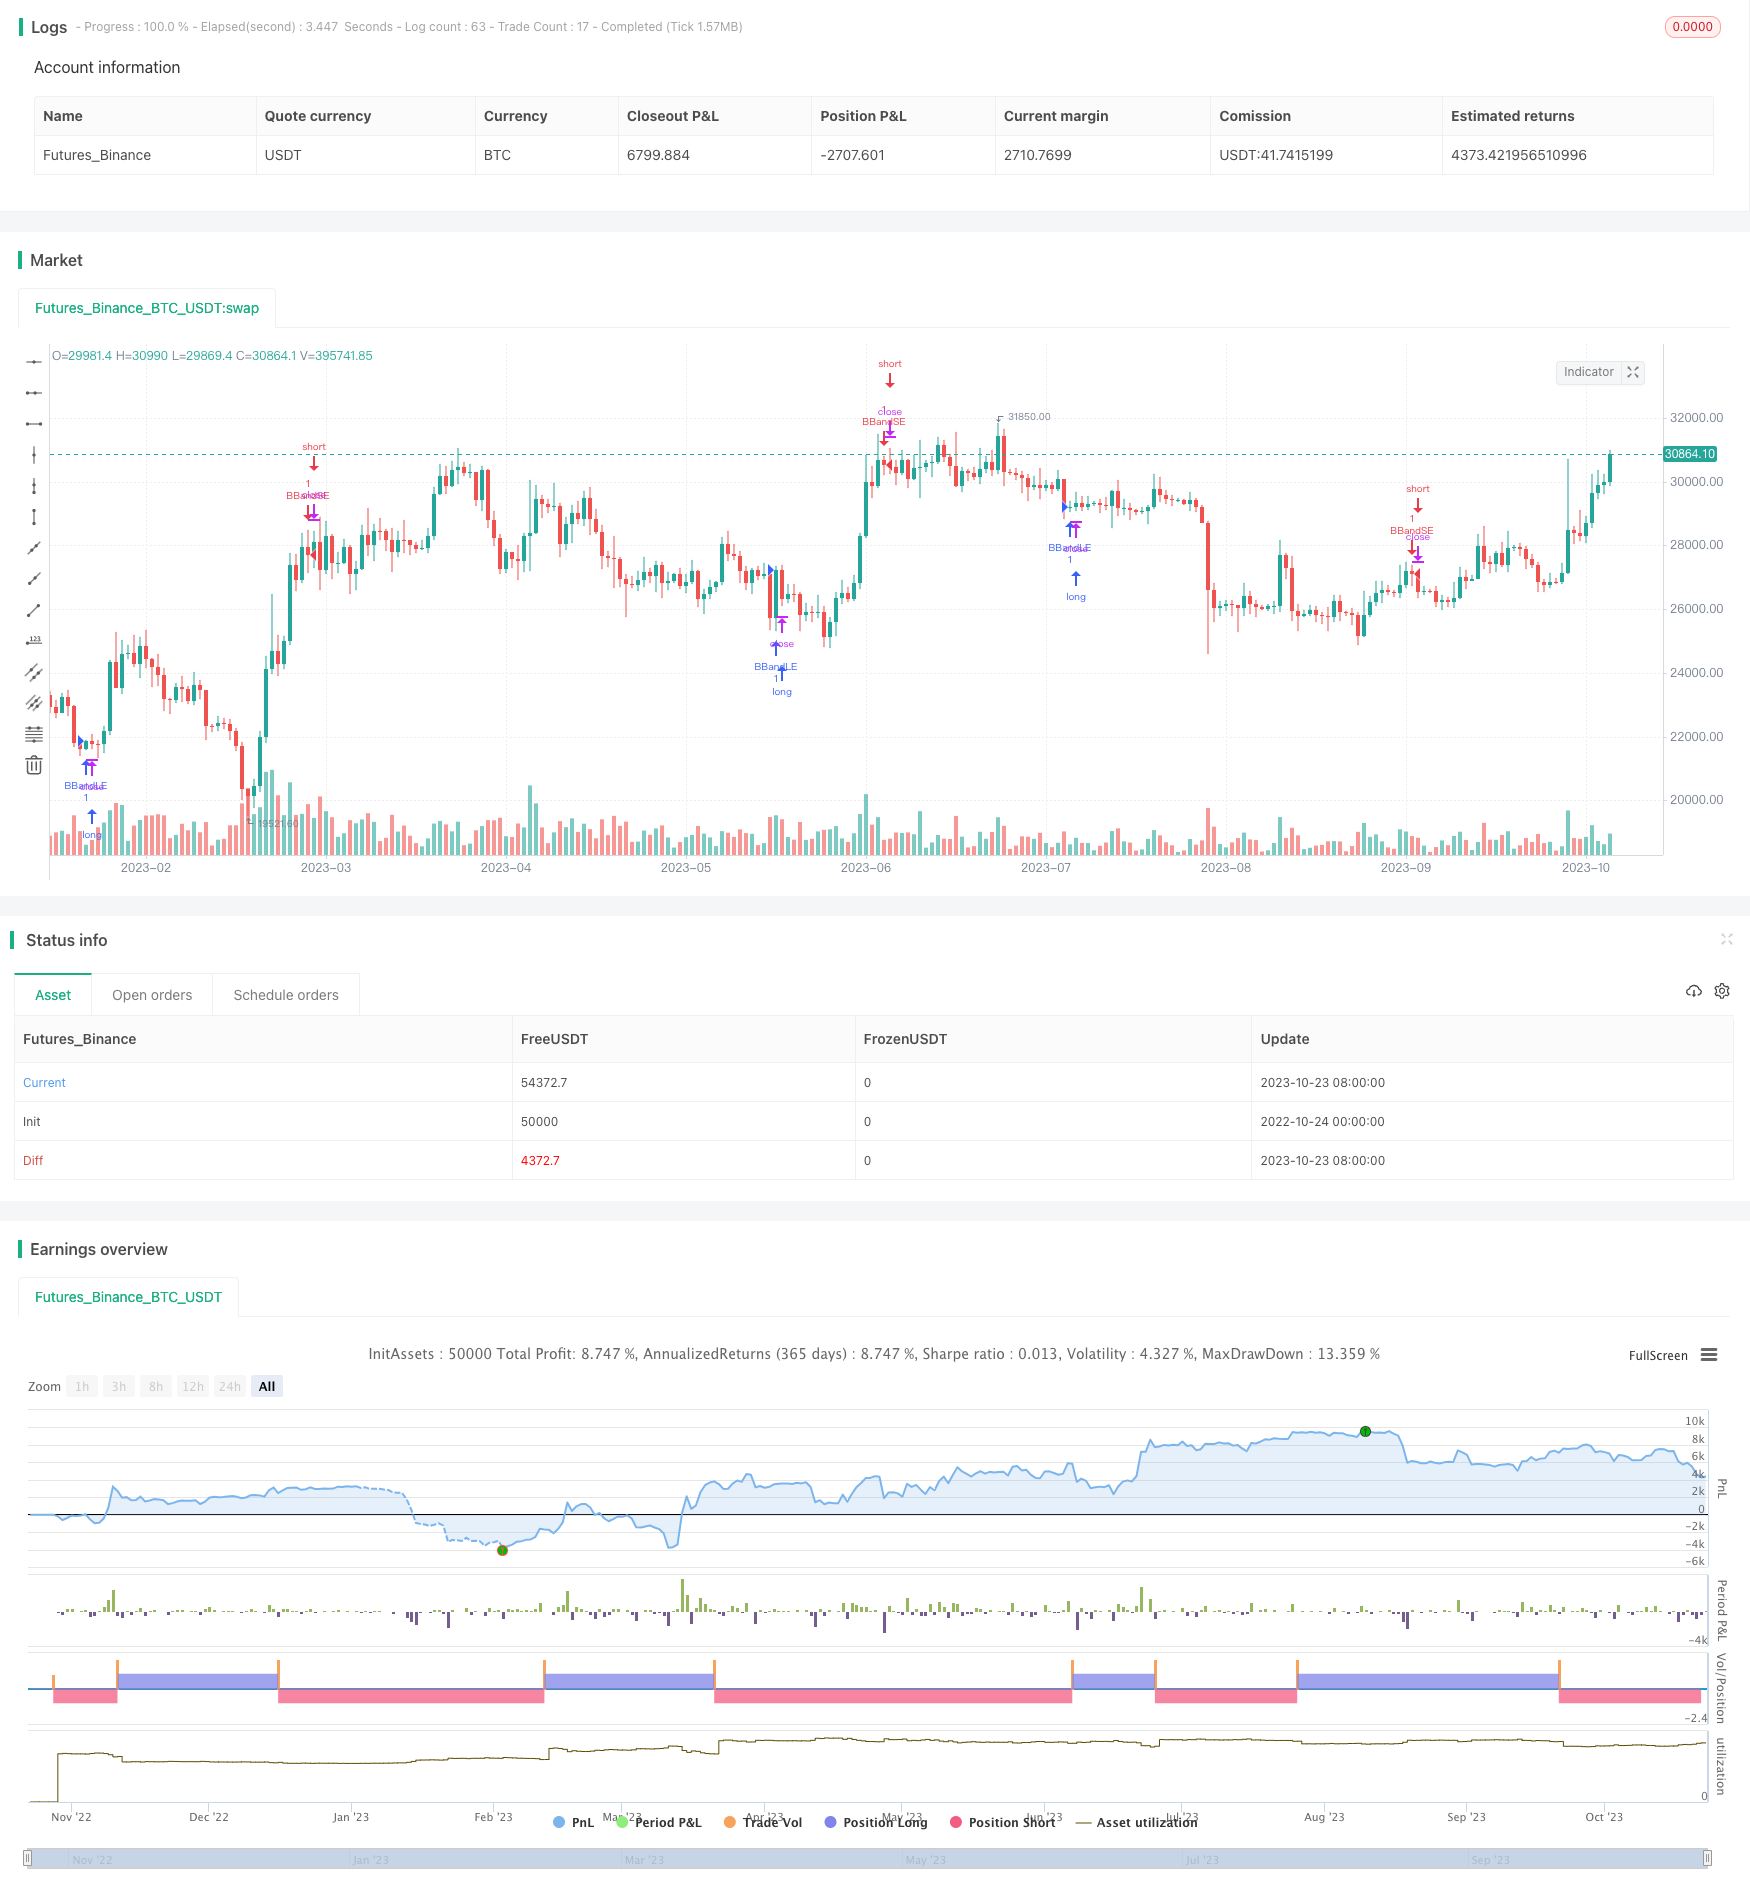
Overview
The Mean Reversion Bollinger Bands strategy uses the Bollinger Bands indicator to gauge market volatility and moving averages to determine the trend, taking trend trades during periods of low volatility to profit from the trend while avoiding excessive randomness.
Strategy Logic
The strategy calculates the moving average and upper/lower bands representing a certain multiplier of standard deviation above and below the moving average, forming the Bollinger Bands. When price approaches the bands, it indicates increased volatility. When price is within the bands, it signals decreased volatility.
The strategy goes long when price breaks above the lower band on an uptrending moving average, and goes short when price breaks below the upper band on a downtrending moving average. The corresponding band is used as the stop loss to control risk.
The advantage of this approach is participating in the trend during periods of low volatility, avoiding excessive random price fluctuations and increasing the probability of profit.
Advantage Analysis
- Trading the trend on low volatility reduces randomness and increases stability
By only trading the trend when the Bollinger Bands contract and volatility decreases, the strategy avoids uncertain periods of high volatility, reducing randomness and increasing stability.
- Moving average assists trend judgment, improving accuracy
The moving average, in addition to the Bollinger Bands gauging volatility, helps determine the trend direction, with the two validating each other and improving accuracy.
- Built-in stop loss controls risk
The strategy sets stop loss levels at the bands for each trade, allowing quick stops and risk control.
Risk Analysis
- Trend misjudgment risk
The moving average direction may change during band contraction, leading to incorrect trend judgment and losses.
Adding other indicators to confirm the trend can help minimize this risk.
- Excessive band volatility risk
If bands are too wide due to excessive standard deviation multiplier, ineffective trades will be too frequent.
Optimizing the parameter or adding band width threshold filters can improve this.
- Breakout failure risk
Price may fail to trend after breaking the bands, causing losses.
Using only closing breaks or adding volume confirmation can reduce failed breakouts.
Optimization Directions
- Add more indicator confirmations
Adding indicators like MACD and KDJ to confirm moving average signals improves accuracy.
- Optimize parameters
Backtesting to find optimal moving average and standard deviation multiplier parameters improves performance.
- Optimize entry timing
Using only closing breaks or adding volume filters improves timing.
- Optimize stop loss strategy
Trailing stops and moving stops can help lock in profits and prevent giving back gains.
Conclusion
The Mean Reversion Bollinger Bands Strategy cleverly uses the bands to identify low volatility periods and the moving average to determine trend direction, participating in trends when volatility decreases. This filters out excessive randomness and increases stability. The strategy has advantages but also risks to watch out for. Further improvements in stability and profitability can come from additional indicator confirmations, parameter optimization, improved entry timing, and advanced stop loss strategies.
Parameters
| Name | Default | What it controls |
|---|---|---|
| v_input_1 | 20 | length |
| v_input_2 | 2 | mult |
Source Pine Script
/*backtest
start: 2022-10-24 00:00:00
end: 2023-10-24 00:00:00
period: 1d
basePeriod: 1h
exchanges: [{"eid":"Futures_Binance","currency":"BTC_USDT"}]
*/

//@version=4
strategy("Trading Public School", overlay=true)
source = close
length = input(20, minval=1)
mult = input(2.0, minval=0.001, maxval=50)

basis = sma(source, length)
dev = mult * stdev(source, length)

upper = basis + dev
lower = basis - dev

buyEntry = crossover(source, lower)
sellEntry = crossunder(source, upper)

if (crossover(source, lower))
    strategy.entry("BBandLE", strategy.long, stop=lower, oca_name="BollingerBands",  comment="BBandLE")
else
    strategy.cancel(id="BBandLE")

if (crossunder(source, upper))
    strategy.entry("BBandSE", strategy.short, stop=upper, oca_name="BollingerBands",  comment="BBandSE")
else
    strategy.cancel(id="BBandSE")

//plot(strategy.equity, title="equity", color=color.red, linewidth=2, style=plot.style_areabr)
Published by ChaoZhang on the FMZ strategy square · last modified 2023-10-25. Collected in the Quant Trading Vault. Unvalidated research: re-test with your own data and costs before trusting it.
Build this with AgenKit
A spec is not a trading system. Paste this into your coding agent and AgenKit runs a specialist team — architecture, test-first build, risk gates, review — with paper trading on by default.
/agenkit build a production-grade trading bot with a backtest engine, risk controls and paper trading by default from strategies/Mean-Reversion-Bollinger-Bands-Strategy.md- npx agenkit install engineering-kit in your project
- Paste the command into your agent and approve each phase
- Get tests, backtest, risk controls and a paper-trading switch
Understand it first
Before you run this, read the lesson behind the idea and how to backtest it honestly. Specs like this one are the survivors of an unknown number of trials; deflate their results accordingly.
Related specs
- Advanced 15 Minute Chart Trading Signal StrategyPine Script · Mean reversion · 3h
- Dynamic Adaptive Multi Timeframe Trend Following and Range Reversal Hybrid StrategyPine Script · Mean reversion · 2d
- Multi Indicator Reversal Point Capture Trading StrategyPine Script · Mean reversion · 1d
- Multi Timeframe Adaptive Mean Reversion with Volume Analysis StrategyPine Script · Mean reversion · 1h
- Smoothed RSI Based Stock Trading StrategyPine Script · Mean reversion · 1h
- CCTBBO Reversal Tracking StrategyPine Script · Mean reversion · 45m