Strategy vault / Mean reversion
Mean Reversion Strategy
This strategy is based on the principle of mean reversion, using the deviation of prices from the moving average to make trading decisions. It goes short when the price deviates above the upper band and goes long…
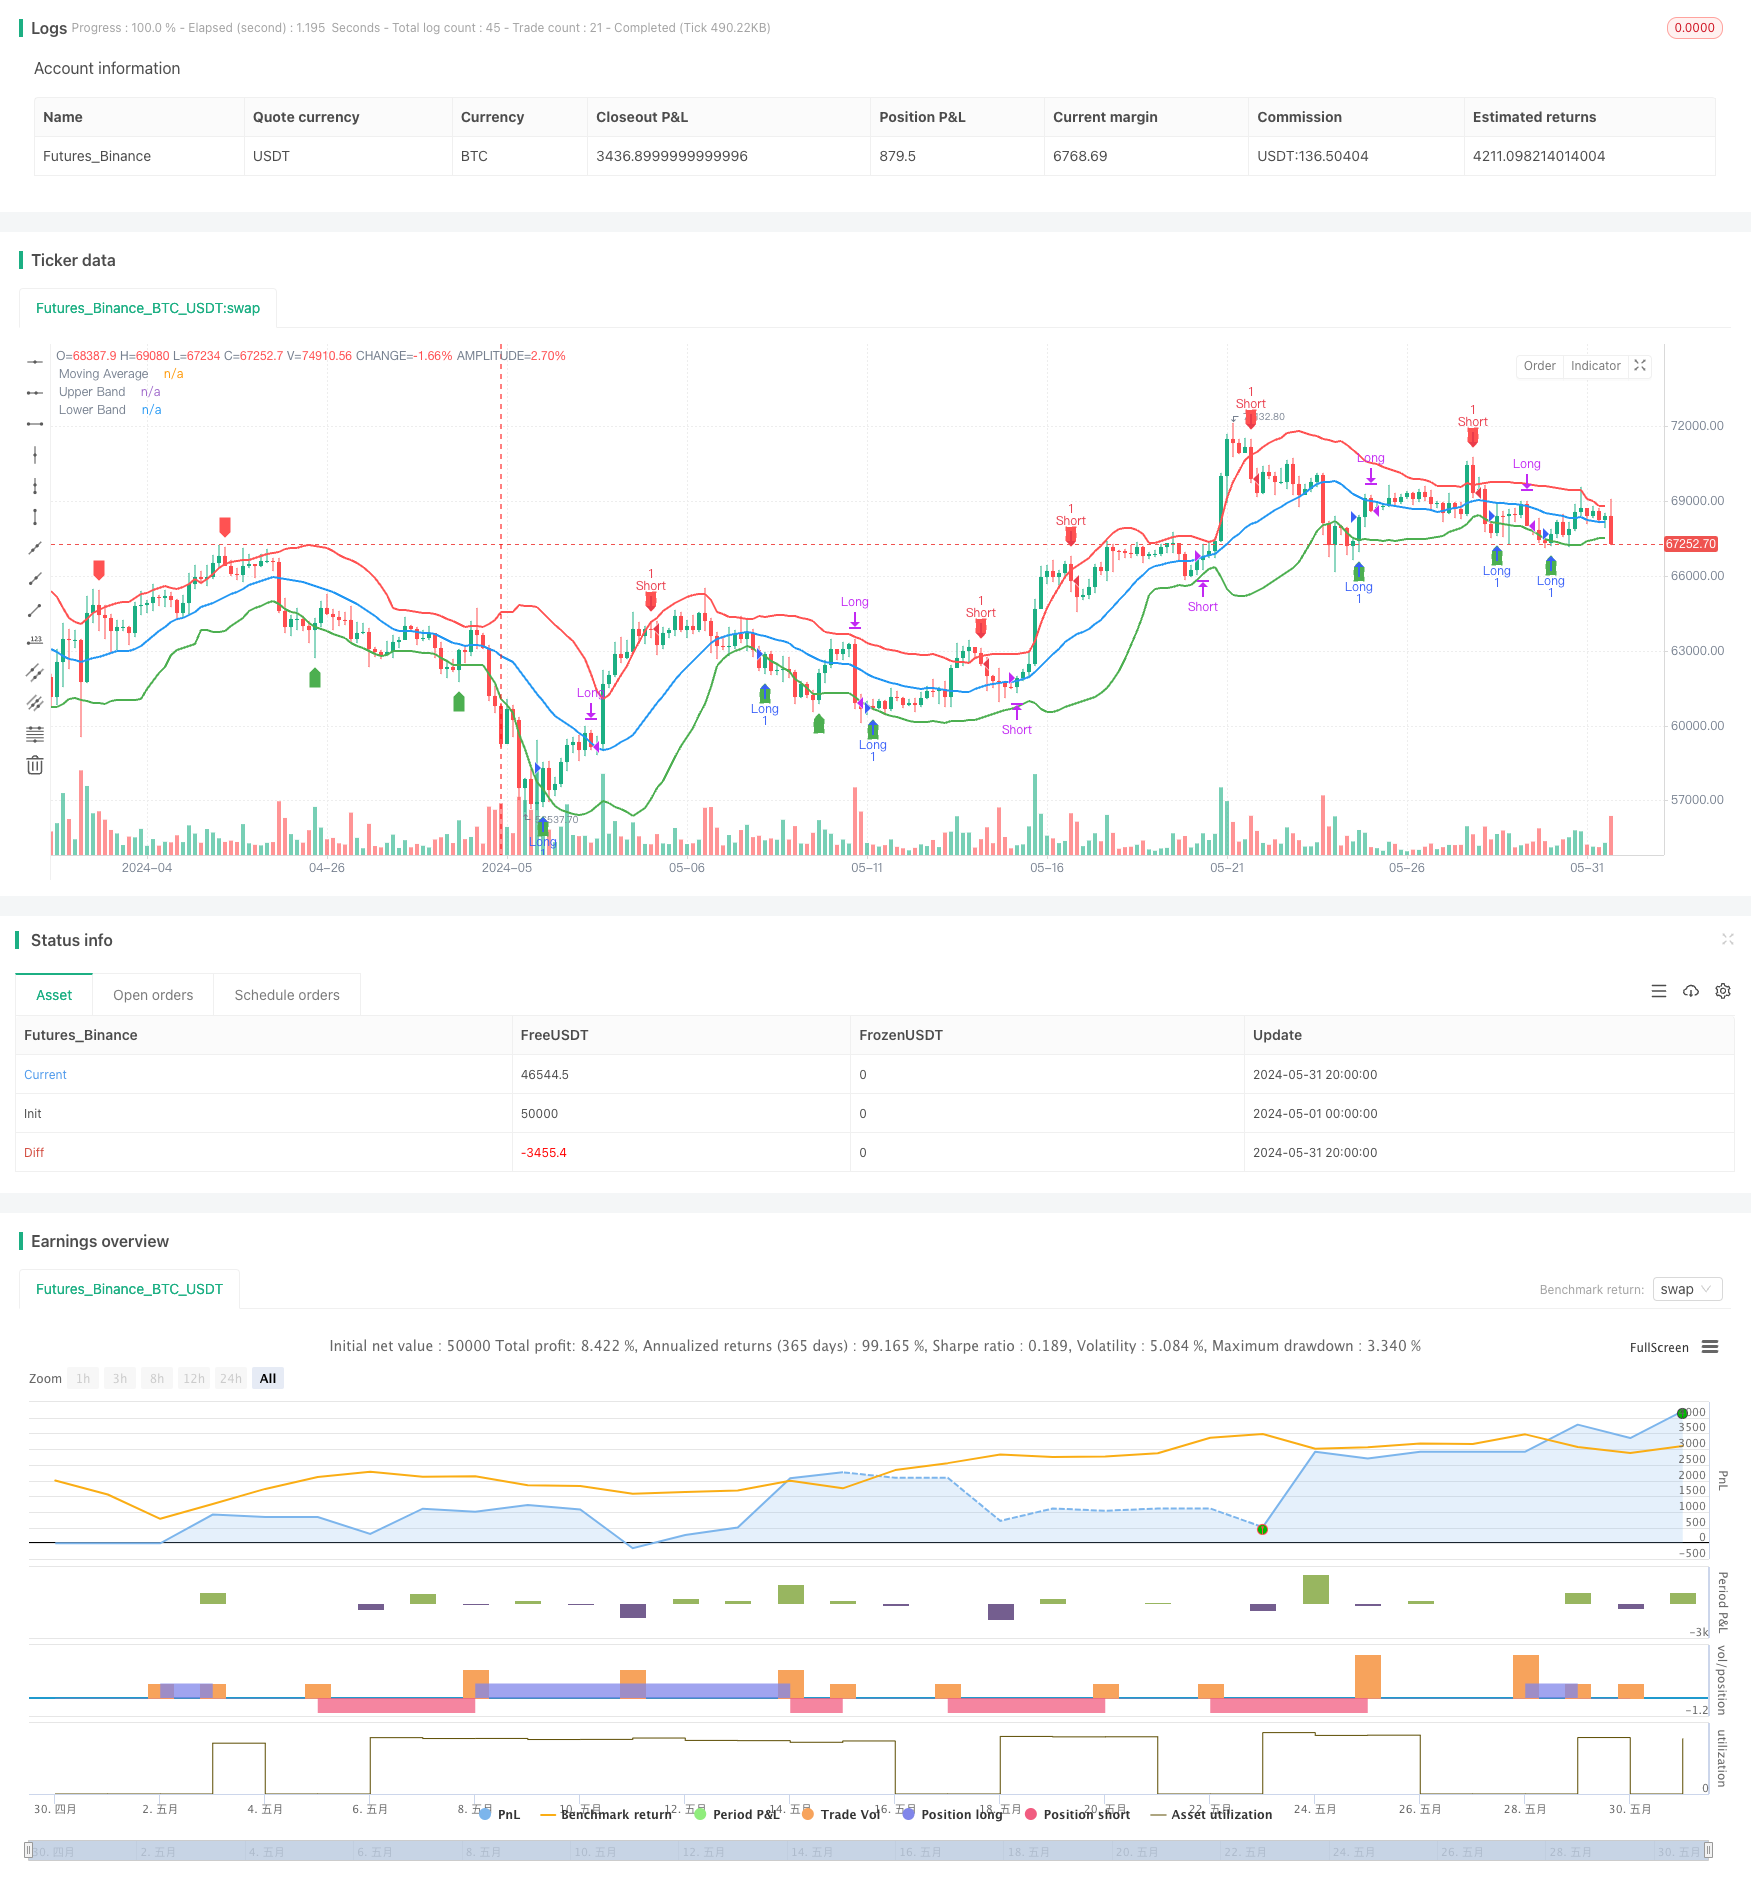
Overview
This strategy is based on the principle of mean reversion, using the deviation of prices from the moving average to make trading decisions. It goes short when the price deviates above the upper band and goes long when it deviates below the lower band. The position is closed when the price reverts back to the moving average. The core assumption of this strategy is that prices will always revert to the mean level.
Strategy Principles
- Calculate the simple moving average (SMA) of a specified period (default 20) as the mean price level.
- Calculate the standard deviation (DEV) of prices and use it to construct upper and lower bands. The upper band is the SMA plus a multiple (default 1.5) of the standard deviation, and the lower band is the SMA minus a multiple of the standard deviation.
- Go short when the price breaks above the upper band, and go long when it breaks below the lower band.
- Close the long position when the price crosses below the SMA, and close the short position when the price crosses above the SMA.
- Mark the moving average, upper band, lower band, and buy/sell signals on the chart.
Advantage Analysis
- The mean reversion strategy is based on the statistical principle that prices always revert to the mean, which has a certain probability of profitability in the long run.
- The setting of upper and lower bands provides clear entry and exit points, which is convenient for execution and management.
- The strategy logic is simple and clear, easy to understand and implement.
- It is suitable for instruments and timeframes that exhibit obvious mean-reversion characteristics.
Risk Analysis
- When the market trend changes, prices may deviate from the mean for a long time without reverting, causing the strategy to fail.
- Improper setting of the standard deviation multiple may lead to too high or too low trading frequency, affecting returns.
- In extreme market conditions, price fluctuations can be violent, and the upper and lower bands may lose their effectiveness.
- If the instrument or timeframe does not have mean-reversion characteristics, the strategy may not be profitable.
Optimization Directions
- Perform optimization tests on the SMA period and standard deviation multiple to find the best parameters.
- Introduce trend judgment indicators to avoid counter-trend trading when the trend is clear.
- Add volatility indicators such as ATR in addition to standard deviation to construct dynamic bands.
- Consider trading costs such as slippage and commissions to control the authenticity of backtesting.
- Add risk control modules, such as stop-loss, take-profit, and position management.
Summary
The mean reversion strategy is a quantitative trading strategy based on statistical principles, which makes trading decisions by constructing upper and lower bands around the mean price. The strategy has simple logic and clear execution, but attention should be paid to the selection of instruments and optimization of parameters. In practical application, factors such as trend, trading costs, and risk control also need to be considered to improve the robustness and profitability of the strategy. In general, the mean reversion strategy is a common and worthy of in-depth study in the field of quantitative trading.
Source Pine Script
/*backtest
start: 2024-05-01 00:00:00
end: 2024-05-31 23:59:59
period: 4h
basePeriod: 15m
exchanges: [{"eid":"Futures_Binance","currency":"BTC_USDT"}]
*/

//@version=5
strategy("Mean Regression Strategy", overlay=true)

// Define the lookback period for the moving average
length = input.int(20, title="Moving Average Length")
mult = input.float(1.5, title="Standard Deviation Multiplier")

// Calculate the moving average and standard deviation
ma = ta.sma(close, length)
dev = mult * ta.stdev(close, length)

// Calculate upper and lower bands
upper_band = ma + dev
lower_band = ma - dev

// Plot the moving average and bands
plot(ma, color=color.blue, linewidth=2, title="Moving Average")
plot(upper_band, color=color.red, linewidth=2, title="Upper Band")
plot(lower_band, color=color.green, linewidth=2, title="Lower Band")

// Entry conditions
long_condition = ta.crossover(close, lower_band)
short_condition = ta.crossunder(close, upper_band)

// Exit conditions
exit_long_condition = ta.crossunder(close, ma)
exit_short_condition = ta.crossover(close, ma)

// Strategy orders
if (long_condition)
    strategy.entry("Long", strategy.long)
if (short_condition)
    strategy.entry("Short", strategy.short)

if (exit_long_condition)
    strategy.close("Long")
if (exit_short_condition)
    strategy.close("Short")

// Plot signals on the chart
plotshape(series=long_condition, location=location.belowbar, color=color.green, style=shape.labelup, title="Buy Signal")
plotshape(series=short_condition, location=location.abovebar, color=color.red, style=shape.labeldown, title="Sell Signal")
Published by ChaoZhang on the FMZ strategy square · last modified 2024-06-17. Collected in the Quant Trading Vault. Unvalidated research: re-test with your own data and costs before trusting it.
Build this with AgenKit
A spec is not a trading system. Paste this into your coding agent and AgenKit runs a specialist team — architecture, test-first build, risk gates, review — with paper trading on by default.
/agenkit build a production-grade trading bot with a backtest engine, risk controls and paper trading by default from strategies/Mean-Reversion-Strategy.md- npx agenkit install engineering-kit in your project
- Paste the command into your agent and approve each phase
- Get tests, backtest, risk controls and a paper-trading switch
Understand it first
Before you run this, read the lesson behind the idea and how to backtest it honestly. Specs like this one are the survivors of an unknown number of trials; deflate their results accordingly.
Related specs
- Adaptive Trading Strategy Combining Dynamic Trend Reversal and Stochastic IndicatorPine Script · Mean reversion · 1d
- Advanced Momentum EMA Trend Following with RSI Overbought Oversold Trading StrategyPine Script · Mean reversion · 1d
- Advanced Quantitative Trend Following and Cloud Reversal Composite Trading StrategyPine Script · Mean reversion · 1d
- Advanced Strategy with Volume and Price Pullback Multiple Take ProfitPine Script · Mean reversion · 1h
- Bidirectional Moving Average Reversion Trading StrategyPine Script · Mean reversion · 1h
- Bollinger Bands ATR Risk Reward Trading StrategyPine Script · Mean reversion · 1d