Strategy vault / Mean reversion
Mean Reversion Trading Strategy Based on Bollinger Bands and Golden Ratio
This strategy uses the golden ratio line of Bollinger Bands combined with moving average formations to trade mean reversions. When the price touches the golden ratio line, it is considered a buy signal to take…
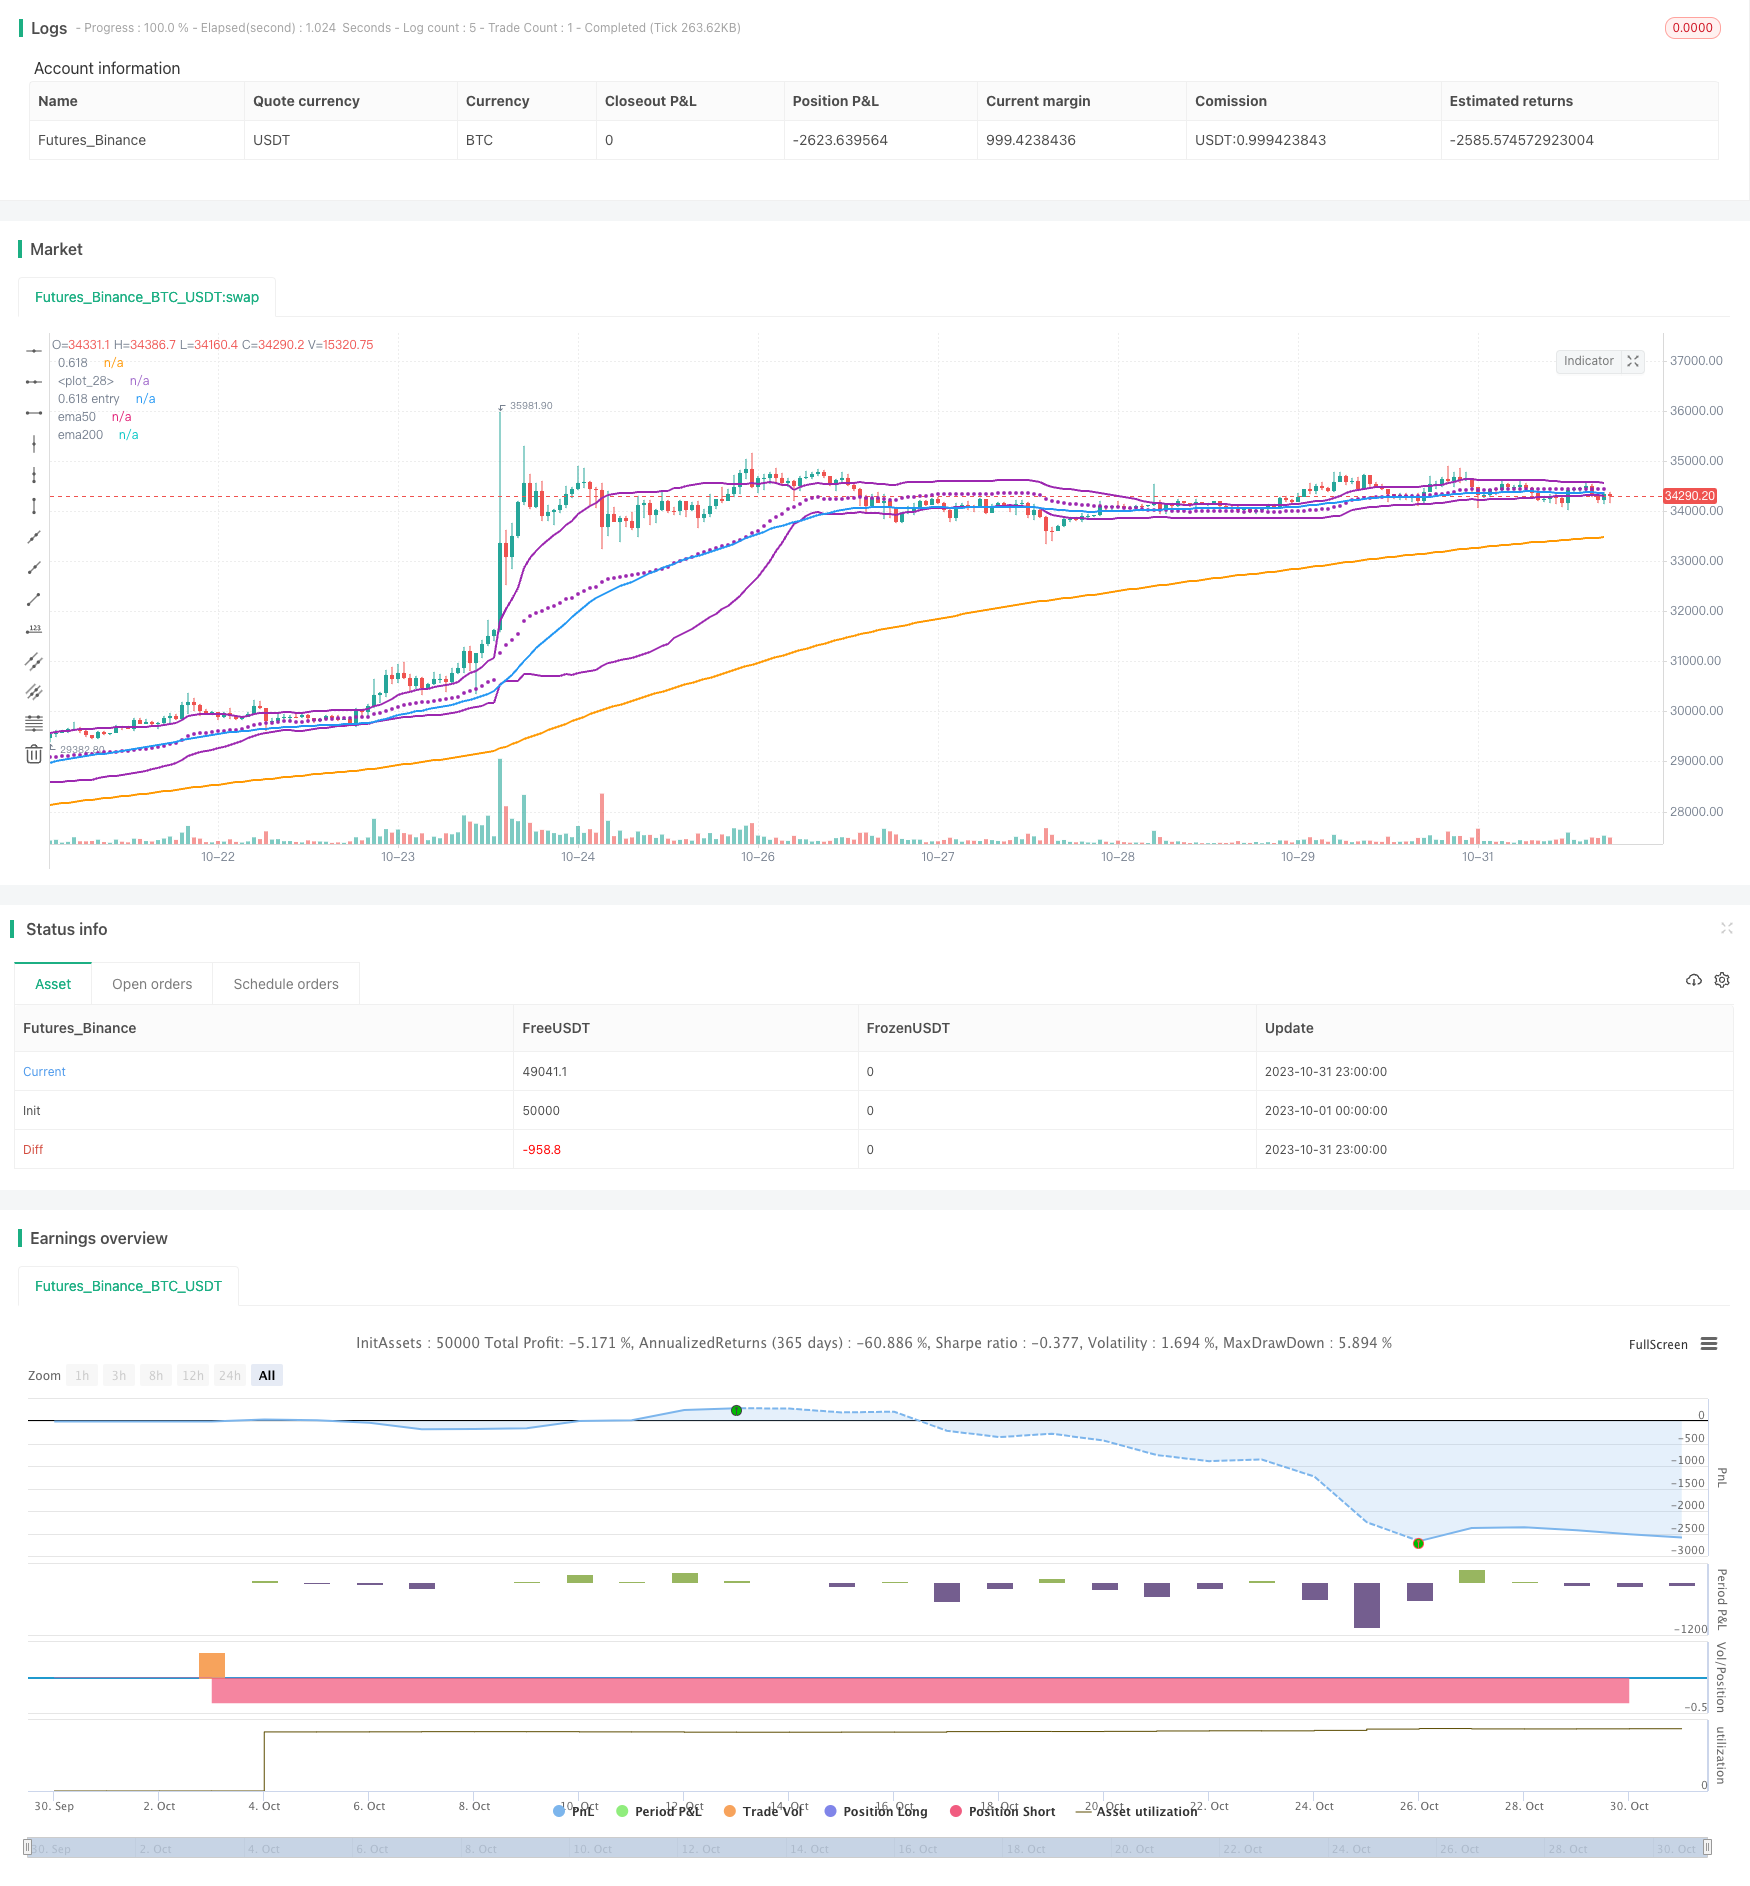
Overview
This strategy uses the golden ratio line of Bollinger Bands combined with moving average formations to trade mean reversions. When the price touches the golden ratio line, it is considered a buy signal to take advantage of the mean reverting tendency.
Strategy Logic
- Calculate Bollinger Bands middle band, upper band and golden ratio lower band
- Middle band: vwma of n periods
- Upper band: Middle band + k * n period standard deviation
- Golden ratio lower band: Middle band - 0.618 * n period standard deviation
- Judge formations
- 50-day MA above 200-day MA, indicates uptrend
- Price touches or below golden ratio lower band, as buy signal
- Exit
- When price breaks above BB upper band, price is considered to have moved away from lower band, close position
- Stop loss
- Set fixed percentage stop loss, e.g. 5%
Advantages
Using vwma instead of sma for BB middle line better reflects price movement
Golden ratio is important support/resistance, provides basis for reversion
MA in uptrend ensures overall trend is up
Fixed stop loss controls loss for each trade
Risks
Golden ratio line is not guaranteed support, price may break through
Fixed stop loss may be arbitrary, should consider adjusting based on volatility
MA uptrend may be false breakout, should check more indicators
Unsure of reversion length, need reasonable profit taking exit
Enhancement
Test different combinations of parameters like BB period, SD multiplier, fixed stop loss percentage etc.
Add more indicators to determine market trend and reversion probability, e.g. MACD, KD etc.
Consider dynamic stops, such as ATR or trailing stops
Optimize profit taking like moving profit stop, partial profit taking etc.
Summary
This strategy trades mean reversions using BB golden ratio line, with clear logic, simple parameters, and controllable drawdown. But also has risks, requires further testing and optimization, adding more technical indicators for trend and better stops/exits before actual use. Overall provides idea of using golden ratio in quant trading, worth exploring further.
Parameters
| Name | Default | What it controls |
|---|---|---|
| v_input_1 | 50 | BB Length |
| v_input_2_hlc3 | 0 | Source: hlc3 | high | low | open | hl2 | close | hlcc4 | ohlc4 |
| v_input_3 | 1.5 | multplier |
| v_input_4 | 5 | Stop Loss |
Source Pine Script
/*backtest
start: 2023-10-01 00:00:00
end: 2023-10-31 23:59:59
period: 1h
basePeriod: 15m
exchanges: [{"eid":"Futures_Binance","currency":"BTC_USDT"}]
*/

// This source code is subject to the terms of the Mozilla Public License 2.0 at https://mozilla.org/MPL/2.0/
// © mohanee

//@version=4

strategy(title="Bollinger Band with Fib Golden Ratio (0.618)",  shorttitle="Bollinger Band with Fib Golden Ratio" , overlay=true, pyramiding=1,     default_qty_type=strategy.percent_of_equity,  default_qty_value=20, initial_capital=10000, currency=currency.USD)

length = input(50,title="BB Length" , minval=1)
src1 = input(hlc3, title="Source")
//mult1 = input(1.33, minval=0.001, maxval=50)
mult = input(1.5,title="multplier", minval=0.001, maxval=50)

stopLoss=input(5,title="Stop Loss",minval=1)

basis = vwma(src1, length)
dev = mult * stdev(src1, length)

//dev3 = mult3 * stdev(src, length)

upper_618= basis + (0.618*dev)
lower_618= basis - (0.618*dev)

//lower_618_dev3= basis - (0.618*dev3)


plot_upper618= plot(upper_618, color=color.purple, linewidth=2, title="0.618")
plot(basis, color=color.purple,style=plot.style_circles,  linewidth=2)

plot_lower618= plot(lower_618, color=color.purple, linewidth=2, title="0.618 entry")
//plot_lower618_dev3= plot(lower_618_dev3, color=color.red, linewidth=1, title="0.618 stop")

//plot_lower618= plot(lower_618, color=color.purple, linewidth=1, title="0.618 entry")

ema200=ema(close,200)
ema50=ema(close,50)

plot (ema200, title="ema200", color=color.orange, linewidth=2)
plot (ema50, title="ema50", color=color.blue , linewidth=2)


longCondition= ema50 > ema200

strategy.entry(id="BB_Fib618", long=true, when = longCondition and ( close < lower_618  or  low <= lower_618)  )

strategy.close(id="BB_Fib618",  comment="points="+tostring(close - strategy.position_avg_price,  "###.##") , when = strategy.position_size >= 1  and crossover(close,upper_618 ))

//stoploss exit
stopLossVal = strategy.position_size>=1 ?  strategy.position_avg_price * ( 1 - (stopLoss/100) ) : 0.00
strategy.close(id="BB_Fib618", comment="SL="+tostring(close - strategy.position_avg_price,  "###.##"), when=abs(strategy.position_size)>=1 and close < stopLossVal ) //and close > strategy.position_avg_price )
Published by ChaoZhang on the FMZ strategy square · last modified 2023-11-16. Collected in the Quant Trading Vault. Unvalidated research: re-test with your own data and costs before trusting it.
Build this with AgenKit
A spec is not a trading system. Paste this into your coding agent and AgenKit runs a specialist team — architecture, test-first build, risk gates, review — with paper trading on by default.
/agenkit build a production-grade trading bot with a backtest engine, risk controls and paper trading by default from strategies/Mean-Reversion-Trading-Strategy-Based-on-Bollinger-Bands-and-Golden-Ratio.md- npx agenkit install engineering-kit in your project
- Paste the command into your agent and approve each phase
- Get tests, backtest, risk controls and a paper-trading switch
Understand it first
Before you run this, read the lesson behind the idea and how to backtest it honestly. Specs like this one are the survivors of an unknown number of trials; deflate their results accordingly.
Related specs
- Multi Timeframe Gold Reversal Tracking StrategyPine Script · Mean reversion · 2h
- MACD RSI and EMA StrategyPine Script · Mean reversion · 1d
- CCTBBO Reversal Tracking StrategyPine Script · Mean reversion · 45m
- Bollinger Bands Trend Reversal StrategyPine Script · Mean reversion · 10m
- Dual Channel Tracking Reversal StrategyPine Script · Mean reversion · 1h
- Multi Indicator Synergistic Trading Strategy with Bollinger Bands Fibonacci MACD and RSIPine Script · Mean reversion · 2h