Momentum and Money Flow Crossroad Cashing Strategy
This is a reactive trading strategy that combines the Stochastic oscillator and Chaikin Money Flow (CMF) indicator to capitalize on momentum shifts in the market. The strategy ingeniously harmonizes two potent…
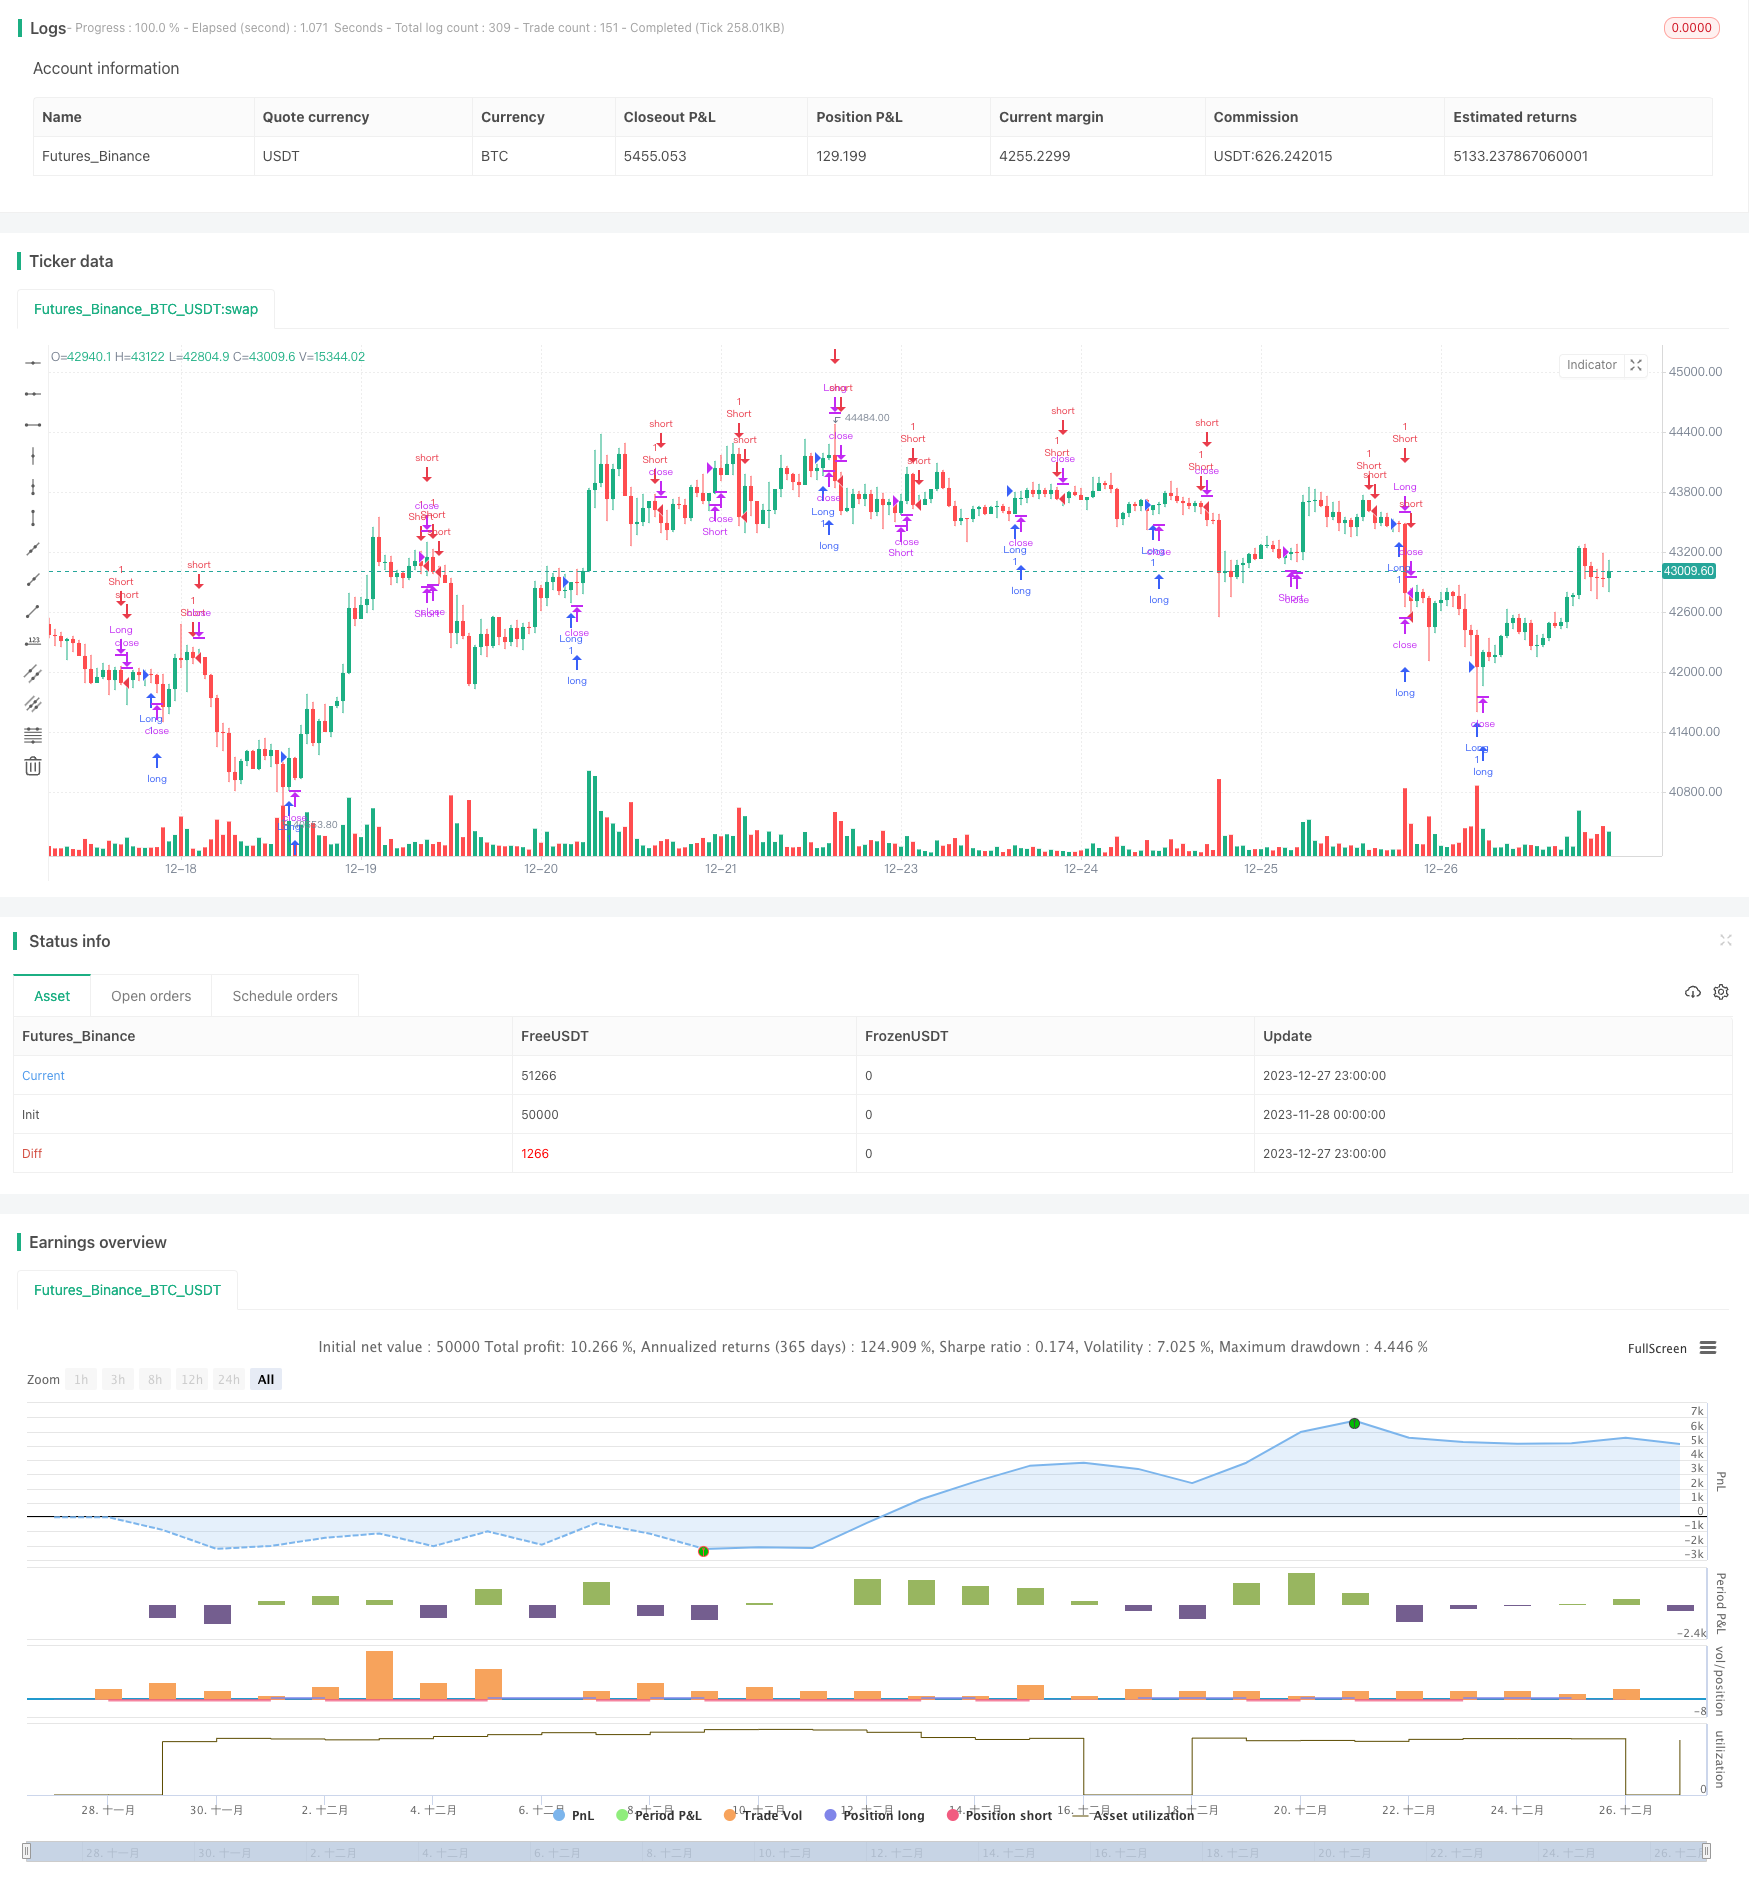
Overview
This is a reactive trading strategy that combines the Stochastic oscillator and Chaikin Money Flow (CMF) indicator to capitalize on momentum shifts in the market. The strategy ingeniously harmonizes two potent indicators – the Stochastic oscillator and CMF indicator – to provide clear entry and exit signals.
Strategy Logic
The Stochastic oscillator is a momentum indicator that measures the relative position of the closing price to the high-low range over a defined lookback period. In this strategy, parameters like %K Length, %K Smoothing and %D Smoothing can be customized to fine-tune the sensitivity of the Stochastic oscillator to market fluctuations.
On the other hand, the Chaikin Money Flow (CMF) indicator is a volume-weighted average oscillator designed to measure the flow of money into and out of a security over a specified timeframe. The Length parameter can be adjusted to change the lookback period for CMF calculation.
Here is how the strategy works:
A long position is initiated when the Stochastic %K line crosses above the %D line (a bullish crossover) and the CMF value is greater than 0.1, indicating positive money flow and upward potential momentum.
Conversely, a short position is initiated when the Stochastic %K line crosses below the %D line (a bearish crossover) and the CMF value is less than 0.08, signalling negative money flow and potential downward momentum.
Positions are exited based on a set of predefined conditions to protect profits and minimize losses. Long positions are closed when a bearish crossover occurs on the Stochastic oscillator and the CMF value falls below -0.1. Short positions are closed when a bullish crossover occurs on the Stochastic oscillator and the CMF value rises above 0.06.
Advantages of the Strategy
This strategy artfully blends momentum and volume analysis to offer traders a comprehensive view of market conditions, thereby facilitating informed trading decisions. Its customizable input settings also allow better adaptations to varying market environments and individual trading preferences.
Specifically, the main advantages of this strategy are:
Combining the robust Stochastic oscillator and CMF indicator can more accurately determine market trends and spot inflection points.
The flexible entry and exit mechanisms maximize profits while controlling risks.
Customizable parameter settings allow optimizations across different products.
The built-in stop loss/take profit controls help protect realized profits.
Risks and Hedging
Despite its advantages, some risks in trading still exist with this strategy:
Incorrect indicator parameters may lead to missing opportunities or unnecessary losses. Proper testing and optimization across markets is a must.
Extreme price swings from black swan events may trigger stop loss or produce false signals. Using loose stop loss and validating signals is necessary.
The strategy relies on technical indicators and cannot adapt to fundamental shifts and extreme moves. Combining fundamental analysis is required to reduce risks.
The risks can be mitigated through:
Thorough backtesting and optimization of parameters in simulated environments.
Setting loose stop loss, adding profit taking mechanisms.
Combining with other types of systems for signal confirmation, avoiding reliance on single indicators.
Optimization Directions
Significant room remains for optimizing this strategy:
Using machine learning or genetic algorithms to auto-optimize parameters for dynamic adaptivity.
Adding model evaluation modules for real-time tracking and assessment of strategy performance.
Incorporating more indicator types like volatility measures, volume signatures to build more robust models.
Implementing adaptive stop loss/take profit mechanisms based on market volatility.
Leveraging deep learning to develop auto-feature engineering alpha models that do not rely on prescribed indicators, enhancing stability.
Conclusion
This strategy employs the Stochastic oscillator and Chaikin Money Flow indicator to design a quantitative trading system incorporating both price momentum and money flow analysis. This multi-indicator approach provides more accurate assessments of market structure compared to single indicators. Detailed entry/exit rules and highly-customizable settings balance its profit capturing and risk control capabilities. Nonetheless, inherent market risks still exist in such rule-based models. Further optimizations by incorporating more data sources and techniques are necessary for robust adaptations to increasingly complex and dynamic trading landscapes.
Parameters
| Name | Default | What it controls |
|---|---|---|
| v_input_int_1 | 20 | %K Length |
| v_input_int_2 | true | %K Smoothing |
| v_input_int_3 | 3 | %D Smoothing |
| v_input_int_4 | 10 | Length |
Source Pine Script
/*backtest
start: 2023-11-28 00:00:00
end: 2023-12-28 00:00:00
period: 1h
basePeriod: 15m
exchanges: [{"eid":"Futures_Binance","currency":"BTC_USDT"}]
*/

// This source code is subject to the terms of the Mozilla Public License 2.0 at https://mozilla.org/MPL/2.0/
// © jawauntb

//@version=5
strategy("Stochastic and CMF Strategy", overlay=true)

// Stochastic Indicator
periodK = input.int(20, " %K Length", minval=1)
smoothK = input.int(1, "%K Smoothing", minval=1)
periodD = input.int(3, "%D Smoothing", minval=1)
k = ta.sma(ta.stoch(close, high, low, periodK), smoothK)
d = ta.sma(k, periodD)

// Chaikin Money Flow Indicator
length = input.int(10, "Length", minval=1)
ad = close == high and close == low or high == low ? 0 : ((2 * close - low - high) / (high - low)) * volume

sumAd = 0.0
sumVolume = 0.0
for i = 0 to length - 1
    sumAd := sumAd + ad[i]
    sumVolume := sumVolume + volume[i]

mf = sumAd / sumVolume

// Define conditions for entering a long or short position
enterLong = ta.crossover(k, d) and mf > 0.1
enterShort = ta.crossunder(k, d) and mf < 0.08

// Define conditions for exiting a position
exitLong = ta.crossunder(k, d) and mf < -0.1
exitShort = ta.crossover(k, d) and mf > 0.06

// Execute trades based on the conditions
strategy.entry("Long", strategy.long, when=enterLong)
strategy.close("Long", when=exitLong)
strategy.entry("Short", strategy.short, when=enterShort)
strategy.close("Short", when=exitShort)
Published by ChaoZhang on the FMZ strategy square · last modified 2023-12-29. Collected in the Quant Trading Vault. Unvalidated research: re-test with your own data and costs before trusting it.
Build this with AgenKit
A spec is not a trading system. Paste this into your coding agent and AgenKit runs a specialist team — architecture, test-first build, risk gates, review — with paper trading on by default.
/agenkit build a production-grade trading bot with a backtest engine, risk controls and paper trading by default from strategies/Momentum-and-Money-Flow-Crossroad-Cashing-Strategy.md- npx agenkit install engineering-kit in your project
- Paste the command into your agent and approve each phase
- Get tests, backtest, risk controls and a paper-trading switch
Understand it first
Before you run this, read the lesson behind the idea and how to backtest it honestly. Specs like this one are the survivors of an unknown number of trials; deflate their results accordingly.
Related specs
- Momentum Trend Following SuperTrend and Stochastic Crossover StrategyPine Script · Momentum · 2d
- MoonFlag MACD Momentum StochRSI Trading StrategyPine Script · Momentum · 1d
- Multi EMA Trend Momentum Trading Strategy with Risk Management SystemPine Script · Momentum · 1h
- Multi Indicator Probability Threshold Momentum Trend Trading StrategyPine Script · Momentum · 1d
- Multi factor Adaptive Momentum Tracking StrategyPine Script · Momentum · 3m
- Pivot and Momentum StrategyPine Script · Momentum · 1d