Momentum and SuperTrend Combination Trading Strategy
The strategy is named "Momentum and SuperTrend Combination Trading Strategy". The main idea of this strategy is to combine the Momentum indicator with the SuperTrend indicator to take advantage of both indicators for…
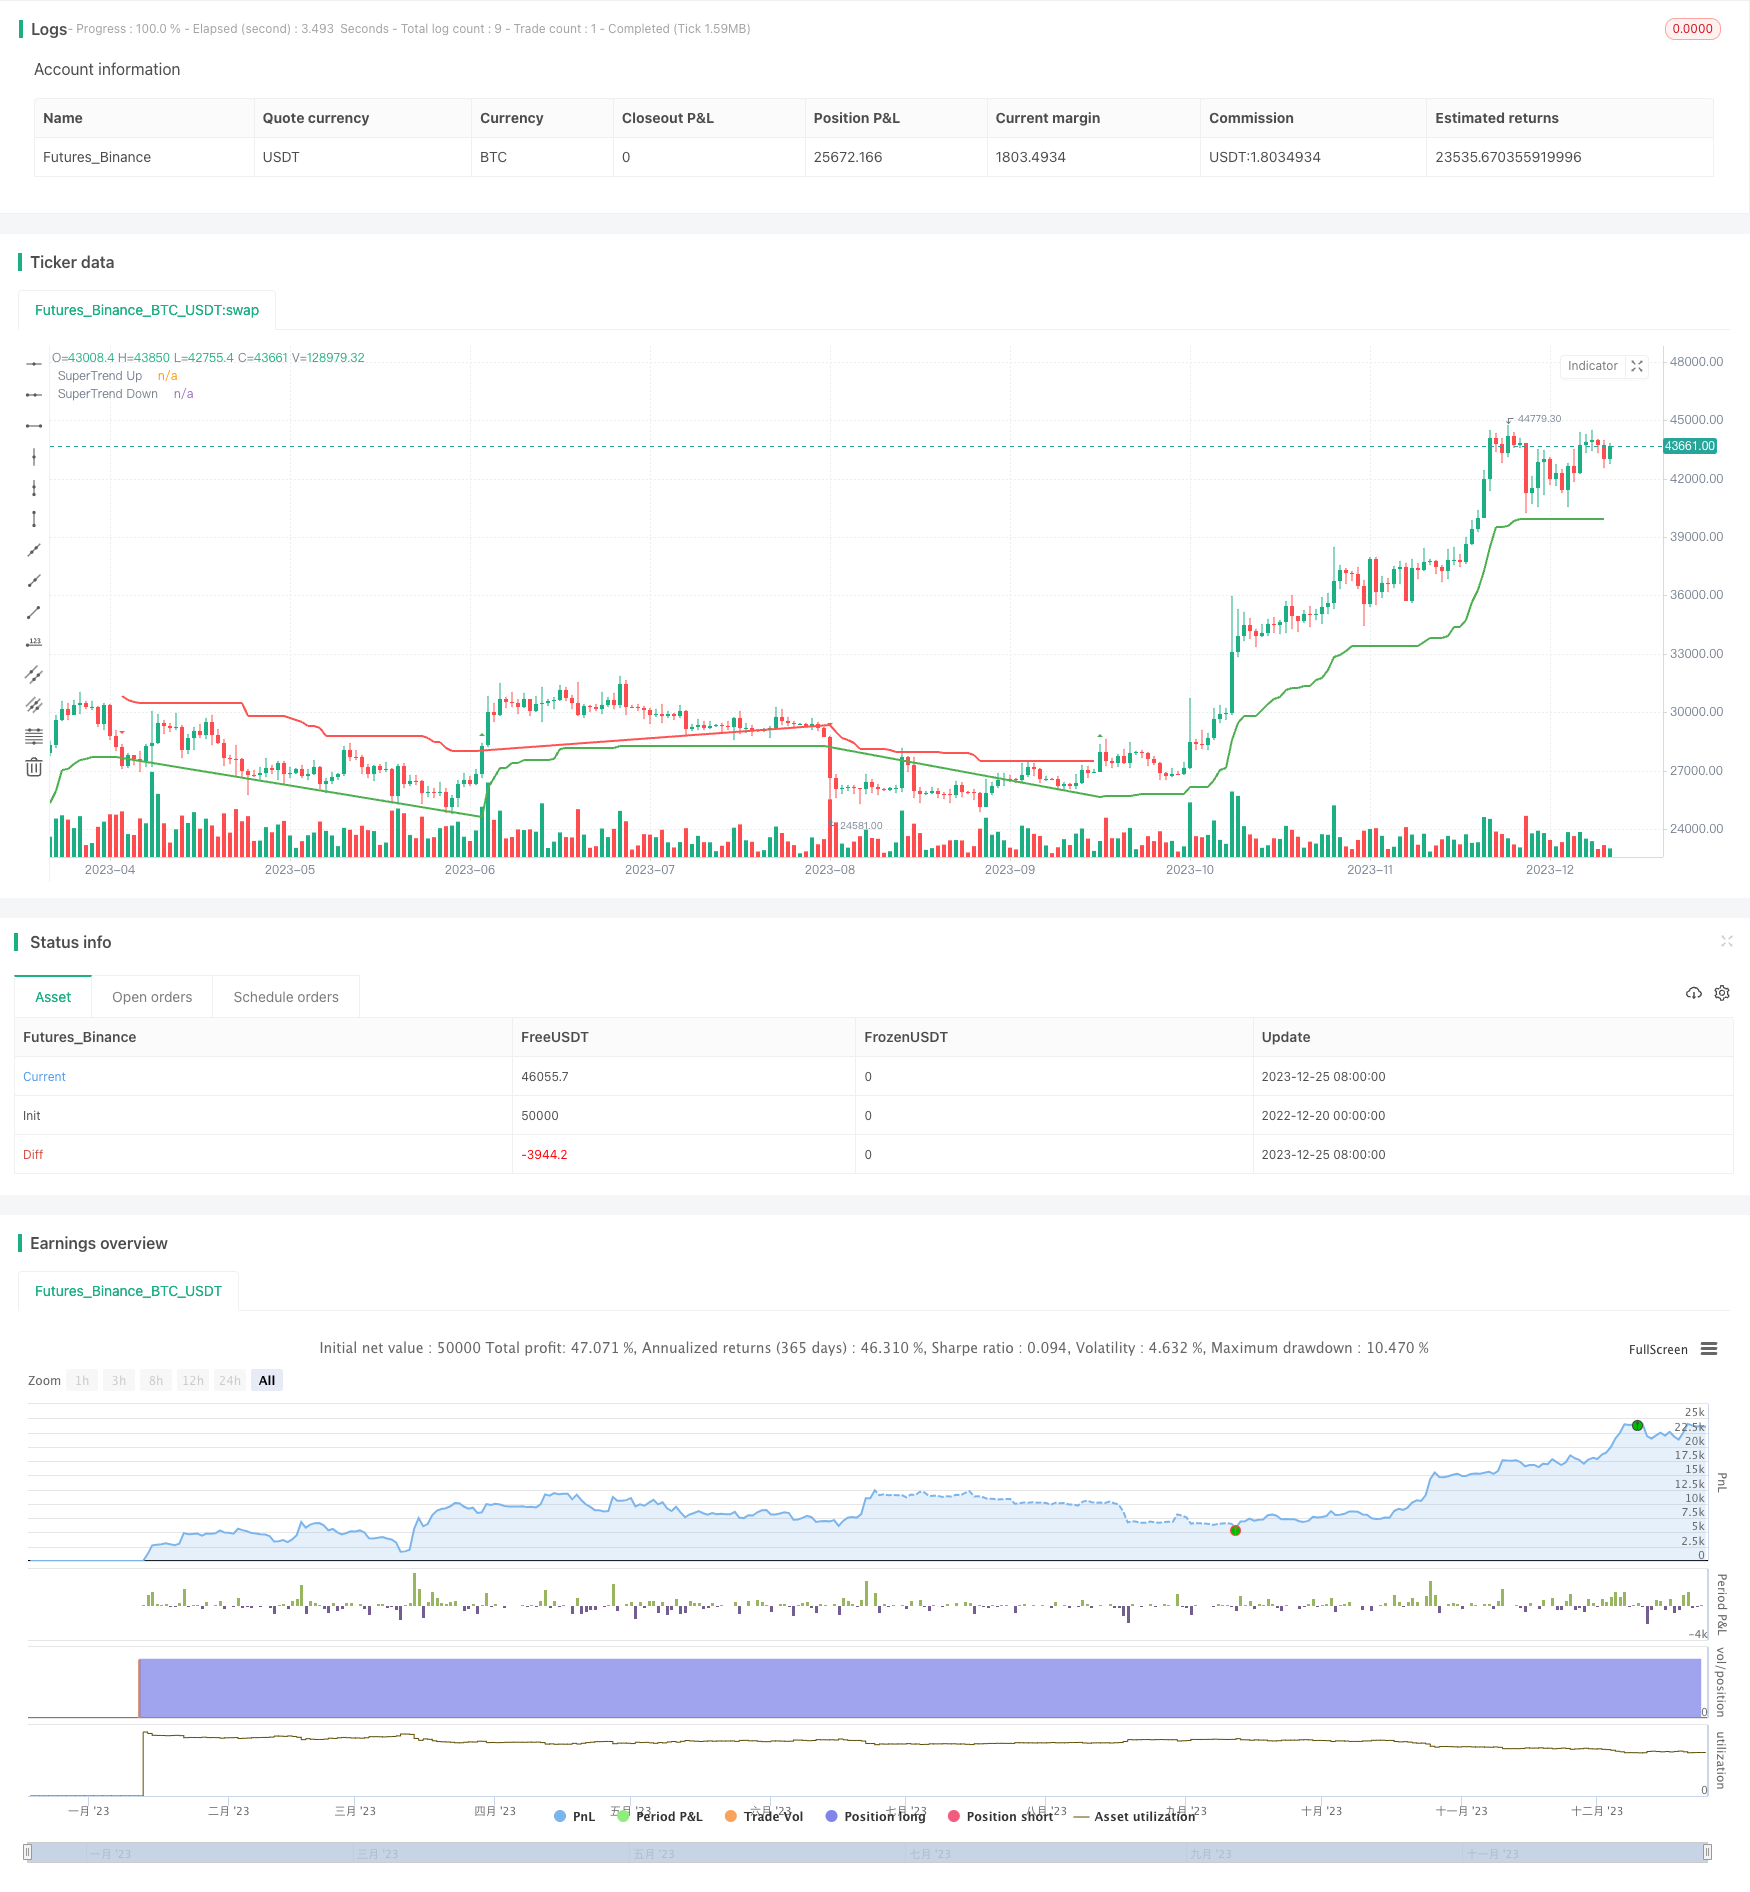
1. Strategy Overview
The strategy is named "Momentum and SuperTrend Combination Trading Strategy". The main idea of this strategy is to combine the Momentum indicator with the SuperTrend indicator to take advantage of both indicators for more accurate Entries and Exits.
Specifically, the Momentum indicator is used to judge the acceleration or deceleration of price movements and changes in trends. SuperTrend is used to judge whether prices break through upward or downward channels and changes in trends. The combination of the two can more accurately capture trend reversal points.
2. Detailed Strategy Principle
Momentum indicator part
Calculate the N-day momentum value of the price and calculate the 1-day momentum of the momentum value. When N-day momentum > 0 and 1-day momentum > 0, it is a long signal; when N-day momentum < 0 and 1-day momentum < 0, it is a short signal.
SuperTrend indicator part
Calculate the ATR value of the price, and draw the upward channel line and downward channel line based on ATR. When the price breaks through the upward channel from the bottom, it is a long signal, and when the price breaks through the downward channel from the top, it is a short signal.
Entry logic
Take the AND operation of the long signal from the momentum indicator and the long signal from the SuperTrend to generate the final long entry signal when both happen at the same time; Take the AND operation of the short signal from the momentum indicator and the short signal from the SuperTrend to generate the final short entry signal when both happen at the same time.
3. Advantage Analysis
Use momentum indicators to determine acceleration or deceleration of price movements to capture trend reversal points.
Use SuperTrend indicators to determine price breakthrough channels to capture breakthrough points.
Mutual verification of two types of indicators can reduce false signals and improve the accuracy of Entries.
The combination of Exit logic of the two indicators enables trend tracking exit to avoid premature exit.
4. Risk Analysis
Improper parameter setting of N-day momentum indicator may miss trend reversal points.
Improper parameter setting of SuperTrend may lead to inaccurate channel drawing and false signals.
Mutual verification of the two indicators may miss some opportunities.
Parameters combination should be adjusted to find the optimal parameter pair to maximize the potential of the strategy.
Corresponding solutions:
Use walk-forward analysis to find the optimal parameters.
Add parameter optimization module for real-time parameter optimization.
Adjust the combination logic of the two indicators and consider comprehensively.
5. Optimization Directions
Add adaptive parameter optimization module for real-time adjustment according to market conditions
Add machine learning model to assist in judging the accuracy of indicator signals
Expand more indicators to form an indicator set, and use voting mechanism to generate entry signals
Use deep learning models instead of traditional indicators for data-driven judgments of entry and exit timing
6. Summary
This strategy combines the strengths of Momentum and SuperTrend indicators through double verification to improve the accuracy of Entries, and uses indicators to judge the timing of Exits. Compared to the single use of indicators, it can reduce false signals and achieve higher win rates. Through parameter optimization, machine learning and other technologies extension, there is still room for further improvement of strategy effectiveness and it deserves in-depth research and application.
Parameters
| Name | Default | What it controls |
|---|---|---|
| v_input_1 | 12 | length |
| v_input_2 | 10 | Periods |
| v_input_3 | 3 | Multiplier |
| v_input_4 | true | changeATR |
| v_input_5_hl2 | 0 | src: hl2 | high | low | open | close | hlc3 | hlcc4 | ohlc4 |
Source Pine Script
/*backtest
start: 2022-12-20 00:00:00
end: 2023-12-26 00:00:00
period: 1d
basePeriod: 1h
exchanges: [{"eid":"Futures_Binance","currency":"BTC_USDT"}]
*/

//@version=4
strategy("Momentum + SuperTrend Strategy", overlay=true)

// Momentum Strategy
length = input(12)
price = close
momentum(seria, length) =>
    mom = seria - seria[length]
    mom
mom0 = momentum(price, length)
mom1 = momentum(mom0, 1)
momLongCondition = mom0 > 0 and mom1 > 0
momShortCondition = mom0 < 0 and mom1 < 0

// SuperTrend Strategy
Periods = input(10)
Multiplier = input(3.0)
changeATR = input(true)
src = input(hl2)
atr2 = sma(tr, Periods)
atr = changeATR ? atr(Periods) : atr2
up = src - (Multiplier * atr)
up1 = nz(up[1], up)
up := close[1] > up1 ? max(up, up1) : up
dn = src + (Multiplier * atr)
dn1 = nz(dn[1], dn)
dn := close[1] < dn1 ? min(dn, dn1) : dn
trend = 1
trend := nz(trend[1], trend)
trend := trend == -1 and close > dn1 ? 1 : trend == 1 and close < up1 ? -1 : trend
buySignal = trend == 1 and trend[1] == -1
sellSignal = trend == -1 and trend[1] == 1

// Combined Entry Conditions
longCondition = momLongCondition and buySignal
shortCondition = momShortCondition and sellSignal

// Strategy Entries
if (longCondition)
    strategy.entry("MomLE", strategy.long, stop=high+syminfo.mintick, comment="MomLE")
else
    strategy.cancel("MomLE")

if (shortCondition)
    strategy.entry("MomSE", strategy.short, stop=low-syminfo.mintick, comment="MomSE")
else
    strategy.cancel("MomSE")

// Plot SuperTrend on the chart
upPlot = plot(trend == 1 ? up : na, title="SuperTrend Up", color=color.green, linewidth=2)
dnPlot = plot(trend == -1 ? dn : na, title="SuperTrend Down", color=color.red, linewidth=2)

// Highlight the SuperTrend region
fill(upPlot, dnPlot, color = trend == 1 ? color.new(color.green, 90) : color.new(color.red, 90), title="SuperTrend Highlight")

// Plot SuperTrend Buy/Sell signals on the chart
plotshape(series=buySignal, title="SuperTrend Buy Signal", color=color.green, style=shape.triangleup, size=size.small)
plotshape(series=sellSignal, title="SuperTrend Sell Signal", color=color.red, style=shape.triangledown, size=size.small)
// This Pine Script™ code is subject to the terms of the Mozilla Public License 2.0 at https://mozilla.org/MPL/2.0/
// © naveen1119Published by ChaoZhang on the FMZ strategy square · last modified 2023-12-27. Collected in the Quant Trading Vault. Unvalidated research: re-test with your own data and costs before trusting it.
Build this with AgenKit
A spec is not a trading system. Paste this into your coding agent and AgenKit runs a specialist team — architecture, test-first build, risk gates, review — with paper trading on by default.
/agenkit build a production-grade trading bot with a backtest engine, risk controls and paper trading by default from strategies/Momentum-and-SuperTrend-Combination-Trading-Strategy.md- npx agenkit install engineering-kit in your project
- Paste the command into your agent and approve each phase
- Get tests, backtest, risk controls and a paper-trading switch
Understand it first
Before you run this, read the lesson behind the idea and how to backtest it honestly. Specs like this one are the survivors of an unknown number of trials; deflate their results accordingly.
Related specs
- Momentum Trend Following SuperTrend and Stochastic Crossover StrategyPine Script · Momentum · 2d
- Moving Average Candle Regression StrategyPine Script · Momentum · 15m
- Adaptive Momentum Trading Strategy with SMA Crossover and SuperTrendPine Script · Momentum · 2h
- Dynamic Position Sizing Strategy Based on Equity CurvePine Script · Momentum · 3m
- The Momentum Tracking and Trend StrategyPine Script · Momentum · 1d
- Trend Following Strategy Based on Support Resistance and Momentum Indicators Across Multiple TimeframesPine Script · Momentum · 1d