Momentum Breakdown MACD Strategy
The Momentum Breakdown MACD strategy mainly utilizes the combination of the MACD indicator and the Momentum indicator to generate trading signals, belonging to a trend-following strategy. This strategy first…
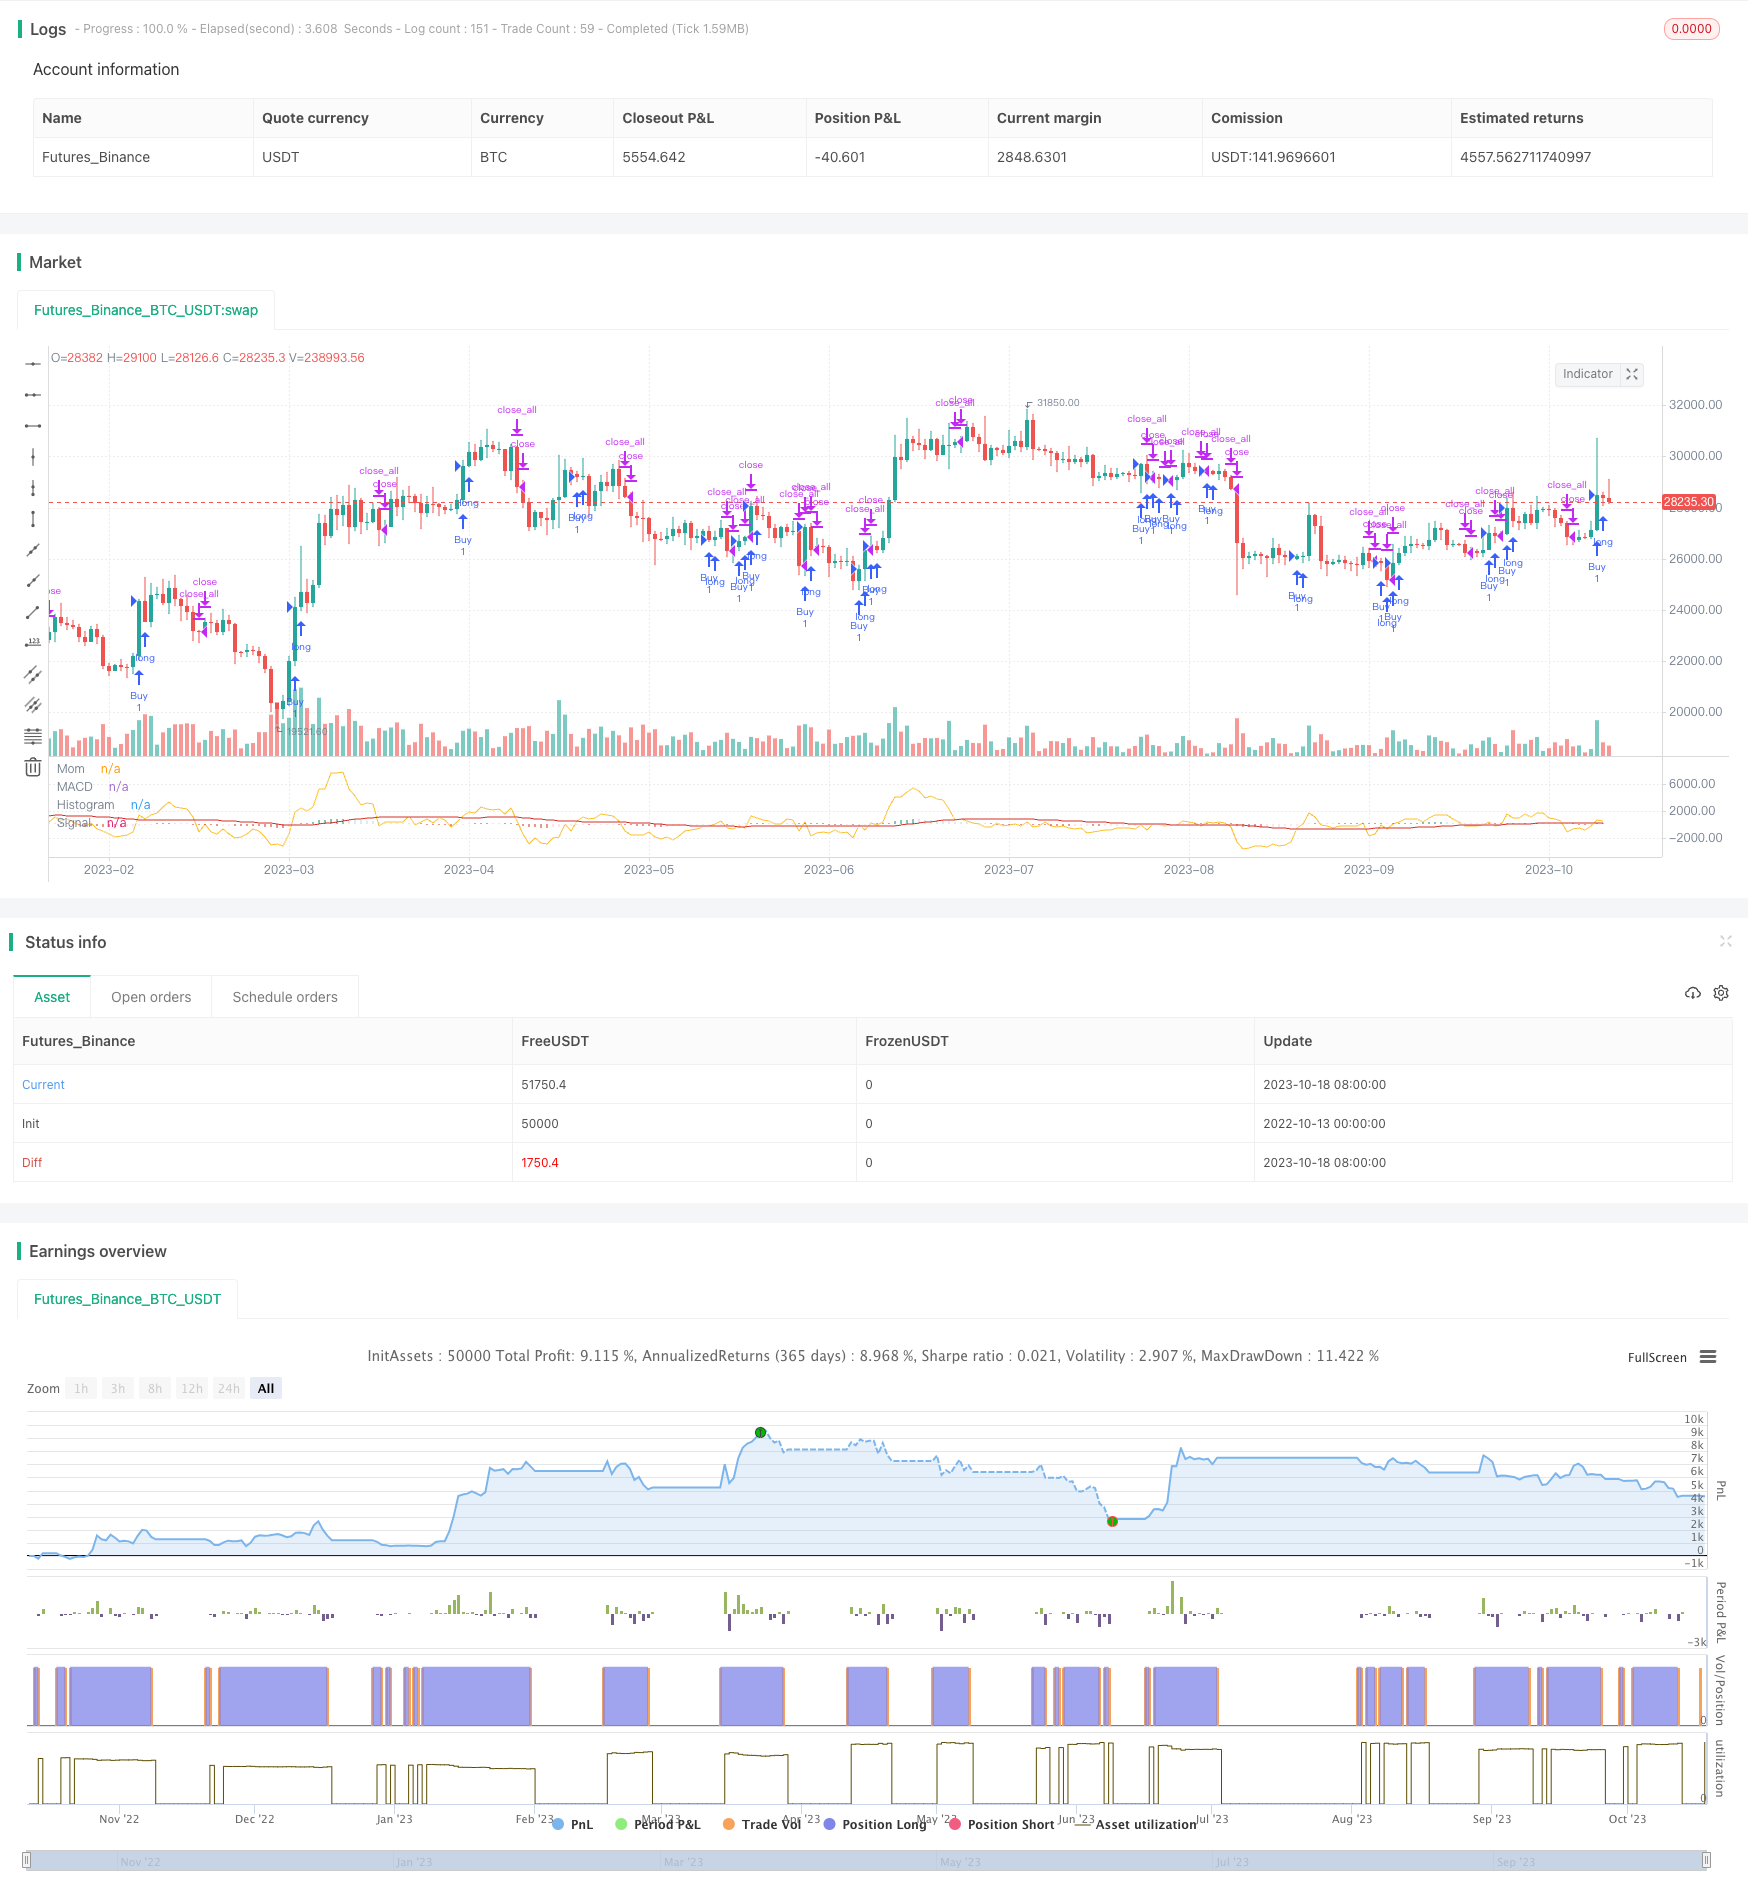
Overview
The Momentum Breakdown MACD strategy mainly utilizes the combination of the MACD indicator and the Momentum indicator to generate trading signals, belonging to a trend-following strategy. This strategy first calculates the fast EMA and slow EMA, then computes the MACD value, and further calculates the signal line of MACD. At the same time, it calculates the momentum value of price. When the momentum value crosses above the zero level together with the MACD difference, it generates a buy signal. When the momentum value crosses below the zero level together with the MACD difference, it generates a sell signal. This belongs to a double confirmation mechanism to produce trading signals.
Strategy Logic
This strategy is mainly based on the combination of MACD and Momentum indicators.
The MACD indicator is a trend-following indicator, consisting of the fast EMA, slow EMA, and MACD histogram. The fast EMA usually has a parameter of 12 days, and the slow EMA has a parameter of 26 days. The calculation formulas are:
Fast EMA = EMA(close price, 12)
Slow EMA = EMA(close price, 26)
MACD = Fast EMA - Slow EMA
Signal Line = EMA(MACD, 9)
When the fast EMA crosses above the slow EMA, it means the short-term uptrend is stronger than the long-term trend, which is a buy signal. When the fast EMA crosses below the slow EMA, it means the long-term downtrend is stronger than the short-term trend, which is a sell signal.
The Momentum indicator reflects the speed of price movement, and its calculation formula is:
Momentum = Today's closing price - Closing price N days ago
Where N is usually set to 10. When today's closing price rises above that of N days ago, the momentum value is positive, indicating an uptrend. When today's closing price falls below that of N days ago, the momentum value is negative, indicating a downtrend.
This strategy combines the MACD indicator with the Momentum indicator. The criteria for generating trading signals is: when the difference between the MACD difference and the momentum difference crosses above the zero level, it generates a buy signal, forming an above-zero crossover. When the difference crosses below the zero level, it generates a sell signal, forming a below-zero crossover. This belongs to a dual confirmation mechanism for producing trading signals, which can filter out some false signals and achieve trend following.
Advantage Analysis
The advantages of this strategy include:
The combination of the MACD and Momentum indicators achieves trend following, avoiding ineffective trading when the asset price just oscillates without a clear direction.
Based on the dual confirmation mechanism, it can filter out some noise and avoid interference from false signals.
The MACD parameters are adjustable, which can be optimized for different products and trading cycles, making it highly adaptable.
It adopts both buy and sell trading mechanisms to capture trends in both directions.
The strategy is easy to understand with fewer parameters, suitable for beginners to learn.
Risk Analysis
This strategy also has some risks:
Both the MACD and Momentum belong to trend-following indicators. They may generate more inefficient trading when the market sees violent fluctuations or lacks a clear trend.
Although the dual indicator combination can filter out false signals, it may also miss some trading opportunities. Parameters should be adjusted to balance the risk.
When major cycle trends reverse, the MACD indicator may lag, leading to trading losses.
The trading frequency may be high, requiring attention to capital management and commission control.
Improper parameters may lead to too much sensitivity or lagging. Constant testing and optimization are needed based on market conditions.
Optimization Directions
The strategy can be optimized in the following aspects:
Optimize the MACD parameters to find the best parameter combination for different trading products and cycles.
Optimize the period parameter of the Momentum indicator to balance sensitivity and noise filtering.
Add stop loss mechanisms to control maximum loss per trade.
Add position management modules to scale the trade size along the trend.
Add filters like the ATR indicator to avoid wrong trades in choppy markets.
Incorporate other indicators like Bollinger Bands and RSI to form multi-confirmation trading signals.
Add optimization loops for continuous parameters iteration and optimization.
Summary
The Momentum Breakdown MACD strategy implements trend-following trading using the strengths of the MACD and Momentum indicators. Its dual confirmation mechanism can effectively filter out market noise and avoid inefficient trading. This strategy is relatively simple and easy to understand, especially suitable for beginners. But the lagging of the MACD and the risk of inefficient trading during range-bound markets should be noted. The strategy can be made more robust by continuously optimizing parameters and incorporating auxiliary technical indicators.
Parameters
| Name | Default | What it controls |
|---|---|---|
| v_input_1 | 12 | Fast Length |
| v_input_2 | 26 | Slow Length |
| v_input_3 | 10 | Momentum |
| v_input_4_close | 0 | Source MACD: close | high | low | open | hl2 | hlc3 | hlcc4 | ohlc4 |
| v_input_5_close | 0 | Source MOMENTUM: close | high | low | open | hl2 | hlc3 | hlcc4 | ohlc4 |
| v_input_6 | 14 | Signal Smoothing |
| v_input_7 | false | Simple MA(Oscillator) |
| v_input_8 | false | Simple MA(Signal Line) |
| v_input_9 | 2001 | From Year |
| v_input_10 | true | From Month |
| v_input_11 | true | From Day |
| v_input_12 | 9999 | To Year |
| v_input_13 | 12 | To Month |
| v_input_14 | 31 | To Day |
Source Pine Script
/*backtest
start: 2022-10-13 00:00:00
end: 2023-10-19 00:00:00
period: 1d
basePeriod: 1h
exchanges: [{"eid":"Futures_Binance","currency":"BTC_USDT"}]
*/

//@version=4
strategy(title="MACD MOMENTUM TEST", shorttitle="MACD MOM TEST")

// Getting inputs
fast_length = input(title="Fast Length", type=input.integer, defval=12)
slow_length = input(title="Slow Length", type=input.integer, defval=26)
len = input(title="Momentum", type=input.integer, defval=10)
src1 = input(title="Source MACD", type=input.source, defval=close)
src2 = input(title="Source MOMENTUM", type=input.source, defval=close)
signal_length = input(title="Signal Smoothing", type=input.integer, minval = 1, maxval = 50, defval = 14)
sma_source = input(title="Simple MA(Oscillator)", type=input.bool, defval=false)
sma_signal = input(title="Simple MA(Signal Line)", type=input.bool, defval=false)

// Plot colors
col_grow_above = #0c8e61
col_grow_below = #ffcdd2
col_fall_above = #b2dfdb
col_fall_below = #d42f28
col_macd = #ffffff
col_signal = #d42f28
col_mom = #fbc02d

// Calculating
fast_ma = sma_source ? sma(src1, fast_length) : ema(src1, fast_length)
slow_ma = sma_source ? sma(src1, slow_length) : ema(src1, slow_length)
macd = fast_ma - slow_ma
signal = sma_signal ? sma(macd, signal_length) : ema(macd, signal_length)
hist = macd - signal
mom = src2 - src2[len]


ma(s,l) => ema(s,l)
sema = ma( src1, fast_length )
lema = ma( src1, slow_length )
i1 = sema + mom + ma( src1 - sema, fast_length )
i2 = lema + mom + ma( src1 - lema, slow_length )
macdl = i1 - i2
macd1 =sema - lema

delta = mom - macd1

// Strategy
    // Backtest
FromYear  = input(defval = 2001, title = "From Year", minval = 2009)
FromMonth = input(defval = 1, title = "From Month", minval = 1, maxval = 12)
FromDay   = input(defval = 1, title = "From Day", minval = 1, maxval = 31)
ToYear    = input(defval = 9999, title = "To Year", minval = 2009)
ToMonth   = input(defval = 12, title = "To Month", minval = 1, maxval = 12)
ToDay     = input(defval = 31, title = "To Day", minval = 1, maxval = 31)

    // Function exampel
start     = timestamp(FromYear, FromMonth, FromDay, 00, 00)  // backtest start window
finish    = timestamp(ToYear, ToMonth, ToDay, 23, 59)        // backtest finish window
window()  => time >= start and time <= finish ? true : false // create function "within window of time"

if (crossover(delta, 0))
    strategy.entry("Buy", true, when=window(), comment="Buy")

if (crossunder(delta, 0))
    strategy.close_all(when=window())

// Plot
//plot(strategy.equity, title="equity", color=red, linewidth=2, style=areabr)
plot(hist, title="Histogram", style=plot.style_histogram, color=(hist>=0 ? (hist[1] < hist ? col_grow_above : col_fall_above) : (hist[1] < hist ? col_grow_below : col_fall_below) ), transp=0 )
plot(macd, title="MACD", color=col_macd, transp=0)
plot(signal, title="Signal", color=col_signal, transp=0)
plot(mom, color=col_mom, title="Mom")
Published by ChaoZhang on the FMZ strategy square · last modified 2023-10-20. Collected in the Quant Trading Vault. Unvalidated research: re-test with your own data and costs before trusting it.
Build this with AgenKit
A spec is not a trading system. Paste this into your coding agent and AgenKit runs a specialist team — architecture, test-first build, risk gates, review — with paper trading on by default.
/agenkit build a production-grade trading bot with a backtest engine, risk controls and paper trading by default from strategies/Momentum-Breakdown-MACD-Strategy.md- npx agenkit install engineering-kit in your project
- Paste the command into your agent and approve each phase
- Get tests, backtest, risk controls and a paper-trading switch
Understand it first
Before you run this, read the lesson behind the idea and how to backtest it honestly. Specs like this one are the survivors of an unknown number of trials; deflate their results accordingly.
Related specs
- KST EMA Momentum Trend Following StrategyPine Script · Momentum · 1d
- MACD Momentum Indicator Backtest StrategyPine Script · Momentum · 1h
- MACD of Relative Strength StrategyPine Script · Momentum · 1d
- MoonFlag MACD Momentum StochRSI Trading StrategyPine Script · Momentum · 1d
- Multi Indicator Trend Momentum Trading Strategy with Dynamic Risk Management SystemPine Script · Momentum · 1h
- Multi Level Technical Indicator Momentum Trading Strategy Based on Enhanced MACD Volume Strength and EMA Signal SystemPine Script · Momentum · 1h