Momentum Breakout Trading Strategy 440531
This is a momentum-based trend following breakout trading strategy. It calculates the highest and lowest prices over a certain period to determine the trend direction, and enters long or short trades when prices…
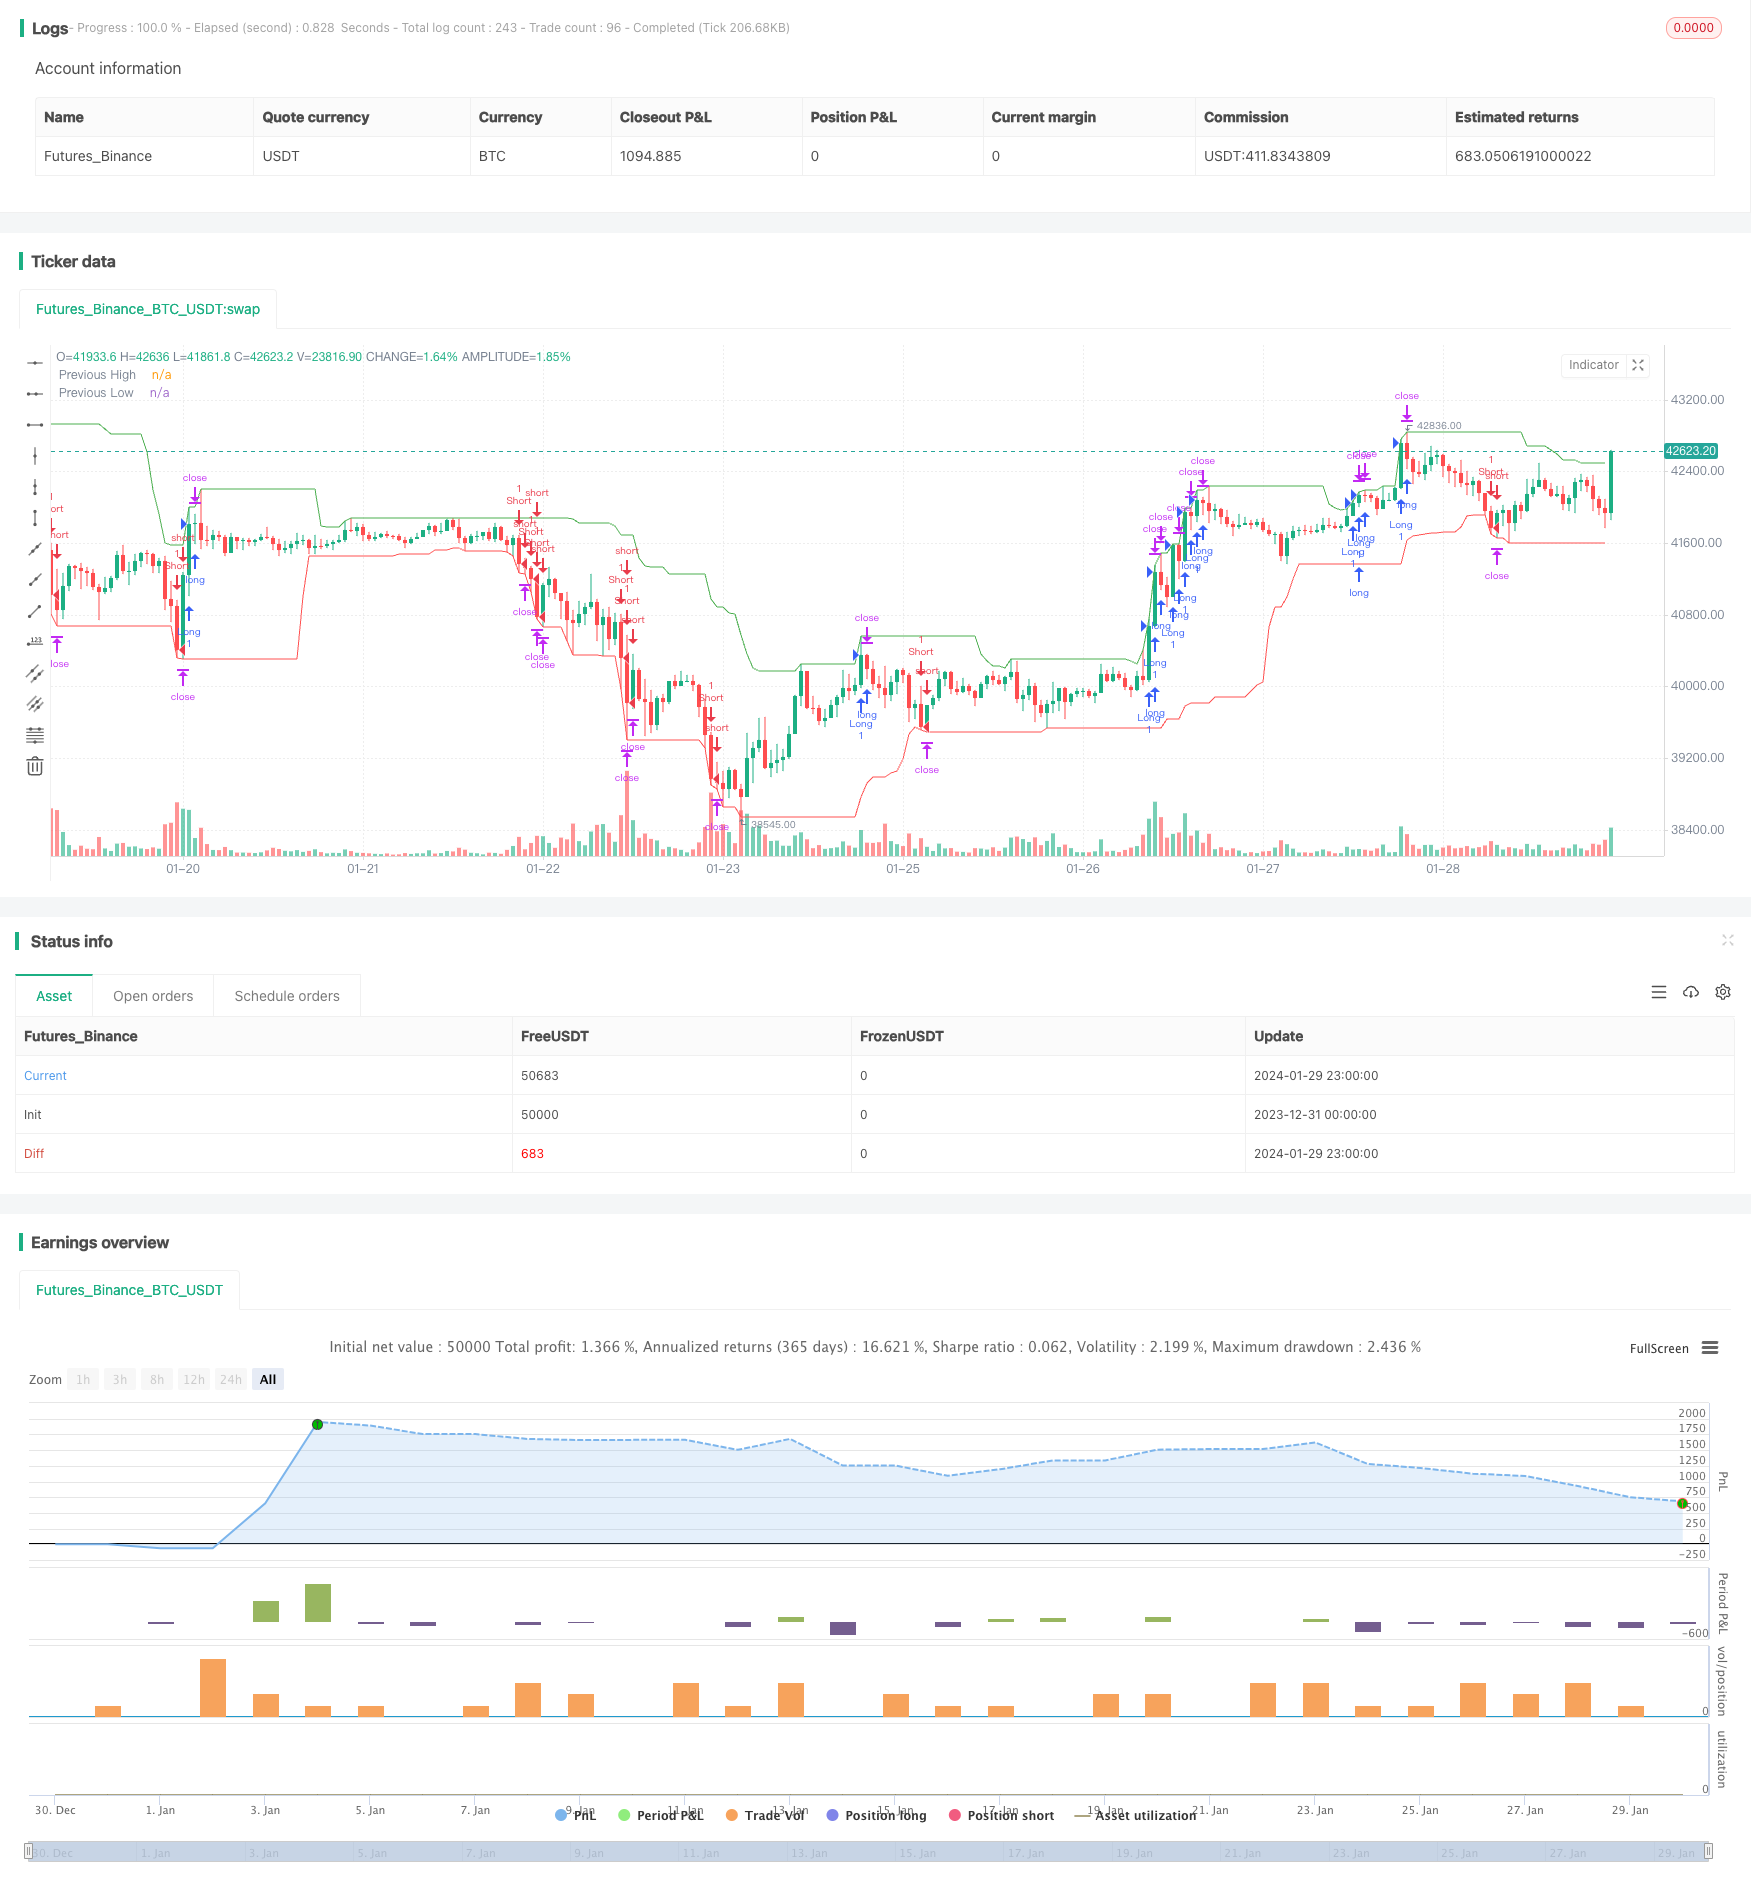
Overview
This is a momentum-based trend following breakout trading strategy. It calculates the highest and lowest prices over a certain period to determine the trend direction, and enters long or short trades when prices break key levels.
Strategy Logic
The core logic of this strategy is:
Use the highest() and lowest() functions to calculate the highest and lowest prices of the recent 20 candlesticks, as momentum indicators to judge the trend.
When the latest close price breaks above the highest price of the previous period, go long. This is an upward breakout signal.
When the latest close price breaks below the lowest price of the previous period, go short. This is a downward breakout signal.
To control risks, set a 1% stop loss distance and 2% take profit distance, giving a risk-reward ratio of 2:1.
Plot the highest and lowest prices within the 20 candlesticks to visually determine the trend direction and breakout levels.
The above is the core trading logic of this strategy. It uses momentum indicators to judge the trend, and trades breakouts of key levels, making it a trend following breakout strategy.
Advantages
The advantages of this strategy include:
Catching the direction and strength of trends with high precision. Calculating highest and lowest prices helps filter out false signals from range-bound markets.
Simple and clear logic. Just long above previous highest, and short below previous lowest. Easy to understand and implement.
Controllable risks. The max loss is 1% and max profit is 2% with stop loss and take profit set, giving a reasonable risk-reward ratio.
Easy to optimize. The calculation period can be adjusted for better entry timing. Stop loss and take profit levels can also be tuned for more profits or lower risks.
Risks
There are also some risks:
Stop loss being hit is still possible with fast, huge price swings.
Missing reversal signals if the calculation period is too long. Trend judgment then lags behind.
Improper parameter settings may lead to unprofitability. The calculation period and stop loss/take profit levels need careful testing and optimization.
Optimization
This strategy can be improved in aspects like:
Adding filters to ensure sufficient trend strength before entering trades. Trend metrics can be used.
Adjusting the period parameter to balance timeliness and stability of trend judgment. Too short leads to false signals, too long leads to lag.
Incorporating trailing stop loss to lock in profits and avoid stop loss being hit.
Parameter optimization through historical backtesting to find the optimal combinations of settings.
Conclusion
This is a typical trend following breakout trading strategy. It uses momentum indicators to determine the trend, and trades breakouts of key levels. The pros are simplicity, controllable risks, and ease of understanding/optimization. But it may underperform in certain market environments. Further optimizations can improve its robustness and efficiency.
Parameters
| Name | Default | What it controls |
|---|---|---|
| v_input_1 | 20 | Length |
| v_input_2 | true | Stop Loss % |
Source Pine Script
/*backtest
start: 2023-12-31 00:00:00
end: 2024-01-30 00:00:00
period: 1h
basePeriod: 15m
exchanges: [{"eid":"Futures_Binance","currency":"BTC_USDT"}]
*/

//@version=4
strategy("Trend Following Breakout Strategy with 2:1 RRR", overlay=true)

// Define calculation of previous high and low
length = input(20, minval=1, title="Length")
highestHigh = highest(high, length)
lowestLow = lowest(low, length)

// Define conditions for buying and selling
longCondition = close > highestHigh[1] // The current closing price is higher than the previous period's high
shortCondition = close < lowestLow[1] // The current closing price is lower than the previous period's low

// To ensure a profit-loss ratio of2:1,We need to define stop-loss and target price
stopLoss = input(1, title="Stop Loss %") / 100
takeProfit = stopLoss * 2

// If buy conditions are met, enter long
if (longCondition)
    strategy.entry("Long", strategy.long)
    strategy.exit("Long TP", "Long", profit=takeProfit * close, loss=stopLoss * close)

// If sell conditions are met, enter short
if (shortCondition)
    strategy.entry("Short", strategy.short)
    strategy.exit("Short TP", "Short", profit=takeProfit * close, loss=stopLoss * close)

// Drawing shows previous high and previous low
plot(highestHigh, color=color.green, title="Previous High")
plot(lowestLow, color=color.red, title="Previous Low")
Published by ChaoZhang on the FMZ strategy square · last modified 2024-01-31. Collected in the Quant Trading Vault. Unvalidated research: re-test with your own data and costs before trusting it.
Build this with AgenKit
A spec is not a trading system. Paste this into your coding agent and AgenKit runs a specialist team — architecture, test-first build, risk gates, review — with paper trading on by default.
/agenkit build a production-grade trading bot with a backtest engine, risk controls and paper trading by default from strategies/Momentum-Breakout-Trading-Strategy-440531.md- npx agenkit install engineering-kit in your project
- Paste the command into your agent and approve each phase
- Get tests, backtest, risk controls and a paper-trading switch
Understand it first
Before you run this, read the lesson behind the idea and how to backtest it honestly. Specs like this one are the survivors of an unknown number of trials; deflate their results accordingly.
Related specs
- 5 Day Moving Average Channel Breakout Strategy Combined With Mileage ConceptPine Script · Breakout · 1d
- ATR Trailing Stops StrategyPine Script · Breakout · 1h
- ATR Trend Breakout StrategyPine Script · Breakout · 1d
- Adaptive Bollinger Breakout with Moving Average Quantitative Strategy SystemPine Script · Breakout · 1h
- Adaptive Channel Breakout StrategyPine Script · Breakout · 1d
- Adaptive Multi Period Trading Strategy Based on Wave Trend Momentum BreakoutPine Script · Breakout · 2h