Momentum Enhanced SuperTrend Stochastic Dual Indicator Trading Strategy
This is a composite trading strategy that combines the SuperTrend indicator with the Stochastic Oscillator. The strategy utilizes SuperTrend to identify market trend direction while using the Stochastic Oscillator to…
Overview
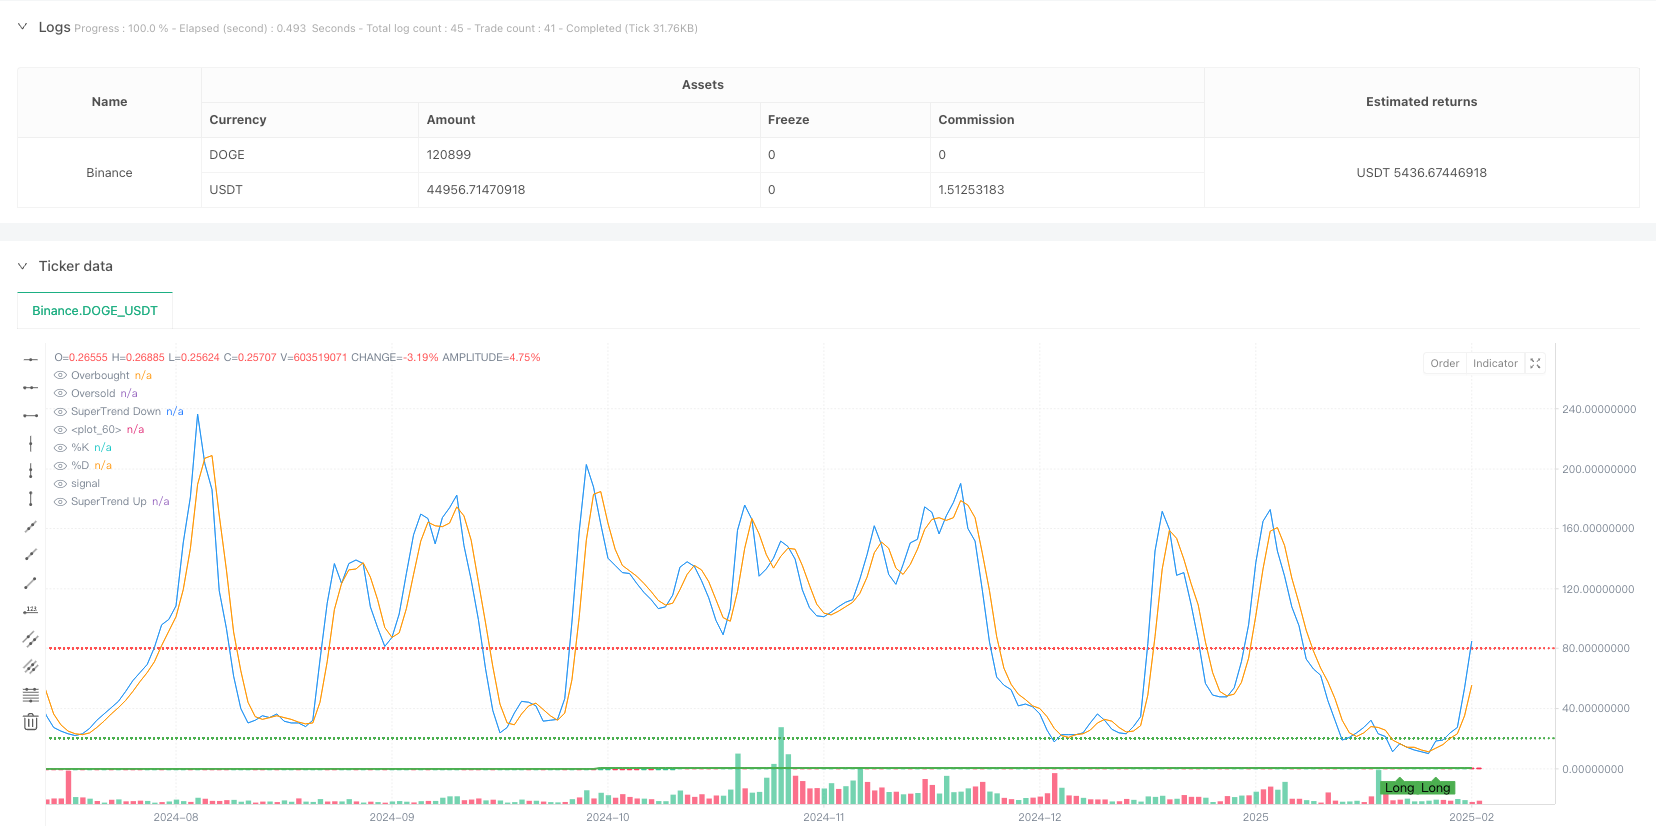
This is a composite trading strategy that combines the SuperTrend indicator with the Stochastic Oscillator. The strategy utilizes SuperTrend to identify market trend direction while using the Stochastic Oscillator to confirm price momentum, thereby generating more accurate trading signals. The strategy employs ATR (Average True Range) as volatility reference, tracking trends through dynamic support/resistance level adjustments.
Strategy Principles
The core logic is based on the following key components:
- SuperTrend indicator uses 10-period ATR and 3.0 multiplier to calculate dynamic support/resistance channels
- Stochastic Oscillator adopts classic parameters (14,3,3) to identify overbought/oversold areas
- Long conditions require:
- SuperTrend indicates bullish trend
- Stochastic %K line crosses above %D line
- %K value is in oversold area (below 20)
- Short conditions require:
- SuperTrend indicates bearish trend
- Stochastic %K line crosses below %D line
- %K value is in overbought area (above 80)
Strategy Advantages
- Combines trend following and momentum confirmation, significantly improving signal reliability
- Uses ATR to dynamically adjust SuperTrend channel width, better adapting to market volatility
- Filters extreme area counter-trend trades through Stochastic indicator's overbought/oversold levels
- Strict signal conditions effectively filter false breakouts, reducing fake signals
- Clear strategy logic with adjustable parameters, suitable for different market environments
Strategy Risks
- May generate excessive trading signals in ranging markets, increasing transaction costs
- Strict signal conditions might miss some potential trading opportunities
- SuperTrend indicator may lag during violent volatility
- Stochastic indicator might generate premature reversal signals in strong trend markets Recommended risk control measures:
- Set reasonable stop-loss and take-profit levels
- Consider adding trend strength filter (like ADX)
- Dynamically adjust parameters based on market environment
Strategy Optimization Directions
- Introduce trend strength indicator (like ADX) to optimize trade filtering:
- Only enter positions during clear trends
- Can avoid frequent trading in ranging markets
- Optimize Stochastic indicator parameters:
- Consider using adaptive periods
- Dynamically adjust overbought/oversold thresholds based on volatility
- Improve money management system:
- Set dynamic stop-loss levels based on ATR
- Implement dynamic profit target adjustments
- Add time filtering functionality:
- Avoid low liquidity periods
- Pause trading before important data releases
Summary
The strategy achieves an organic combination of trend following and momentum confirmation by combining SuperTrend and Stochastic Oscillator. The strategy design is reasonable with good adjustability and adaptability. Through the suggested optimization directions, the strategy's stability and profitability can be further improved. In live trading, it is recommended that traders make targeted parameter adjustments based on specific market characteristics and their own risk preferences.
Source Pine Script
/*backtest
start: 2024-02-21 00:00:00
end: 2025-02-18 08:00:00
period: 1d
basePeriod: 1d
exchanges: [{"eid":"Binance","currency":"DOGE_USDT"}]
*/

//@version=5
strategy("SuperTrend + Stochastic Strategy", overlay=true, default_qty_type=strategy.percent_of_equity, default_qty_value=10)

// === Vstupy ===
// SuperTrend
atrPeriod = input.int(10, title="ATR Period", minval=1)
multiplier = input.float(3.0, title="SuperTrend Multiplier", step=0.1)

// Stochastic Oscillator
kPeriod = input.int(14, title="%K Period", minval=1)
dPeriod = input.int(3, title="%D Period", minval=1)
smoothK = input.int(3, title="Smooth %K", minval=1)

// === Výpočty Indikátorov ===
// Výpočet ATR
atr = ta.atr(atrPeriod)

// Výpočet SuperTrend
upperBasic = (ta.highest(high, 1) + ta.lowest(low, 1)) / 2 + (multiplier * atr)
lowerBasic = (ta.highest(high, 1) + ta.lowest(low, 1)) / 2 - (multiplier * atr)

var float upperBand = na
var float lowerBand = na
var bool isBullish = true

if (na(upperBand[1]))
    upperBand := upperBasic
    lowerBand := lowerBasic
else
    upperBand := close[1] > upperBand[1] ? math.max(upperBasic, upperBand[1]) : upperBasic
    lowerBand := close[1] < lowerBand[1] ? math.min(lowerBasic, lowerBand[1]) : lowerBasic

isBullish := close > upperBand[1] ? true : close < lowerBand[1] ? false : isBullish[1]

// Výpočet Stochastic Oscillator
stochK = ta.sma(ta.stoch(high, low, close, kPeriod), smoothK)
stochD = ta.sma(stochK, dPeriod)

// === Podmienky Pre Vstupy ===
// Nákupný signál
longCondition = isBullish and ta.crossover(stochK, stochD) and stochK < 20

// Predajný signál
shortCondition = not isBullish and ta.crossunder(stochK, stochD) and stochK > 80

// === Vstupné Signály ===
if (longCondition)
    strategy.entry("Long", strategy.long)

if (shortCondition)
    strategy.entry("Short", strategy.short)

// === Výstupné Podmienky ===
// Môžete pridať vlastné podmienky pre uzatvorenie pozícií alebo použitie stop-loss/take-profit

// === Vykreslenie Indikátorov na Grafe ===
// Vykreslenie SuperTrend
plot(isBullish ? upperBand : na, color=color.green, title="SuperTrend Up", linewidth=2)
plot(not isBullish ? lowerBand : na, color=color.red, title="SuperTrend Down", linewidth=2)
fill(plot(isBullish ? upperBand : na, color=color.green), plot(not isBullish ? lowerBand : na, color=color.red), color=isBullish ? color.new(color.green, 90) : color.new(color.red, 90), title="SuperTrend Fill")

// Vykreslenie Stochastic Oscillator na samostatnom okne
hline(80, "Overbought", color=color.red, linestyle=hline.style_dotted)
hline(20, "Oversold", color=color.green, linestyle=hline.style_dotted)
plot(stochK, color=color.blue, title="%K")
plot(stochD, color=color.orange, title="%D")

// Vizualizácia Signálov
plotshape(series=longCondition, title="Long Entry", location=location.belowbar, color=color.green, style=shape.labelup, text="Long")
plotshape(series=shortCondition, title="Short Entry", location=location.abovebar, color=color.red, style=shape.labeldown, text="Short")
Published by ianzeng123 on the FMZ strategy square · last modified 2025-02-20. Collected in the Quant Trading Vault. Unvalidated research: re-test with your own data and costs before trusting it.
Build this with AgenKit
A spec is not a trading system. Paste this into your coding agent and AgenKit runs a specialist team — architecture, test-first build, risk gates, review — with paper trading on by default.
/agenkit build a production-grade trading bot with a backtest engine, risk controls and paper trading by default from strategies/Momentum-Enhanced-SuperTrend-Stochastic-Dual-Indicator-Trading-Strategy.md- npx agenkit install engineering-kit in your project
- Paste the command into your agent and approve each phase
- Get tests, backtest, risk controls and a paper-trading switch
Understand it first
Before you run this, read the lesson behind the idea and how to backtest it honestly. Specs like this one are the survivors of an unknown number of trials; deflate their results accordingly.
Related specs
- Multi Indicator Comprehensive Analysis Quantitative Trading Strategy Trend Momentum and Volatility Collaborative Prediction ModelPine Script · Momentum · 3m
- Oscillator Candles Momentum Trading StrategyPine Script · Momentum · 1h
- Advanced Multi Indicator Trend Following and Momentum Quantitative Trading StrategyPine Script · Momentum · 1h
- Momentum Trend Following SuperTrend and Stochastic Crossover StrategyPine Script · Momentum · 2d
- The Momentum Tracking and Trend StrategyPine Script · Momentum · 1d
- Trend Following Strategy Based on Support Resistance and Momentum Indicators Across Multiple TimeframesPine Script · Momentum · 1d