Momentum Exhaustion Strategy
The Momentum Exhaustion Strategy is a trend following strategy that utilizes moving averages and price percentage oscillators to minimize downside exposure. It belongs to index fund trading models and can effectively…
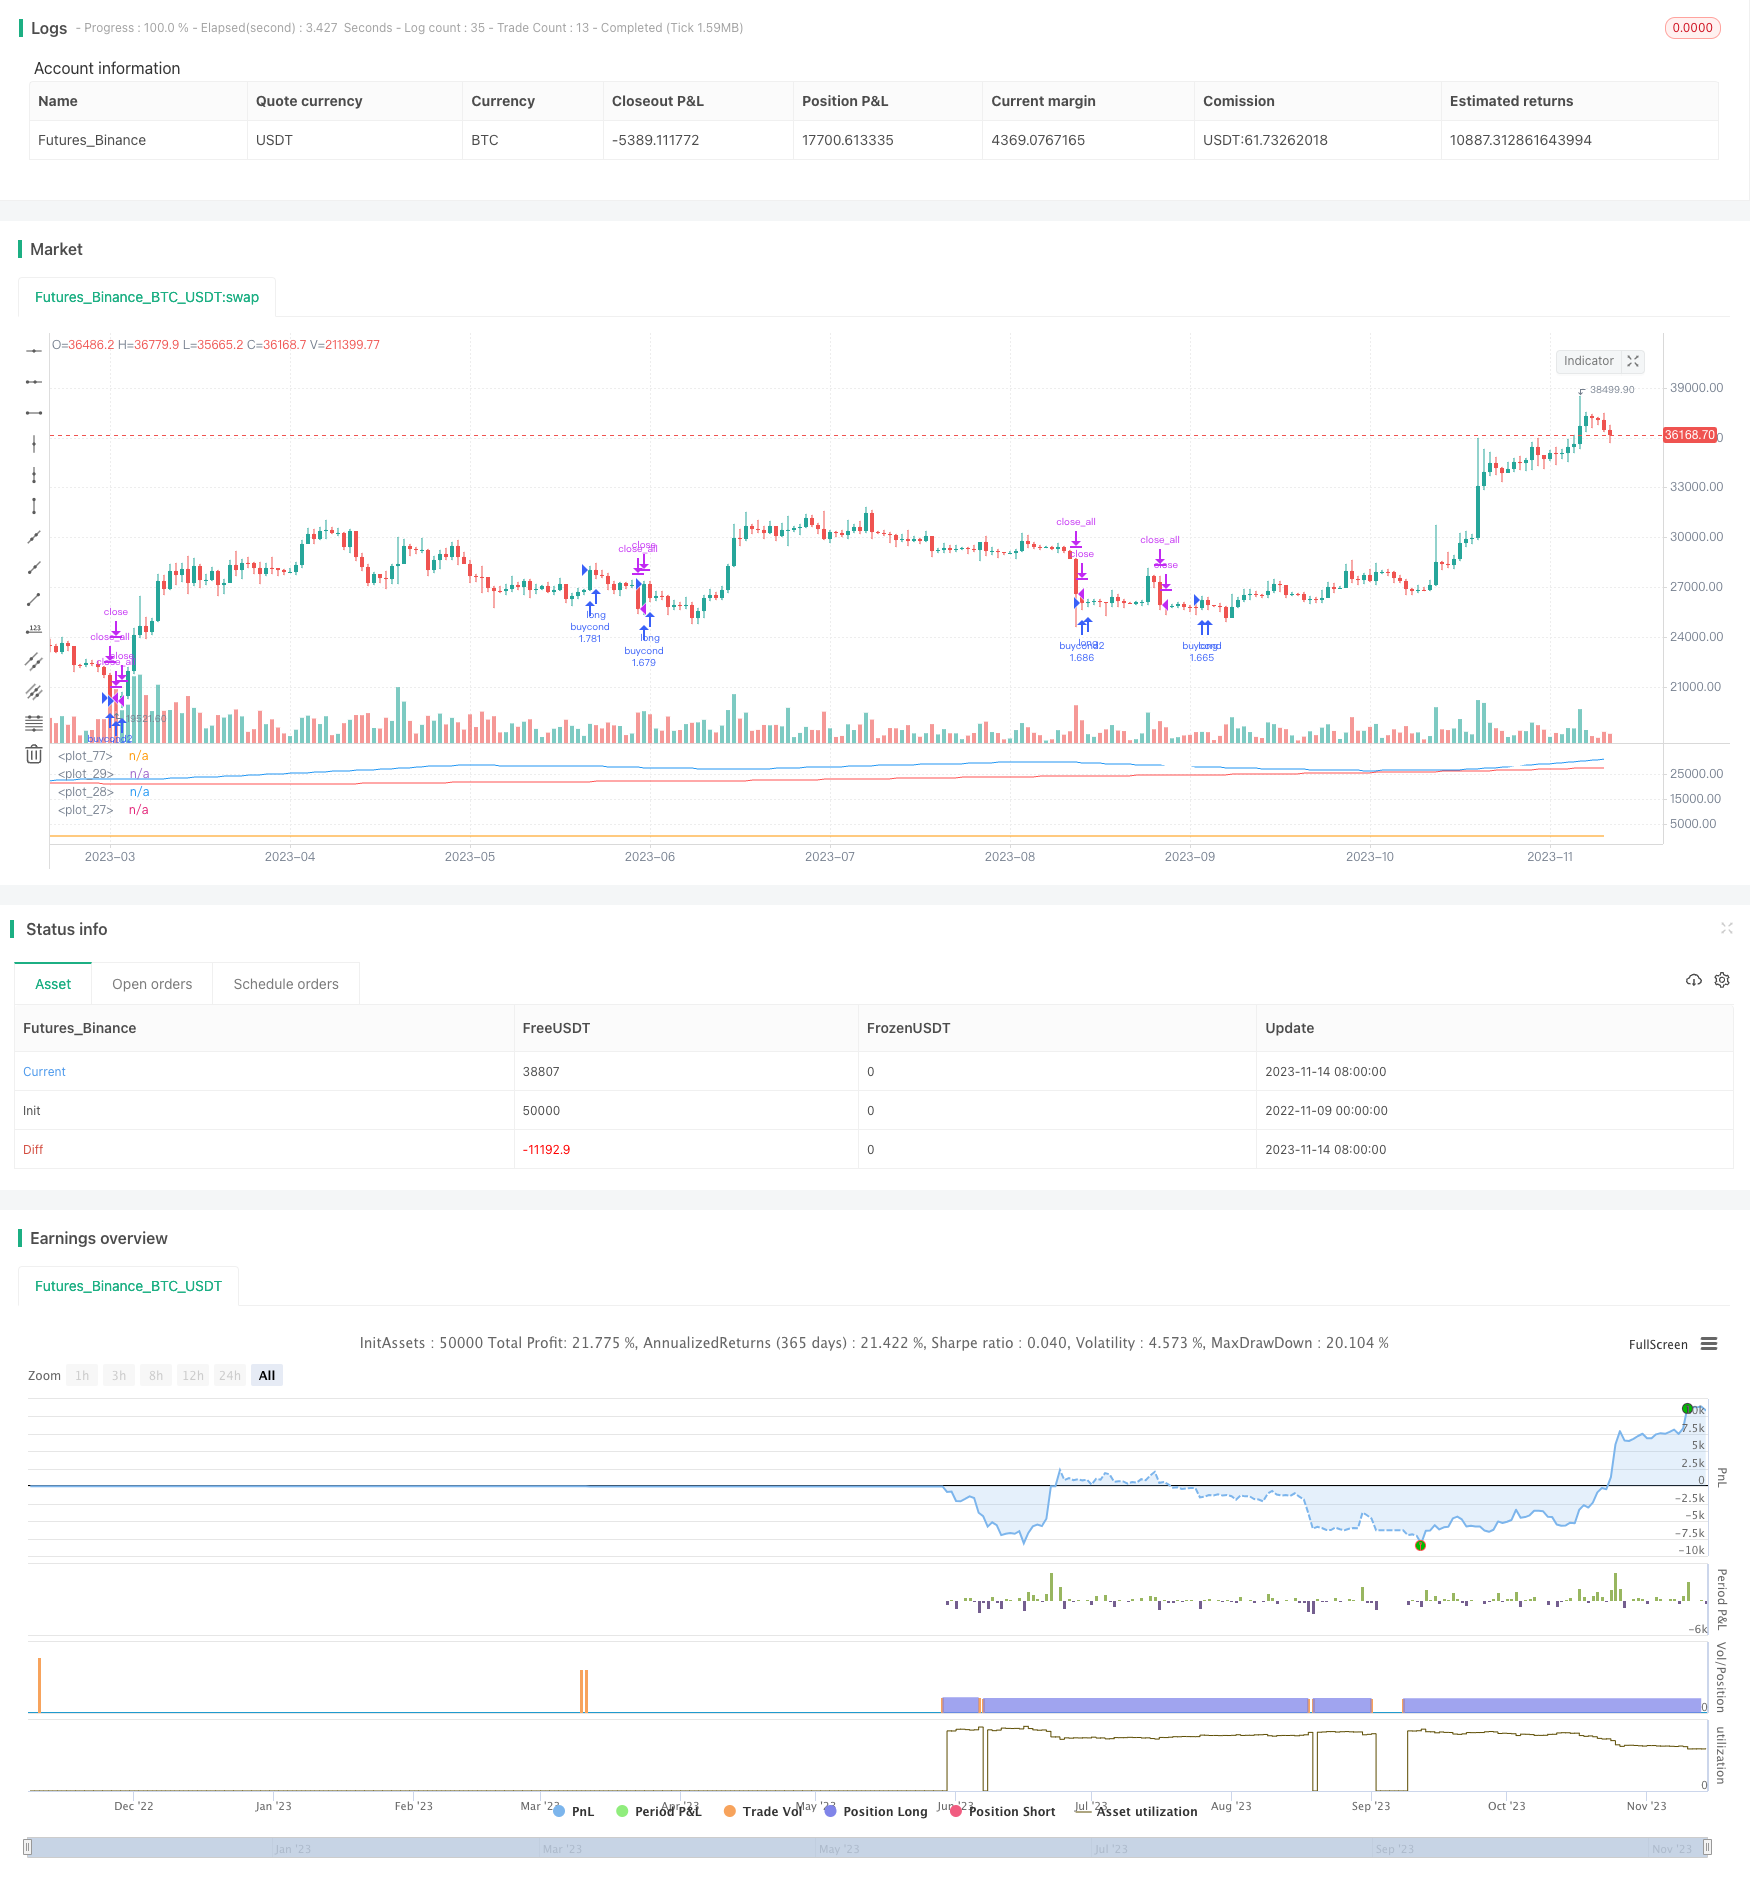
Overview
The Momentum Exhaustion Strategy is a trend following strategy that utilizes moving averages and price percentage oscillators to minimize downside exposure. It belongs to index fund trading models and can effectively control risks.
Strategy Logic
The core indicators of this strategy are Exhaustion and Exhaustion Moving Average. Exhaustion is a measure of price oscillation, calculated from close, high and low prices. The specific calculation is: (close+high+low-moving average of Exhaustion)/moving average of Exhaustion. The Exhaustion Moving Average is the moving average of Exhaustion. When Exhaustion crosses above Exhaustion Moving Average, it indicates consolidation in the market and a possible new trend forming. When Exhaustion crosses below Exhaustion Moving Average, it signals a trend reversal and we should consider taking profit.
In addition, the strategy also uses long and short term moving averages to assist in determining the trend, including 300-day, 150-day and 50-day lines. When the short term moving average crosses below the long term moving average, it signals a trend reversal and we should consider stopping loss.
MACD is also used for short-term buy and sell signals. When MACD line crosses above signal line, it indicates a bullish signal, and when MACD crosses below signal line, it indicates a bearish signal. RSI bottoms are also used as buy signals.
The specific entry and exit logic is:
Buy signal: Exhaustion crossing above Exhaustion Moving Average, and 50-day MA above 150-day MA; or RSI below 30.
Short-term stop loss: Exhaustion crossing below Exhaustion Moving Average; or MACD crossing below signal line.
Mid-long term stop loss: 50-day MA crossing below 150-day MA; or 150-day MA crossing below 300-day MA.
Advantages of the Strategy
This strategy combines multiple indicators to determine the trend exhaustion and control risks. The advantages are:
The Exhaustion indicator can effectively identify consolidation and reversal. Timely detecting trend reversal is key to controlling risks.
Using moving averages of multiple timeframes to determine the trend avoids being misled by short-term market noise.
MACD helps confirm buy and sell signals, improving the strategy's performance.
RSI plays its role of buying low and selling high, buying at extremely oversold situations.
The clear profit taking and stop loss strategy can effectively control the risk of each trade.
Risks of the Strategy
There are also some risks with this strategy:
Relying on multiple indicators, improper parameter settings may lead to wrong trading signals. Parameters need to be repeatedly tested and optimized.
The Exhaustion indicator is not completely reliable, it may fail when there is price divergence.
Improper stop loss placement may result in being stopped out by short-term fluctuations. Stop loss should balance long and short term effects.
When the overall market is ranging, the indicators may fail. Position sizing needs to be controlled.
Optimization Directions
The strategy can be optimized in the following aspects:
Test different parameter combinations to find the optimal parameters and reduce false signals. Key adjustable parameters include moving average periods, Exhaustion periods etc.
Incorporate volatility indicators like ATR to dynamically adjust stop loss range according to market volatility.
Optimize position sizing, with different position sizing rules for different market conditions.
Incorporate chart patterns like trendlines, support lines to improve strategy performance.
Add machine learning algorithms to assist in gauging the effectiveness of key indicators, realizing dynamic optimization.
Conclusion
The Momentum Exhaustion Strategy combines multiple indicators to identify trend reversal and control risks. It has trend following capability and can effectively determine entry and exit points. Further improvements can be made through parameter optimization, stop loss rules, incorporating chart patterns and more. Overall it has adaptability to market fluctuations and can be considered as a risk control strategy option.
Parameters
| Name | Default | What it controls |
|---|---|---|
| v_input_1 | 12 | Fast Length |
| v_input_2 | 26 | Slow Length |
| v_input_3_close | 0 | Source: close | high | low | open | hl2 | hlc3 | hlcc4 | ohlc4 |
| v_input_4 | 9 | Signal Smoothing |
| v_input_5 | false | Simple MA (Oscillator) |
| v_input_6 | false | Simple MA (Signal Line) |
| v_input_7 | 14 | Length |
Source Pine Script
/*backtest
start: 2022-11-09 00:00:00
end: 2023-11-15 00:00:00
period: 1d
basePeriod: 1h
exchanges: [{"eid":"Futures_Binance","currency":"BTC_USDT"}]
*/

// This source code is subject to the terms of the Mozilla Public License 2.0 at https://mozilla.org/MPL/2.0/
// © spiritualhealer117

//@version=4

strategy("Infiten Slope Strategy", overlay=false,calc_on_every_tick = true, default_qty_type=strategy.percent_of_equity, default_qty_value = 100)
// //TIME RESTRICT FOR BACKTESTING {
// inDateRange = (time >= timestamp(syminfo.timezone, 2003,
//          1, 1, 0, 0)) and
//      (time < timestamp(syminfo.timezone, 2021, 5, 25, 0, 0))
// //}

//OPTIMAL PARAMETERS {
daysback = 30
volumesens = 1.618
//}
//Calculating Exhaustion and Exhaustion Moving Average {
clh = close+low+high
exhaustion = (clh-sma(clh,daysback))/sma(clh,daysback)
exhaustionSma = sma(exhaustion,daysback)
//}
//Long Term Moving Averages for sell signals {
red = sma(close,300)
white = sma(close,150)
blue = sma(close,50)

plot(red,color=color.red)
plot(white,color=color.white)
plot(blue,color=color.blue)
//}
//MACD Calculation {
fast_length = input(title="Fast Length", type=input.integer, defval=12)
slow_length = input(title="Slow Length", type=input.integer, defval=26)
src = input(title="Source", type=input.source, defval=close)
signal_length = input(title="Signal Smoothing", type=input.integer, minval = 1, maxval = 50, defval = 9)
sma_source = input(title="Simple MA (Oscillator)", type=input.bool, defval=false)
sma_signal = input(title="Simple MA (Signal Line)", type=input.bool, defval=false)
// Calculating
fast_ma = sma_source ? sma(src, fast_length) : ema(src, fast_length)
slow_ma = sma_source ? sma(src, slow_length) : ema(src, slow_length)
macd = fast_ma - slow_ma
signal = sma_signal ? sma(macd, signal_length) : ema(macd, signal_length)
hist = macd - signal
//}
//SIGMOID Bottom {
timeAdjust = 300/sma(close,500)
//}
//RSI bottom {
len = input(14, minval=1, title="Length")
up = rma(max(change(src), 0), len)
down = rma(-min(change(close), 0), len)
rsi = down == 0 ? 100 : up == 0 ? 0 : 100 - (100 / (1 + up / down))
//}

//Entry and exit conditions {
//Sell conditions
bigVolume = sma(volume,30)*volumesens
sellcond1 = crossunder(exhaustion,exhaustionSma) and volume > bigVolume
sellcond2 = crossunder(macd,signal) and volume > bigVolume
midtermsellcond1 = crossunder(blue,white)
longtermsellcond1 = white < red

//Buy conditions
buycond = crossover(exhaustion,exhaustionSma) and not longtermsellcond1
buycond2 = rsi < 30
buycond3 = crossover(blue,white) and longtermsellcond1
//}

//Backtest Run Buy/Sell Commands {
strategy.entry("buycond",true, when=buycond and bigVolume)
strategy.entry("buycond2",true, when=buycond2 and bigVolume)

strategy.close_all(when=sellcond1,comment="short term sell signal 1")
strategy.close_all(when=midtermsellcond1, comment="mid term sell signal 1")
strategy.close_all(when=longtermsellcond1, comment="long term sell signal 1")
strategy.close_all(when=sellcond2, comment="short term sell signal 2")
plot(strategy.position_size)

//Sell on last tested day (only for data collection)
//strategy.close_all(when=not inDateRange)
//}
Published by ChaoZhang on the FMZ strategy square · last modified 2023-11-16. Collected in the Quant Trading Vault. Unvalidated research: re-test with your own data and costs before trusting it.
Build this with AgenKit
A spec is not a trading system. Paste this into your coding agent and AgenKit runs a specialist team — architecture, test-first build, risk gates, review — with paper trading on by default.
/agenkit build a production-grade trading bot with a backtest engine, risk controls and paper trading by default from strategies/Momentum-Exhaustion-Strategy.md- npx agenkit install engineering-kit in your project
- Paste the command into your agent and approve each phase
- Get tests, backtest, risk controls and a paper-trading switch
Understand it first
Before you run this, read the lesson behind the idea and how to backtest it honestly. Specs like this one are the survivors of an unknown number of trials; deflate their results accordingly.
Related specs
- KST EMA Momentum Trend Following StrategyPine Script · Momentum · 1d
- MACD Momentum Indicator Backtest StrategyPine Script · Momentum · 1h
- MoonFlag MACD Momentum StochRSI Trading StrategyPine Script · Momentum · 1d
- Multi Indicator Trend Momentum Trading Strategy with Dynamic Risk Management SystemPine Script · Momentum · 1h
- Multi factor Adaptive Momentum Tracking StrategyPine Script · Momentum · 3m
- Dual Momentum Oscillator Smart Timing Trading StrategyPine Script · Momentum · 1h